. 2021 Jun;78(11):4993-5014.
doi: 10.1007/s00018-021-03837-3. Epub 2021 Apr 21.

Mapping the expression of transient receptor potential channels across murine placental development

Affiliations

Mapping the expression of transient receptor potential channels across murine placental development

Katrien De Clercq et al. Cell Mol Life Sci. 2021 Jun.

Abstract

Transient receptor potential (TRP) channels play prominent roles in ion homeostasis by their ability to control cation influx. Mouse placentation is governed by the processes of trophoblast proliferation, invasion, differentiation, and fusion, all of which require calcium signaling. Although certain TRP channels have been shown to contribute to maternal-fetal transport of magnesium and calcium, a role for TRP channels in specific trophoblast functions has been disregarded. Using qRT-PCR and in situ hybridisation, the spatio-temporal expression pattern of TRP channels in the mouse placenta across gestation (E10.5-E18.5) was assessed. Prominent expression was observed for Trpv2, Trpm6, and Trpm7. Calcium microfluorimetry in primary trophoblast cells isolated at E14.5 of gestation further revealed the functional activity of TRPV2 and TRPM7. Finally, comparing TRP channels expression in mouse trophoblast stem cells (mTSCs) and mouse embryonic stem cells (mESC) confirmed the specific expression of TRPV2 during placental development. Moreover, TRP channel expression was similar in mTSCs compared to primary trophoblasts and validate mTSC as a model to study TRP channels in placental development. Collectivity, our results identify a specific spatio-temporal TRP channel expression pattern in trophoblasts, suggesting a possible involvement in regulating the process of placentation.

Keywords: Placental development; Primary trophoblast cells; TRP channels; Trophoblast stem cells.


Conflict of interest statement

The authors declare that they have no conflict of interest.

Figures

Fig. 1
Fig. 1
Quantitative RT-PCR showing TRP channel expression in placentas from C57BL/6 mice through gestation. a Heat map of mRNA levels of TRP channels relatively quantified to the geometric mean of housekeeping genes Actb and Gapdh and then normalized to the average Trpm7 expression of all gestational days. nd non detectable. b Normalized fold change of expressed TRP channel compared to expression at E10.5, shown as mean ± SEM. Significant differences in mRNA expression were assessed with one-ANOVA followed by Dunnett’s multiple comparison test or Kruskal–Wallis test followed by Dunn’s multiple comparisons test compared to E10.5, using DeltaCT values. α: p < 0.05, β: p < 0.01, γ: p < 0.001, δ: p < 0.0001. E embryonic day. n = 4 placentas from three different litters
Fig. 2
Fig. 2
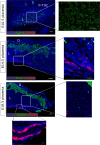
TRPV2 expression in premature placenta. mRNA in situ hybridisation of Trpv2, Pl-1 as a marker for P-TGC, Cdh1 as a marker for undifferentiated chorion and syncytiotrophoblasts-II cells. An overview of the E10.5 placenta is shown in the upper panels (scale bare = 200 µm). Magnifications of inserts A and B are presented below (scale bar = 25 and 50 µm). DAPI was used for nuclear staining. P-TGC parietal trophoblast giant cells, L labyrinth, Sp spongiotrophoblast, D decidua, Pl-1 placental lactogen-1, Cdh1 E-cadherin, *maternal artery
Fig. 3
Fig. 3
Trpv2 expression in mature placenta. mRNA in situ hybridisation of Trpv2, Tpbpa as a marker for the junctional zone and Plf as a marker for certain TGCs. An overview of the E14.5 placenta is shown in the upper panels (scale bare = 200 µm). Magnifications of inserts A (Jz) and B (labyrinth) are presented below (scale bar = 50 µm). DAPI was used for nuclear staining. In A, a Tpbpa/Plf+ TGC of the junctional zone is circled. L labyrinth, Jz junctional zone, D decidua, Tpbpa trophoblast-specific protein alpha, Plf proliferin
Fig. 4
Fig. 4
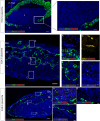
Trpv6 expression in placenta. mRNA in situ hybridisation of Trpv6 at E10.5, E14.5, and E18.5. At E10.5, and Cdh1 for undifferentiated chorion and syncytiotrophoblasts-II cells. At E14.5, Pl-2 was a marker for spongiotrophoblasts and secondary TGCs. At E18.5, Tpbpa was a marker for the junctional zone. An overview of the placentas is shown on the left (scale bare = 200 µm). Magnifications of inserts are presented right (scale bar = 50 µm at E10.5, and 25 µm at E14.5 and E18.5. DAPI was used for nuclear staining. P-TGC parietal trophoblast giant cells, L labyrinth, D decidua, Cdh1 E-cadherin, Tpbpa trophoblast-specific protein alpha, Pl-2 placental lactogen 2
Fig. 5
Fig. 5
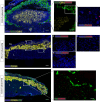
Trpv4 expression in placenta. mRNA in situ hybridisation of Trpv4, Pl-1 as a marker for the primary TGC, Plf as a marker for secondary TGCs. An overview of the E10.5 placenta is shown in the upper panels (scale bare = 200 µm) and magnifications of insert (scale bar = 100 µm). An overview of E14.5 placenta is shown in the middle panel (scale bar = 200 µm) and magnifications of inserts A (decidua), B (Jz) and C (labyrinth) (scale bar = 25 µm). A’ represent the same image as A in which RBC were shown. An overview of E18.5 placenta is shown in the lower panel (scale bar = 200 µm) and magnifications of inserts A (decidua), B (Jz) and C (labyrinth) (scale bar = 25 µm). DAPI was used for nuclear staining. P-TGC parietal trophoblast giant cells, L labyrinth, Jz junctional zone, De decidua, Tpbpa trophoblast-specific protein alpha, Plf proliferin, RBC red blood cells
Fig. 6
Fig. 6
Trpm4 expression in placenta. mRNA in situ hybridisation of Trpm4, PL-1 as a marker for the primary TGC, Cdh1 as a marker for undifferentiated chorion and syncytiotrophoblasts-II cells, Tpbpa as a marker for junctional zone cells, Plf as a marker for secondary TGCs. An overview of the E10.5 placenta is shown in the upper panels (scale bare = 200 µm) and magnifications of insert (scale bar = 100 µm and 25 µm). An overview of E14.5 placenta is shown in the middle panel (scale bar = 200 µm) and magnifications of inserts A (decidua), B (Jz) and C (labyrinth) (scale bar = 25 µm). An overview of E18.5 placenta is shown in the lower panel (scale bar = 200 µm) and magnifications of inserts (scale bar = 100 µm). DAPI was used for nuclear staining. L labyrinth, Jz junctional zone, De decidua, Tpbpa trophoblast-specific protein alpha, Prl proliferin,
Fig. 7
Fig. 7
Functional expression of TRPV2 and TRPM7 in primary trophoblast cells at E14.5. a Relative expression of TRP channels that were above detection level in whole placental tissues, relative to the geometric mean of housekeeping genes Gapdh and Actb. Colours indicate expression level; red = high, orange = moderate, blue = low, and n.d. = below detection level. N = 4 cultures. b Example traces of Mibefradil (Mib, 200 µm)—induced intracellular calcium changes ([Ca2+]i), with each line representing a cell. c Percentage of responding trophoblast cells to activators (MIB: 1302 of 1336 cells; THC: 956 of 1470 cells; GSK 43 of 1475 cells; EA: 11 of 990 cells). d Amplitude of intracellular calcium increase in responding cells, represented as the difference between the peak value and the baseline value. e Example traces of Δ9-tetrahydrocannabinol (THC, 50 µm)—induced intracellular calcium changes, that could be blocked by the nonspecific TRPV inhibitor Ruthenium Red (RR, 2 µm) (f). ML-193 = specific GPR55 (cannabinoid receptor 3) blocker and was coapplied with THC. g Percentage of responders to THC in the presence (43 of 889 cells responding) and subsequent absence of RR (717 of 889 cells responding). h Amplitude of intracellular calcium increase of THC-responding cells during and after co-application with RR. Data are presented as mean ± SEM. Statistically significant changes were assessed with paired T test. *p < 0.05, ***p < 0.001. Ionomycin (Ion, 2 µm) was added at the end of every experiment as a positive control. N = minimum six experiments from minimum three independent cultures. (i) Representative colour-coded Fura-2 [Ca2+]i ratio images during measurement of primary trophoblast cells indicated in graph e: basal situation (i), after THC application (ii), and after application of ionomycin (iii). Pseudo-colour ratio images were obtained using Nikon software. Scalebar = 100 µm. Insert shows multinucleated cell responsive to THC, scale bar = 10 µm
Fig. 8
Fig. 8
TRP channel expression in embryonic and trophoblast stem cells. a Expression of TRP channels in mouse ESC and TSC, shown as mean ± SEM. (n = 5). Differential expression was calculated using DESeq2 and adjusted for multiple testing correction using the Benjamini–Hochberg method. γ: p < 0.001, δ: p < 0.0001. Heat map of mean row-centered log2 RPKM during in vitro differentiation of mTSC as stem cells conditions, 1 day differentiation and 3 days differentiation, of marker genes (b) and TRP channels (c). Validation of gene expression with qRT-PCR in stem cell conditions (0D), 3 days and 6 days of differentiation (n = 4) of marker genes (fold change compared to 0D) (d) and TRP channels as relative expression and fold change of significantly changed genes (e). Data shown as mean ± SEM. Significant differences in mRNA expression were assessed with one-ANOVA followed by Dunnett’s multiple comparison test compared to 0D, using DeltaCT values; *p < 0.05, **p < 0.01. RPKM reads per kilobase of transcript, per million mapped reads, ESC embryonic stem cells, TSC trophoblast stem cells, nd not detected
Fig. 9
Fig. 9
Functional expression of TRPV2 and TRPM7 in mTSC differentiation. Example traces of Mibefradil (Mib, 200 µm)—induced intracellular calcium changes ([Ca2+]i), with each line representing a cell, at 0D (a) and 6D of differentiation (b). c Percentage of responding mTSC to mibefradil at 0D (1709 of 1850 cells) and 6D (338 of 409 cells). d Amplitude of intracellular calcium increase in responding cells, represented as the difference between the peak value and the baseline value. N = 4 from two mTSC differentiations. Example traces of Δ9-tetrahydrocannabinol (THC, 50 µm)—induced intracellular calcium changes at 0D (e) and 6D (f) of differentiation. Representative colour-coded Fura-2 [Ca2+]i ratio images of mTSC at 0D (e′) and 6D (f′) of differentiation at baseline (i), during application of THC (ii) and during application of ionomycin (iii), as indicated on graphs e and f. g Percentage of responding mTSC to THC at 0D (566 of 4511 cells) and 6D (480 of 864 cells); Fisher’s exact test. h Amplitude of intracellular calcium increase in responding cells; non-parametric Mann–Whitney test. N = 8–9 experiments from three mTSC differentiations. (i) Example traces of THC-induced calcium changes at 6D that could be blocked by the nonspecific TRPV inhibitor Ruthenium Red (RR, 2 µm). g Percentage of responders to THC during co-application with RR (63 of 803 cells responding) and after omission (417 of 803 cells). h Amplitude of intracellular calcium increase of THC-responding cells during and after co-application with RR. N = 6 from three mTSC differentiations. Paired T test. Data are presented as mean ± SEM. *p < 0.05; ***p < 0.001, ****p < 0.0001. Ionomycin (Ion, 2 µm) was added at the end of every experiment as a positive control. ML-193 = GPF55 antagonist

Similar articles

Cited by

References

    1. Sferruzzi-Perri AN, Camm EJ. The programming power of the placenta. Front Physiol. 2016;7:33. doi: 10.3389/fphys.2016.00033. - DOI - PMC - PubMed
    1. John R, Hemberger M. A placenta for life. Reprod Biomed Online. 2012;25(1):5–11. doi: 10.1016/j.rbmo.2012.03.018. - DOI - PubMed
    1. Gude NM, Roberts CT, Kalionis B, King RG. Growth and function of the normal human placenta. Thromb Res. 2004;114(5–6):397–407. doi: 10.1016/j.thromres.2004.06.038. - DOI - PubMed
    1. Burton GJ, Fowden AL. The placenta: a multifaceted, transient organ. Philos Trans R Soc Lond B Biol Sci. 2015;370(1663):20140066. doi: 10.1098/rstb.2014.0066. - DOI - PMC - PubMed
    1. Rossant J, Cross JC. Placental development: lessons from mouse mutants. Nat Rev Genet. 2001;2(7):538–548. doi: 10.1038/35080570. - DOI - PubMed

MeSH terms

LinkOut - more resources