. 2021 Apr 22:10:e64679.
doi: 10.7554/eLife.64679.

High-resolution imaging of skin deformation shows that afferents from human fingertips signal slip onset

Affiliations

High-resolution imaging of skin deformation shows that afferents from human fingertips signal slip onset

Benoit P Delhaye et al. Elife. .

Abstract

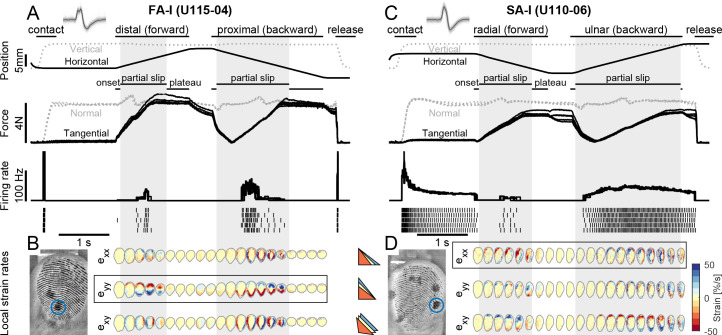
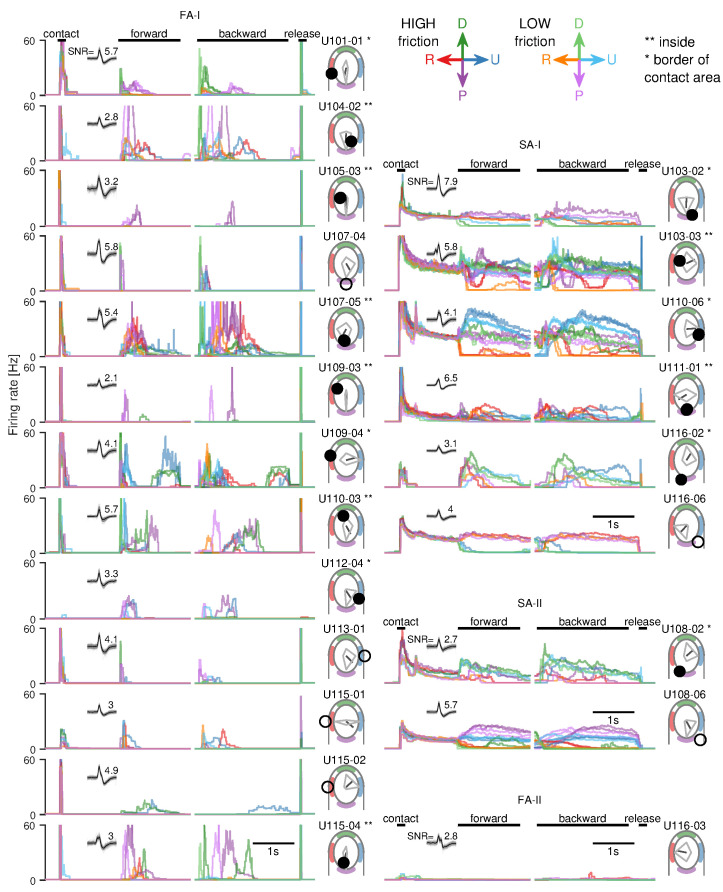
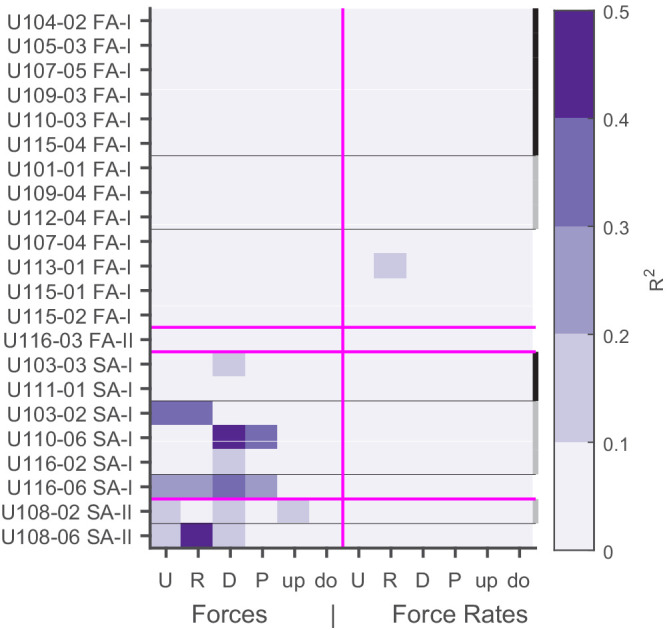
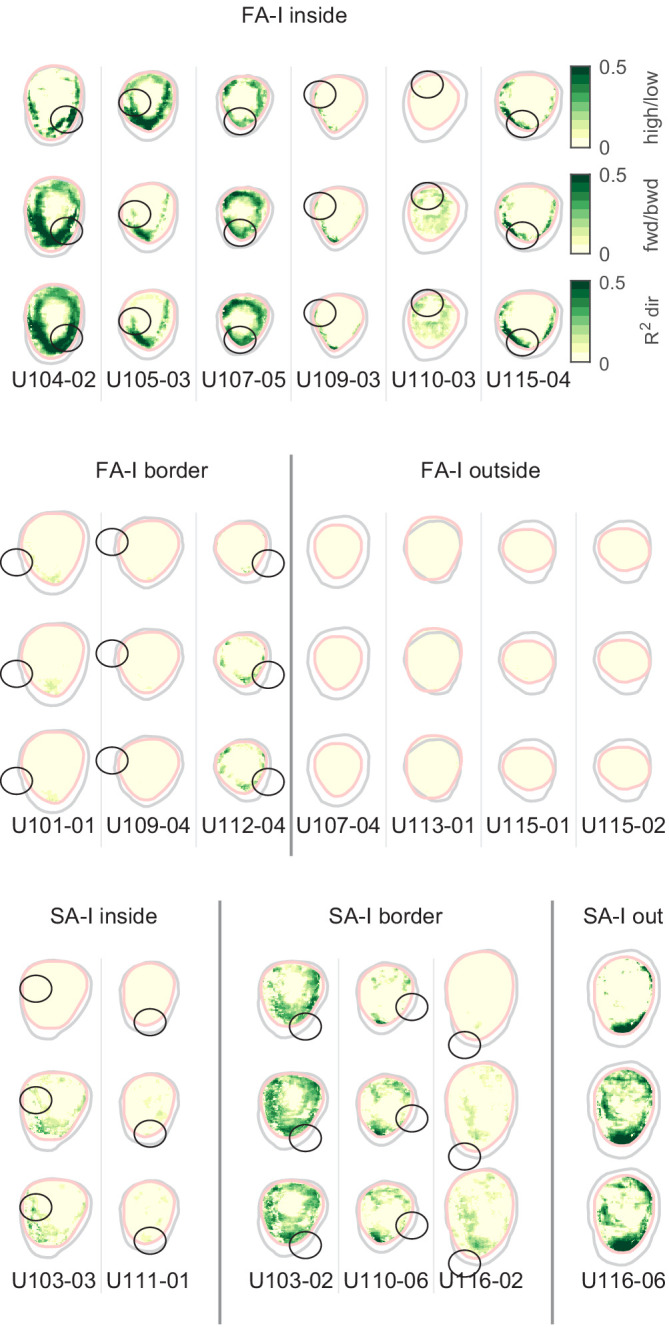
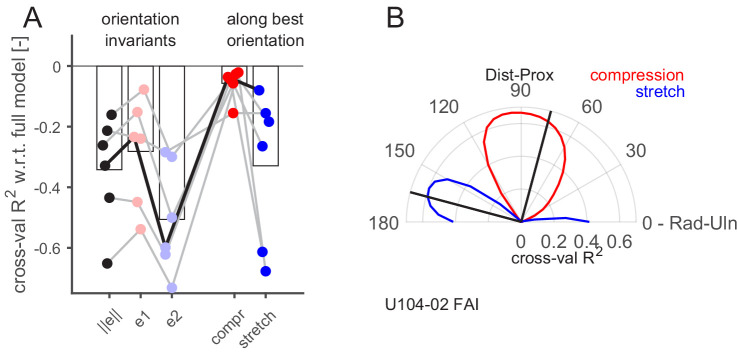
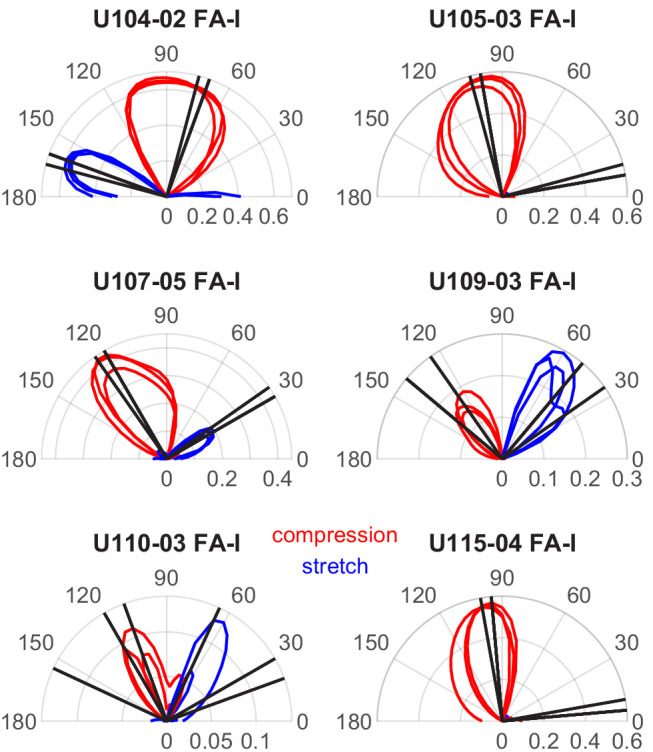
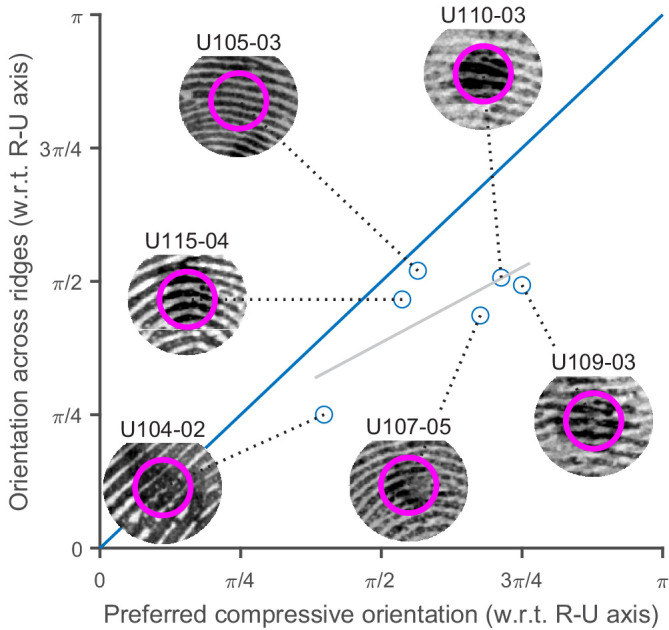
Human tactile afferents provide essential feedback for grasp stability during dexterous object manipulation. Interacting forces between an object and the fingers induce slip events that are thought to provide information about grasp stability. To gain insight into this phenomenon, we made a transparent surface slip against a fixed fingerpad while monitoring skin deformation at the contact. Using microneurography, we simultaneously recorded the activity of single tactile afferents innervating the fingertips. This unique combination allowed us to describe how afferents respond to slip events and to relate their responses to surface deformations taking place inside their receptive fields. We found that all afferents were sensitive to slip events, but fast-adapting type I (FA-I) afferents in particular faithfully encoded compressive strain rates resulting from those slips. Given the high density of FA-I afferents in fingerpads, they are well suited to detect incipient slips and to provide essential information for the control of grip force during manipulation.

Keywords: afferent; human; microneurography; neuroscience; skin; tactile; touch.

Plain language summary

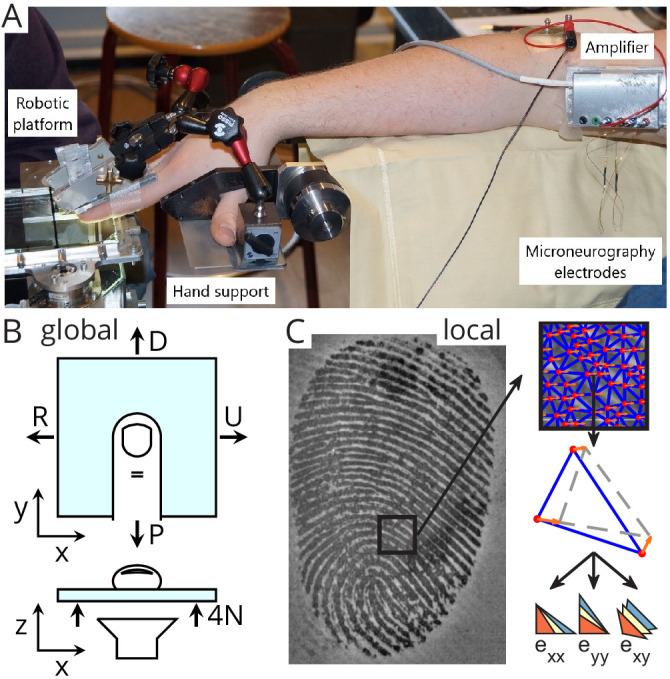
Each fingertip hosts thousands of nerve fibers that allow us to handle objects with great dexterity. These fibers relay the amount of friction between the skin and the item, and the brain uses this sensory feedback to adjust the grip as necessary. Yet, exactly how tactile nerve fibers encode information about friction remains largely unknown. Previous research has suggested that friction might not be recorded per se in nerve signals to the brain. Instead, fibers in the finger pad might be responding to localized ‘partial slips’ that indicate an impending loss of grip. Indeed, when lifting an object, fingertips are loaded with a tangential force that puts strain on the skin, resulting in subtle local deformations. Nerve fibers might be able to detect these skin changes, prompting the brain to adjust an insecure grip before entirely losing grasp of an object. However, technical challenges have made studying the way tactile nerve fibers respond to slippage and skin strain difficult. For the first time, Delhaye et al. have now investigated how these fibers respond to and encode information about the strain placed on fingertips as they are loaded tangentially. A custom-made imaging apparatus was paired with standard electrodes to record the activity of four different kinds of tactile nerve fibers in participants who had a fingertip placed against a plate of glass. The imaging focused on revealing changes in skin surface as tangential force was applied; the electrodes measured impulses from individual nerve fibers from the fingertip. While all the fibers responded during partial slips, fast-adapting type 1 nerves generated strong responses that signal a local loss of grip. Recordings showed that these fibers consistently encoded changes in the skin strain patterns, and were more sensitive to skin compressions related to slippage than to stretch. These results show how tactile nerve fibers encode the subtle skin compressions created when fingers handle objects. The methods developed by Delhaye et al. could further be used to explore the response properties of tactile nerve fibers, sensory feedback and grip.


Conflict of interest statement

BD, EJ, AB, JT, BE, PL No competing interests declared

Figures

Figure 1.
Figure 1.. Experimental setup.
(A) A robotic platform (left) was used to move a transparent plate of glass in contact with the fingerpad while the responses of single tactile afferents were recorded from the median nerve using microneurography (right). (B) The plate exerted a servo-controlled normal force of 4 N and was moved tangentially in one of four directions (U: ulnar; D: distal; R: radial; P: proximal). At the same time, a camera was used to image the contact area. All fingerprint images and strain heatmaps are shown using the same view, with the ulnar on the right. (C) From the fingerpad images, features (red dots) were sampled and tracked from frame to frame (the orange arrows show the features motion to the next frame). Features were then triangulated and the triangle strains were computed, leading to two axial strain components (exx and eyy) and a shear strain component (exy). Lower-right pictograms show how an initial triangle (in yellow) is deformed when experiencing positive (tensile, in blue) or negative (compressive, in red) strain.
Figure 2.
Figure 2.. Experimental procedures and typical traces.
(A) Evolution of the global variables, the plate position (vertical in gray and horizontal in black) and the contact force (normal in gray and tangential in black), together with the afferent instantaneous firing rate (and the spikes) as a function of time for a typical fast-adapting type I (FA-I) unit in the high friction condition. The plate was pressed against the fingerpad (‘contact’), moved tangentially forward until the occurrence of a full slip, then moved backward, and finally retracted (‘release’). The partial slip phase is highlighted by the gray vertical boxes. Five repetitions are overlaid. The tangential movement was split into three phases: onset (lasting 100 ms), partial slip, and plateau. (B) Heatmaps of the evolution of the local surface strain rates in the contact area as a function of time during the tangential loading, for one of the five repetitions. The three strain components, axial along x and y, and shearing, are shown (colored triangles depict the deformation axes). Compression (negative strain) is in red. The location of the unit receptive field center is shown with a blue circle on the raw fingerpad image on the bottom left. (C, D) Same as in (A, B) for a typical slowly-adapting type I (SA-I) unit. For both units, insets show recorded, superimposed action potentials and their average shape represented by a dark line.
Figure 2—figure supplement 1.
Figure 2—figure supplement 1.. Instantaneous firing rate as a function of time for all units recorded and all conditions.
The entire trial sequence is shown, from the initial contact (‘contact’) to the end of the contact (‘release’). Each line is the average of all repetitions of a given condition (between 3 and 5 repetitions). The colors are related to the direction (see the legend in the upper-right corner) and friction condition (darker colors refer to high friction and brighter colors refer to low friction). On the right inset, the approximate location of the receptive field on a reference finger is shown as a filled or empty circle if the unit was inside or outside the contact area, respectively. The normalized average firing rate for each direction (in gray) and the vector of the preferred direction (in black) are also shown. For all units, insets show recorded, superimposed action potentials and their average shape represented by a dark line. The receptive field of the only fast-adapting type II (FA-II) unit (U116-03) was in the second phalange.
Figure 2—figure supplement 2.
Figure 2—figure supplement 2.. Correlation of firing rates with contact forces.
Heatmap showing the correlation between each component of the 3D force and force rate vectors (in the tangential plane: U: ulnar; R: radial; P: proximal; D: distal; and in the normal plane: up and down) and the afferent firing rates. The force time series were lagged by 12 ms to account for the conduction delay. The units are sorted by type and location on the finger. The black border on the right depicts units inside the contact area, the gray border shows units on the border of the contact area, and no border means outside the contact area.
Figure 3.
Figure 3.. Properties of afferents’ responses during tangential loading.
(A) The afferents were mostly active during the partial slip phase. The fraction of trials during which the afferents were active for each phase of the tangential loading (onset, partial, and plateau) for the forward and backward movements. Bars show the average across units, and the lines show individual afferents (n = 13, 6, 2, and 1 for fast-adapting type I [FA-I], slowly-adapting type I [SA-I], slowly-adapting type II [SA-II], and fast-adapting type II [FA-II], respectively). (B) Afferents discharge more in a given direction. Mean firing rates elicited by partial slip as a function of angle with respect to the preferred direction (‘North’) for each unit. Each line shows a different afferent, and the mean firing rate was averaged across repetitions, movements (‘fwd’ or ‘bwd’), and frictions. (C) Distribution of the afferent preferred global direction for each afferent type. (D) Mean firing rate for backward versus forward movements. One data point is shown for each afferent (n = 22) and each condition (8 = 4 direction × 2 friction) and averaged across repetition. The dashed gray line is the slope = 1. (E) Mean firing rate for low versus high friction. One data point is shown for each afferent (n = 22) and each condition (8 = 4 directions × 2 forward-backward) and averaged across repetition. The black line is the least square regression, and the dashed gray line is the slope = 1.
Figure 4.
Figure 4.. Fast-adapting type I (FA-I) responses during partial slip are related to local strain rates.
(A) Evolution of tangential force, afferent instantaneous firing rate (together with the spikes), and strain rates as a function of time during tangential loading in the proximal direction (forward) followed by a distal movement (backward). Data are shown for two different frictions, high in black and low in gray, and are aligned on the onset of movement. Five repetitions are shown, except for the strains for which one trial is shown. The compressive strain (negative) is in red. The color of the contact area contour indicates the friction condition, and the gray circle shows the location of the afferent receptive field. The horizontal lines between the heatmaps depict the partial slip phase as shown in Figure 2. (B) Same as in (A) but for distal movement (forward) followed by a proximal movement (backward). Inset shows recorded, superimposed action potentials and their average shape represented by a dark line.
Figure 5.
Figure 5.. Afferent responses to surface skin strains.
(A) Heatmaps of the spike-triggered average (STA, in orange) for the fast-adapting type I (FA-I) units inside the contact area (top row), the other FA-I units (middle row), and the slowly-adapting type I (SA-I) units (bottom row). The STA matrices were obtained from the norm of the strain (e) and normalized to the maximal value (reported in B). The gray contour shows the initial contact area, and the pink contour depicts the parts of the contact area that remained in contact for at least 50% of the partial slip phase. The black circle is the unit receptive field. (B) STA peak value (red) and linear regression model performance (green). For units in or on the border of the contact area, the maximum was taken inside the receptive field. For units outside the contact area, the maximum was taken anywhere inside the contact area. The STA of some units were undefined over the whole contact area (see Materials and methods); those units are not shown. The unit shown in (C) is highlighted with a black circle. (C) Time evolution of the strain rates inside the receptive field, the actual firing rate (represented as spike events convolved with a Gaussian kernel, see Materials and methods), and the predicted firing rate of an example unit during partial slip for each direction and each friction (black is high friction, gray is low friction).
Figure 5—figure supplement 1.
Figure 5—figure supplement 1.. The same heatmaps as in Figure 5A but showing the spike-triggered average (STA) for the two principal strain rates (e1, compressive, and e2, tensile).
Figure 5—figure supplement 2.
Figure 5—figure supplement 2.. The same heatmaps as in Figure 5A but showing R2 for friction, direction, and forward/backward cross-validation methods.
Figure 6.
Figure 6.. Aspect of the skin strain encoded by the fast-adapting type I (FA-I) afferents inside the contact area.
(A) Firing rate prediction performance (cross-validated R2) for different models with respect to the full model comprising six predictors (0 on the y-axis corresponds to the full model performance, lower is worse). The three first models (e, e1, and e2) are single predictors and rotation invariant. The two last models (compression and stretch) have one component, and the performance obtained with the best orientation is shown. The unit shown in (B) is highlighted with a black line. (B) Polar plot showing the performance of the prediction (cross-validated R2) of linear models based on single strain components (red for compression and blue for stretch) as a function of the rotation angle of the reference frame (from 0 to 90°) with respect to the radial-ulnar axis (0°). Data from an example afferent U104-02. The black lines show the frame rotation that yields the best performance (maximizing the sum of the R2 of the compressive and tensile models).
Figure 6—figure supplement 1.
Figure 6—figure supplement 1.. The same polar plots as Figure 6B but for all units and all cross-validation methods.
Figure 6—figure supplement 2.
Figure 6—figure supplement 2.. Relation between preferred strain rate orientation and fingerprint ridges orientation.
Orientation across fingerprint ridges as a function of preferred compressive strain rate orientation (as in Figure 6—figure supplement 1 in red, mean across the three cross-validation procedures). Insets show local fingerprint patterns centered on the unit receptive field hot spot, and the magenta circles show the approximate window used for fingerprint orientation estimation. The blue line is the unity line. The gray line shows the best linear fit.

References

    1. André T, Lévesque V, Hayward V, Lefèvre P, Thonnard JL. Effect of skin hydration on the dynamics of fingertip gripping contact. Journal of the Royal Society Interface. 2011;8:1574–1583. doi: 10.1098/rsif.2011.0086. - DOI - PMC - PubMed
    1. Augurelle AS, Smith AM, Lejeune T, Thonnard JL. Importance of cutaneous feedback in maintaining a secure grip during manipulation of hand-held objects. Journal of Neurophysiology. 2003;89:665–671. doi: 10.1152/jn.00249.2002. - DOI - PubMed
    1. Barrea A, Delhaye BP, Lefevre P, Thonnard J-L. Finger pad mechanics during dexterous object manipulation. WorldHaptics Conference.2017.
    1. Barrea A, Delhaye BP, Lefèvre P, Thonnard JL. Perception of partial slips under tangential loading of the fingertip. Scientific Reports. 2018;8:7032. doi: 10.1038/s41598-018-25226-w. - DOI - PMC - PubMed
    1. Bazen A, Gerez S. Directional field computation for fingerprints based on the principal component analysis of local gradients. ProRISC 2000 Workshop on Circuits, Systems and Signal Processing.2000.

Publication types

LinkOut - more resources