. 2021 Apr 22;6(8):e131458.
doi: 10.1172/jci.insight.131458.

PD-L1 tumor-intrinsic signaling and its therapeutic implication in triple-negative breast cancer

Affiliations

PD-L1 tumor-intrinsic signaling and its therapeutic implication in triple-negative breast cancer

Chunhua Chen et al. JCI Insight. .

Abstract

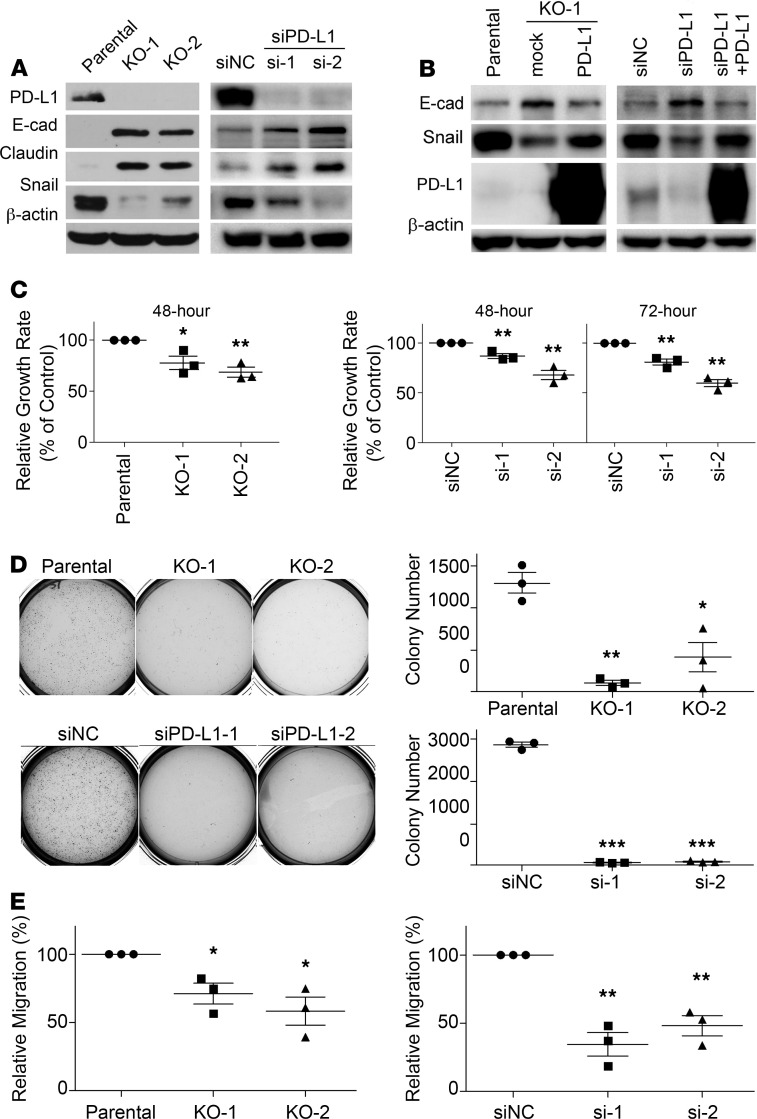
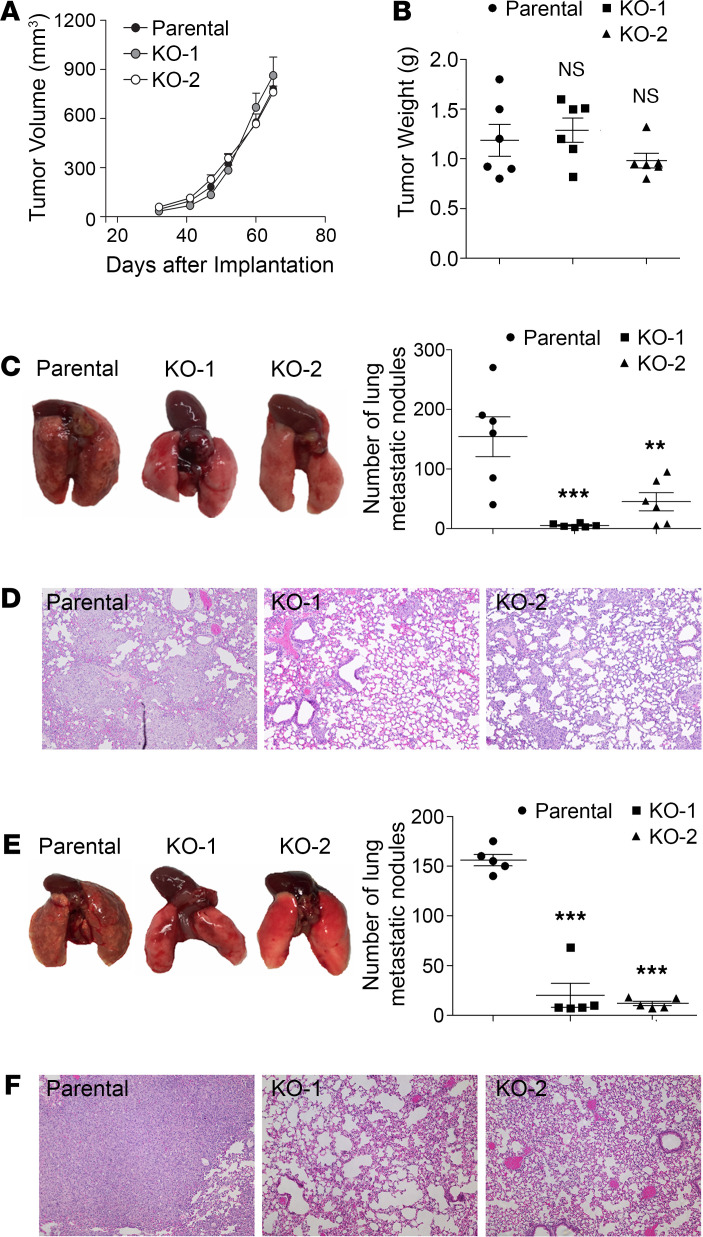
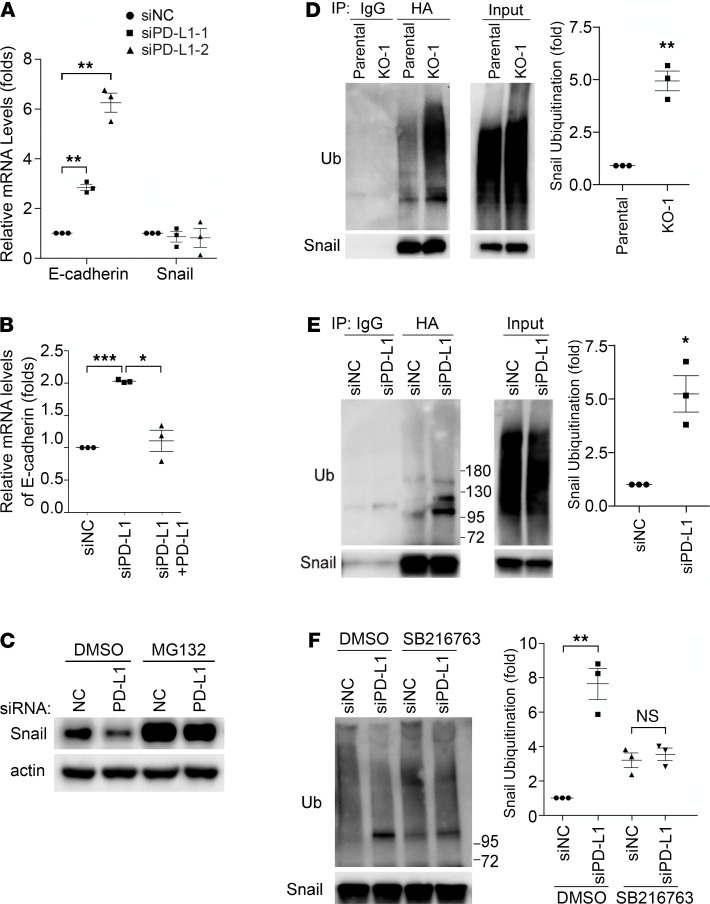
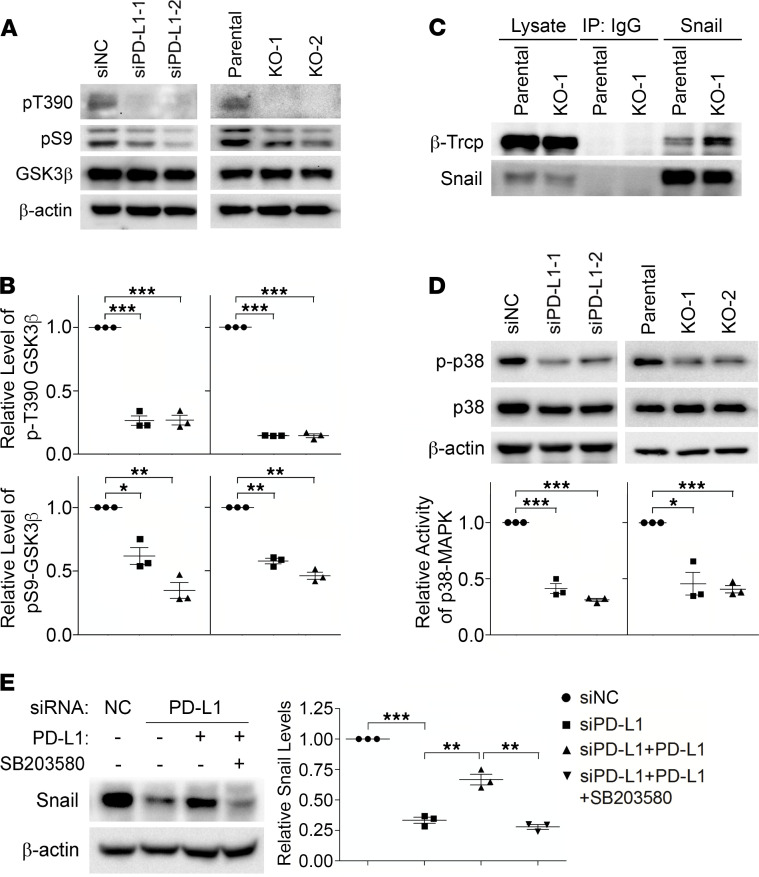
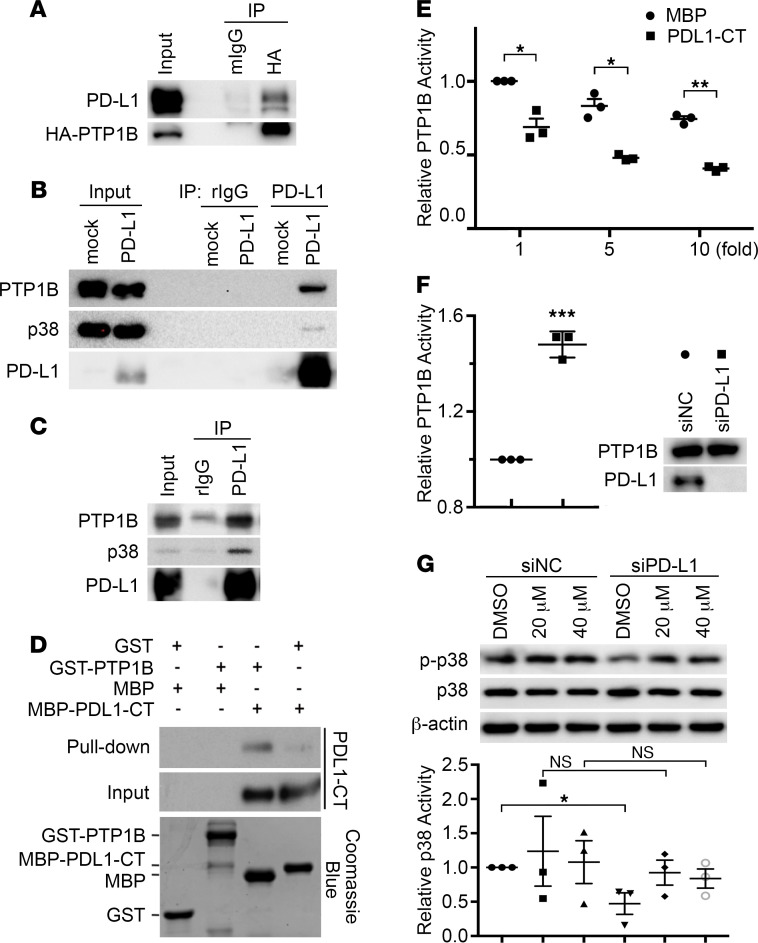
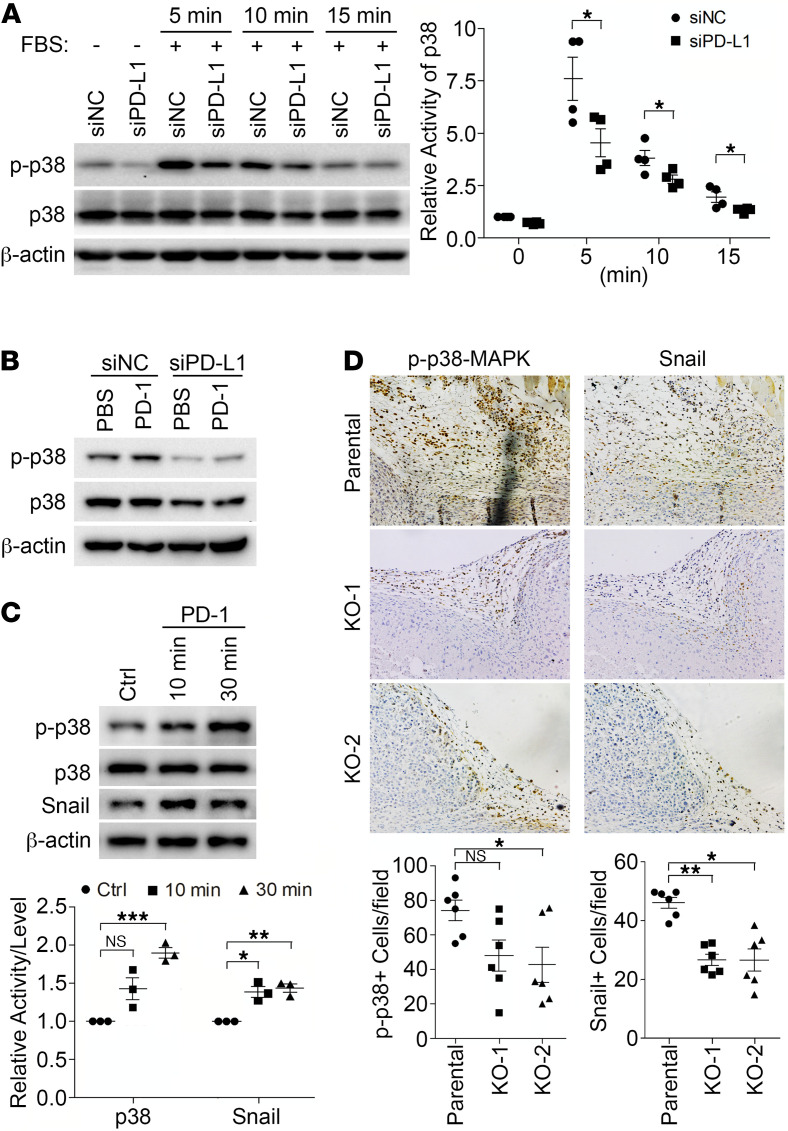
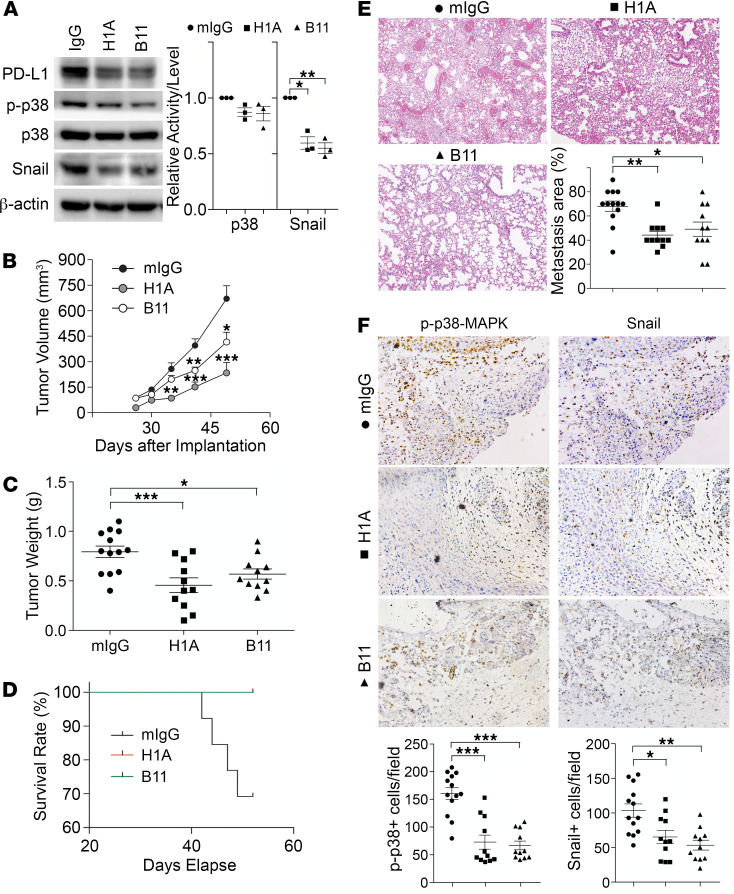
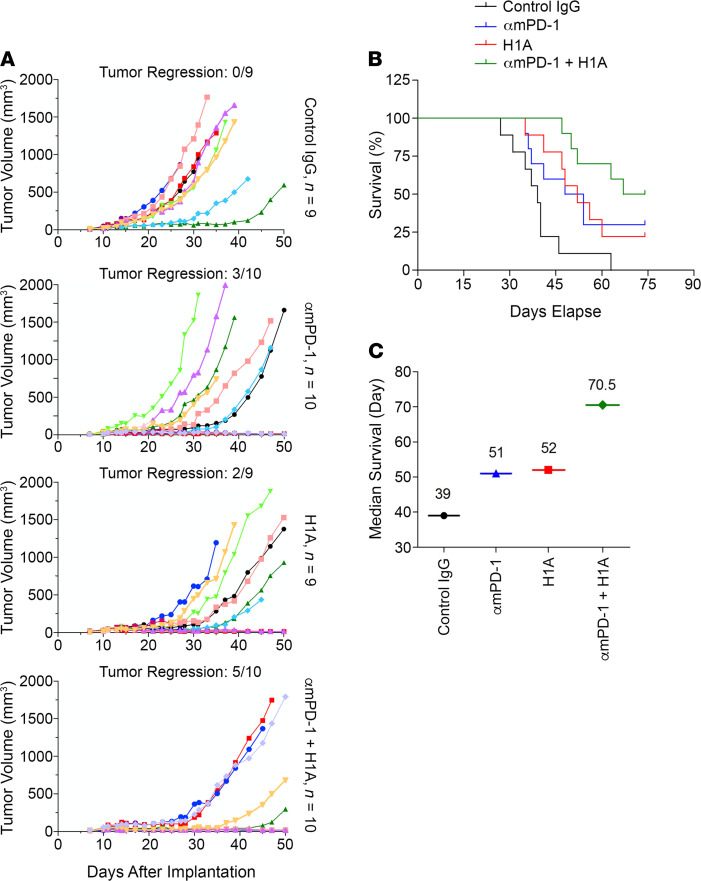
Although the immune checkpoint role of programmed death ligand 1 (PD-L1) has been established and targeted in cancer immunotherapy, the tumor-intrinsic role of PD-L1 is less appreciated in tumor biology and therapeutics development, partly because of the incomplete mechanistic understanding. Here we demonstrate a potentially novel mechanism by which PD-L1 promotes the epithelial-mesenchymal transition (EMT) in triple-negative breast cancer (TNBC) cells by suppressing the destruction of the EMT transcription factor Snail. PD-L1 directly binds to and inhibits the tyrosine phosphatase PTP1B, thus preserving p38-MAPK activity that phosphorylates and inhibits glycogen synthase kinase 3β (GSK3β). Via this mechanism, PD-L1 prevents the GSK3β-mediated phosphorylation, ubiquitination, and degradation of Snail and consequently promotes the EMT and metastatic potential of TNBC. Significantly, PD-L1 antibodies that confine the tumor-intrinsic PD-L1/Snail pathway restricted TNBC progression in immunodeficient mice. More importantly, targeting both tumor-intrinsic and tumor-extrinsic functions of PD-L1 showed strong synergistic tumor suppression effect in an immunocompetent TNBC mouse model. Our findings support that PD-L1 intrinsically facilitates TNBC progression by promoting the EMT, and this potentially novel PD-L1 signaling pathway could be targeted for better clinical management of PD-L1-overexpressing TNBCs.

Keywords: Breast cancer; Immunotherapy; Oncology; Therapeutics; Ubiquitin-proteosome system.


Conflict of interest statement

Conflict of interest: The authors have declared that no conflict of interest exists.

Figures

Figure 1
Figure 1. Expression of PD-L1 promotes the EMT and aggressive behaviors in MDA-MB-231 cells.
(A) Loss of PD-L1 induced epithelial characteristics in TNBC cells. Left panels, cell lysates from the parental or 2 clones of PD-L1–null (KO-1 and KO-2) MDA-MB-231 cells. Right panels, MDA-MB-231 cells transiently transfected with nonspecific control siRNA (siNC) or 2 distinct PD-L1 specific (siPD-L1) siRNAs (si-1 and si-2) for 48 hours. (B) Reexpression of PD-L1 in PD-L1–deficient MDA-MB-231 cells restored the expression of E-cadherin and Snail to levels comparable to the parental cells. Cells were transfected with PD-L1 for 24 hours followed by siPD-L1 (si-1) for another 48 hours. (C) PD-L1 deficiency decreased cell proliferation. Cell proliferation of the parental or PD-L1–deficient cells was determined at 48 hours or 72 hours. (D) Loss of PD-L1 inhibited the anchorage-independent growth. Tumorigenesis potential of control or PD-L1–deficient MDA-MB-231 cells was determined using soft agar colony formation assay. Colony numbers were counted using GelCount. (E) Cells lacking PD-L1 were less migratory. The in vitro cell migration assay was performed using Boyden chamber with 20,000 cells/chamber. Directional cell migration was induced by a 4-hour treatment of 10% FBS in cells serum-starved overnight. (CE) Results (n = 3 independent experiments) were statistically analyzed and plotted as mean ± SEM using unpaired 2-tailed Student’s t test with the P value adjusted by Bonferroni’s method. *, P < 0.05; **, P < 0.01; ***, P < 0.001.
Figure 2
Figure 2. PD-L1 deficiency reduces the tumor metastasis independent of the antitumor immunity.
(AD) Two million parental or PD-L1–null (KO-1 and KO-2) cells were injected into the mammary fat pad of NOD/SCID mouse (6 mice/group). (A) Tumor volume was measured with calipers weekly and calculated using the standard formula. (B) Tumors were dissected and weighed at the endpoint (65 days after inoculation). (C and D) Loss of PD-L1 inhibits lung metastasis. (C) Lungs were dissected at the endpoint. Left panel, images of gross lung showed that parental MDA-MB-231 tumors generated many more metastatic nodules on lung surface. (D) Representative H&E staining images of lung tissues showing micrometastatic lesions from mice bearing parental tumors are much more severe than those bearing PD-L1–null tumors. (E and F) Results from experimental metastasis model suggest that PD-L1 is necessary for the later steps of metastasis formation. Parental or PD-L1–null MDA-MB-231 cells (8 × 10⁵) were directly injected into the tail vein of NOD/SCID mice (5 mice/group). Animals were terminated 40 days later to examine lung metastasis. (E) Metastatic nodules on lung surface in each group were analyzed. (F) Representative H&E staining images of lung tissues. PD-L1–null MDA-MB-231 tumors generated many fewer lung micrometastatic lesions than parental tumors. (D and F) Power of eyepiece: 10×; power of objective: 10×. (AC and E) Data were plotted as mean ± SEM and statistically analyzed using 1-way ANOVA analysis with Dunnett’s test. n = 6 (AC) and n = 5 (E). N.S., no significant difference; **, P < 0.01; ***, P < 0.001.
Figure 3
Figure 3. PD-L1 promotes the EMT by protecting Snail from being ubiquitinated and destructed.
(A) Depletion of PD-L1 increased E-cadherin transcription but had no effect on Snail transcription. MDA-MB-231 cells were treated with control or each of 2 distinct PD-L1 siRNAs for 48 hours. mRNA levels of E-cadherin and Snail in these cells were examined by real-time quantitative PCR. (B) Reexpression of PD-L1 suppressed E-cadherin transcription. MDA-MB-231 cells were transfected with mock or PD-L1–expressing construct for 24 hours, then transfected with control (siNC) or PD-L1 siRNA (siPD-L1–2) for another 48 hours. The mRNA levels of E-cadherin in each group were examined by RT-qPCR. (A and B) Data (n = 3 independent experiments) were normalized against the siNC group, plotted as mean ± SEM, and statistically analyzed using unpaired 2-tailed Student’s t test with the P value adjusted by Bonferroni’s method. *, P < 0.05; **, P < 0.01; ***, P < 0.001. (C) Inhibition of proteasome recovered the loss of Snail in PD-L1–depleted cells. Control (siNC) or PD-L1–depleted (siPD-L1–2) MDA-MB-231 cells were treated with 10 μM MG132 for 6 hours. Cells were then lysed and subjected to immunoblotting with indicated antibodies. (DF) Snail ubiquitination was enhanced in PD-L1–depleted cells in a GSK3β-dependent manner. (D) Parental and PD-L1–null (KO-1) MDA-MB-231 cells were transfected with HA-tagged Snail and Myc-tagged ubiquitin for 48 hours. (E) MDA-MB-231 cells were transfected with HA-Snail and Myc-ubiquitin for 24 hours, then transfected with control (siNC) or PD-L1 (siPD-L1–2) siRNA for 48 hours. (F) Cells described in E were treated with DMSO or 10 μM SB216763 for 6 hours. (DF) After being treated with MG132 (10 μM, 6 hours), cells were lysed with denatured IP buffer, then subjected to immunoprecipitation (IP) with indicated antibodies (HA antibody for F). The precipitates were analyzed by immunoblotting using indicated antibodies. Intensity of ubiquitinated Snail was quantified by ImageJ (NIH) and normalized against control. (DF) Data (n = 3 independent experiments) were normalized against the parental (D), siNC (E), or siNC/DMSO (F) group; plotted as mean ± SEM; and statistically analyzed using unpaired 2-tailed Student’s t test. *, P < 0.05; **, P < 0.01. N.S., no significant difference.
Figure 4
Figure 4. PD-L1 prevents Snail ubiquitination via p38-MAPK–mediated inhibition of GSK3β.
(A and B) The inhibitory phosphorylations of GSK3β (pT390 and pS9) were decreased in PD-L1–deficient cells. (A) Control, PD-L1–knockdown, and PD-L1–knockout MDA-MB-231 cells were analyzed by immunoblotting using indicated antibodies. (B) The intensity of pT390-GSK3β and pS9-GSK3β were measured and normalized against total GSK3β in each group. Results was then normalized against the control group. (C) Snail exhibited stronger association with β-Trcp in PD-L1–deficient MDA-MB-231 cells. Endogenous Snail was immunoprecipitated from parental or KO-1 MDA-MB-231 cells. β-Trcp associated with Snail was determined by immunoblotting. (D) PD-L1–deficient cells exhibited significantly less p38-MAPK activity. The activating phosphorylation of p38-MAPK (p-p38) was determined by immunoblotting. The relative activity of p38-MAPK was represented by the ratio of p-p38 to total p38. (E) Selective inhibition of p38-MAPK suppressed the PD-L1–induced expression of Snail. MDA-MB-231 cells stably expressing PD-L1 were established by lentivirus-mediated infection. These cells were pretreated with SB203580 (10 μM) for 2 hours before transfection with siNC or siPD-L1 for 48 hours with SB203580, then subjected to immunoblotting analysis using indicated antibodies. After normalizing against β-actin levels, the expression level of Snail in each group was quantified. (B and D) Results (n = 3 3 independent experiments) were plotted as mean ± SEM and statistically analyzed using unpaired 2-tailed Student’s t test with the P value adjusted by Bonferroni’s method. *, P < 0.05; **, P < 0.01; ***, P < 0.001. (E) Results (n = 3 independent experiments) were plotted as mean ± SEM and statistically analyzed using 1-way ANOVA with the P value adjusted by Tukey’s honestly significant differences (HSD) using R function “aov” and “TukeyHSD” from package “stats” in R version 3.6.3. **, P < 0.01; ***, P < 0.001.
Figure 5
Figure 5. PD-L1 directly interacts with PTP1B and inhibits its phosphatase activity.
(A) PD-L1 and HA-tagged PTP1B associate with each other. HEK293T cells were transfected with PD-L1 and HA-tagged PTP1B for 48 hours and then subjected to immunoprecipitation followed by immunoblotting. (B) Ectopically expressed PD-L1 could pull down endogenous PTP1B and p38-MAPK. PD-L1 overexpressed in HEK293T was immunoprecipitated by PD-L1 antibody and the associated PTP1B were visualized by immunoblotting. (C) Endogenous PD-L1, PTP1B, and p38-MAPK form a protein complex in MDA-MB-231 cells. (D) The cytoplasmic domain of PD-L1 directly interacts with PTP1B. GST-tagged PTP1B (GST-PTP1B) and MBP-tagged PD-L1 cytoplasmic domain (MBP-PDL1-CT) were purified from E. coli. Purified proteins were analyzed by SDS-PAGE followed by Coomassie blue staining (lower panel). GST pull-down assays were performed using 0.5 g of each indicated protein. (E and F) PD-L1 inhibited the phosphatase activity of PTP1B. In vitro phosphatase assay was performed using 120 ng purified GST-PTP1B with indicated amount of MBP or MBP-PDL1-CT (E) or using endogenous PTP1B immunoprecipitated by anti-PTP1B antibody from indicated cell lysates (F). PTP1B activity in each sample was normalized against PTP1B with equal amount of MBP (E) or cells treated with control siRNA (siNC, F, immunoprecipitants pulled down from control cells by normal mouse IgG were used as negative controls of the phosphatase activity assay). (G) Inhibition of PTP1B recovered p38-MAPK activity in PD-L1–deficient cells. MDA-MB-231 cells were transfected with control (siNC) or PD-L1 (siPD-L1–1) siRNAs along with PTP1B inhibitor (20 or 40 μM) for 48 hours, then lysed for immunoblotting using indicated antibodies. The relative intensity of phosphorylated p38-MAPK (p-p38) in each sample was determined by GraphPad and normalized against the total p38-MAPK. (EG) Results (n = 3 independent experiments) were plotted as mean ± SEM and comparisons between indicated groups were statistically analyzed using unpaired 2-tailed Student’s t test. *, P < 0.05; **, P < 0.01; ***, P < 0.001.
Figure 6
Figure 6. PD-L1 mediates a tumor-intrinsic signaling that can be activated by PD-1.
(AC) Cells were subjected to immunoblotting with indicated antibodies. (A) PD-L1 is necessary for the activation of p38-MAPK by extracellular stimuli. MDA-MB-231 cells were transfected with control or PD-L1 siRNAs for 48 hours, serum-starved overnight, and then treated with FBS (10%) for indicated amount of time. (B) PD-1 activates p38-MAPK in a PD-L1–dependent manner. Control or PD-L1–depleted MDA-MB-231 cells were treated with PBS or PD-1 (0.5 μg/mL) for 15 minutes. (C) PD-1 treatment increased the protein levels of Snail in MDA-MB-231 cells. Cells were treated with PBS or PD-1 for 10 or 30 minutes. (A and C) The relative activity of p38 and protein level of Snail were quantified. Data (n = 3 independent experiments) were plotted as mean ± SEM and statistically analyzed using unpaired 2-tailed Student’s t test with (C) or without (A) the P value adjusted by Bonferroni’s method. N.S., no significant difference; *, P < 0.05; **, P < 0.01; ***, P < 0.001. (D) PD-L1 is required for p38 activation and Snail expression in vivo. MDA-MB-231 tumors grown in NOD/SCID mice as described in Figure 2 were collected and processed for immunohistochemistry staining to determine p38 activity and Snail expression in tandem tissue slides. Power of eyepiece: 10×; power of objective: 20×. Positive cells were counted in >10 fields/slide/mice, averaged, and plotted as mean ± SEM. Data (n = 6 mice/group) were statistically analyzed using unpaired 2-tailed Student’s t test with the P value adjusted by Bonferroni’s method. N.S., no significant difference; *, P < 0.05; **, P < 0.01.
Figure 7
Figure 7. PD-L1 antibodies diminish PD-L1 tumor-intrinsic signaling and inhibit TNBC progression independent of antitumor immunity.
(A) PD-L1 antibodies suppressed PD-L1 expression and signaling. MDA-MB-231 cells were treated with control IgG, H1A, or B11 for 48 hours before being subjected to immunoblotting. Relative p38 activity was calculated as the ratio of phosphorylated p38 and total p38, then normalized against the control group (IgG). Data were plotted as mean ± SEM and statistically analyzed using unpaired 2-tailed Student’s t test with the P value adjusted by Bonferroni’s method (n = 3 independent experiments). *, P < 0.05; **, P < 0.01. (BF) NOD/SCID mice receiving 2 × 10⁶ MDA-MB-231 cells in mammary fat pad were separated into 3 treatment groups (IgG, H1A, or B11). Starting from day 4 after inoculation, 200 μg antibodies were administrated intraperitoneally every 3 days until termination. (B and C) Tumor was measured weekly (B) and weighed at the endpoint (C). (D) Survival (Kaplan-Meier) curve was summarized in each treatment group. (E) Micrometastatic lesions in lung tissues from each treatment group were visualized by H&E staining and quantified. Power of eyepiece: 10×; power of objective: 10×. (F) Treatment of PD-L1 antibodies inhibited PD-L1 signaling. The number of phosphorylated p38-positive or Snail-positive cells in tumor tissues was determined by immunohistochemistry staining in tandem tissue slides prepared from tumors treated with control or PD-L1 antibodies. Power of eyepiece: 10×; power of objective: 20×. (E and F) Values from more than 10 fields in slide from each mouse were quantified and averaged. (BF) Data for each group were plotted as mean ± SEM, and comparisons with the mouse IgG group were statistically analyzed using 1-way ANOVA analysis with Dunnett’s test (n = 11–13 mice/group). *, P < 0.05; **, P < 0.01; ***, P < 0.001.
Figure 8
Figure 8. Targeting the tumor-intrinsic function of PD-L1 synergistically suppresses TNBC progression when combined with immune checkpoint blockade reagents.
Humanized E0771 cells (1 × 10⁶), in which endogenous mouse PD-L1 was knocked out and human PD-L1 was overexpressed, were injected into the mammary fat pad of female C57BL/6 mice. On day 11 after inoculation, when the solid tumor could be touched, mice were randomly separated into 4 groups, which were treated with 200 μg control IgG, hamster anti–mouse PD-1 antibody (αmPD-1), mouse anti–human PD-L1 antibody H1A, or 100 μg αmPD-1 plus 100 μg H1A, respectively. Antibodies were injected intraperitoneally once every 3 days for 5 injections in total. (A) Combined treatment of αmPD-1 and H1A exhibited strong synergistic effect on suppressing tumor growth. Tumor volume was measured with calipers weekly until day 50 after inoculation and calculated as V = 0.5 × LW2. Tumor regression was shown as ratio of number of animals showing tumor regression and total animal number in each treatment group. (B) Combined treatment of αmPD-1 and H1A synergistically increased the survival of mice carrying E0771 tumor. Animals were monitored until day 74 after inoculation, when at least half of mice in each experimental group met the terminating body condition. (C) The median survival days of mice in each treatment group were calculated and plotted, which clearly showed that combined treatment of αmPD-1 and H1A elongated the survival time of animals carrying E0771 tumor.

References

    1. Chen J, et al. Regulation of PD-L1: a novel role of pro-survival signalling in cancer. Ann Oncol. 2016;27(3):409–416. doi: 10.1093/annonc/mdv615. - DOI - PubMed
    1. Ritprajak P, Azuma M. Intrinsic and extrinsic control of expression of the immunoregulatory molecule PD-L1 in epithelial cells and squamous cell carcinoma. Oral Oncol. 2015;51(3):221–228. doi: 10.1016/j.oraloncology.2014.11.014. - DOI - PubMed
    1. Gong J, et al. Development of PD-1 and PD-L1 inhibitors as a form of cancer immunotherapy: a comprehensive review of registration trials and future considerations. J Immunother Cancer. 2018;6(1):8. doi: 10.1186/s40425-018-0316-z. - DOI - PMC - PubMed
    1. Mittendorf EA, et al. PD-L1 expression in triple-negative breast cancer. Cancer Immunol Res. 2014;2(4):361–370. doi: 10.1158/2326-6066.CIR-13-0127. - DOI - PMC - PubMed
    1. Esteva FJ, et al. Immunotherapy and targeted therapy combinations in metastatic breast cancer. Lancet Oncol. 2019;20(3):e175–e186. doi: 10.1016/S1470-2045(19)30026-9. - DOI - PubMed

Publication types

MeSH terms

Substances