. 2021 Apr 22;17(4):e1009535.
doi: 10.1371/journal.pgen.1009535. eCollection 2021 Apr.

Intercellular viral spread and intracellular transposition of Drosophila gypsy

Affiliations

Intercellular viral spread and intracellular transposition of Drosophila gypsy

Richard M Keegan et al. PLoS Genet. .

Abstract

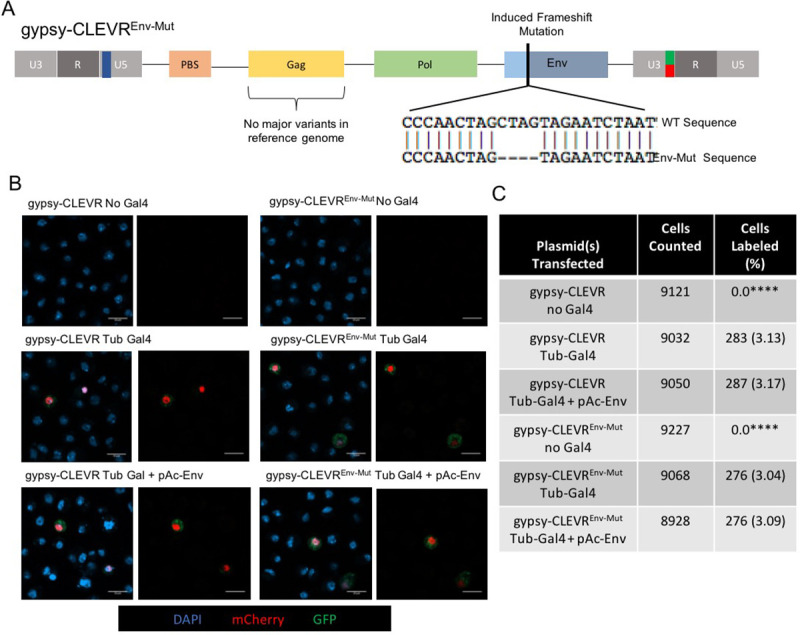
It has become increasingly clear that retrotransposons (RTEs) are more widely expressed in somatic tissues than previously appreciated. RTE expression has been implicated in a myriad of biological processes ranging from normal development and aging, to age related diseases such as cancer and neurodegeneration. Long Terminal Repeat (LTR)-RTEs are evolutionary ancestors to, and share many features with, exogenous retroviruses. In fact, many organisms contain endogenous retroviruses (ERVs) derived from exogenous retroviruses that integrated into the germ line. These ERVs are inherited in Mendelian fashion like RTEs, and some retain the ability to transmit between cells like viruses, while others develop the ability to act as RTEs. The process of evolutionary transition between LTR-RTE and retroviruses is thought to involve multiple steps by which the element loses or gains the ability to transmit copies between cells versus the ability to replicate intracellularly. But, typically, these two modes of transmission are incompatible because they require assembly in different sub-cellular compartments. Like murine IAP/IAP-E elements, the gypsy family of retroelements in arthropods appear to sit along this evolutionary transition. Indeed, there is some evidence that gypsy may exhibit retroviral properties. Given that gypsy elements have been found to actively mobilize in neurons and glial cells during normal aging and in models of neurodegeneration, this raises the question of whether gypsy replication in somatic cells occurs via intracellular retrotransposition, intercellular viral spread, or some combination of the two. These modes of replication in somatic tissues would have quite different biological implications. Here, we demonstrate that Drosophila gypsy is capable of both cell-associated and cell-free viral transmission between cultured S2 cells of somatic origin. Further, we demonstrate that the ability of gypsy to move between cells is dependent upon a functional copy of its viral envelope protein. This argues that the gypsy element has transitioned from an RTE into a functional endogenous retrovirus with the acquisition of its envelope gene. On the other hand, we also find that intracellular retrotransposition of the same genomic copy of gypsy can occur in the absence of the Env protein. Thus, gypsy exhibits both intracellular retrotransposition and intercellular viral transmission as modes of replicating its genome.


Conflict of interest statement

The authors have declared that no competing interests exist.

Figures

Fig 1
Fig 1. Functional test of reporters marking gypsy replication and expression in Drosophila S2 cells.
(A) Cartoon representations of the pAc-H2B-mCherry, pAc-Env, pAc-WM, UAS-WM, gypsy-CLEVR, gypsy-CLEVRΔPBS, gypsy-CLEVRPBSm2,(PBS deleted and replaced with a scrambled sequence of the same length (11)) gypsy-mCherry, and gypsy-ΔEnv-mCherry constructs used. The P2A site between Env and mCherry in the gypsy-mCherry construct is denoted in blue. UAS insertion site in gypsy-CLEVR denoted in blue. mCherryP2AmCD8GFP denoted with red/green swatch. Star denotes Gal4 dependence for fluorescence but not replication. (B) Fluorescent images showing WM or mCherry positive S2 cells for gypsy-CLEVR and gypsy-mCherry constructs detected 48 hours after transfection. Scale bars = 10 μm. (C) Quantification showing the percentage of cells labeled for the gypsy-CLEVR constructs with and without Gal4, and the gypsy-mCherry constructs. Quantification is presented as totals cells counted from 3 near equivalent sets of biological replicates. Significance for the gypsy-CLEVR constructs was calculated against gypsy-CLEVR with no Gal4; significance for gypsy-mCherry constructs was calculated against gypsy-mCherry. Significance was determined using the Fisher’s Exact test variant of the Chi2 test. Significance values are denoted as: p = <0.05 *, p = <0.001 ***, p = <0.0001**** Raw data for cell counts shown in S1 Table.
Fig 2
Fig 2. The gypsy-CLEVR reporter reveals that gypsy transfers between cells in contact and integrates into the infected recipient cell.
(A) Cartoon schematic showing the experimental design of the co-culture assay. Separate populations of S2 cells are transfected with gypsy-CLEVR or tubulin-Gal4 constructs for 48 hours, washed, and then mixed together in equal proportions for further incubation of 48 hours before imaging. (B) Fluorescent images showing WM labeled cells in the co-cultured gypsy-CLEVR and tubulin-Gal4 cell population. UAS-WM, gypsy-CLEVRΔPBS, and gypsy-CLEVRPBSm2 showed no WM labeled cells and are not shown. Scale bars = 10 μm. (C) Quantification showing the percentage of cells expressing the WM reporter for the UAS-WM (control) and gypsy-CLEVR constructs in co-culture with tubulin-Gal4. Quantification is presented as totals cells counted from 3 near equivalent sets of biological replicates. Significance was calculated against UAS-WM. Significance was determined using the Fisher’s Exact test variant of the Chi2 test. Significance values are denoted as: p = <0.05 *, p = <0.001 ***, p = <0.0001**** Raw data for cell counts shown in S1 Table.
Fig 3
Fig 3. The gypsy-CLEVR reporter reveals intercellular gypsy transmission through a contact restricting membrane.
(A) Cartoon schematic showing the experimental design of the transwell assay. Separate populations of S2 cells are transfected with gypsy-CLEVR or tubulin-Gal4 constructs for 48 hours, washed, and then re-seeded on separate sides of a 0.4 μm membrane and further incubated for 48 hours prior to imaging. (B) Fluorescent images showing WM labeled cells in the tubulin-Gal4 cell recipient population. UAS-WM, gypsy-CLEVRΔPBS, and gypsy-CLEVRPBSm2 showed no WM labeled cells in the recipient populations and are not shown. No WM labeled cells were detected in the donor populations and are not shown. Scale bars = 10 μm. (C) Quantification showing the percentage of cells expressing the WM reporter for the UAS-WM (control) and gypsy-CLEVR constructs for both the donor and recipient populations in the transwell assay. Quantification is presented as totals cells counted from 3 near equivalent sets of biological replicates. Significance was calculated against UAS-WM. Significance was determined using the Fisher’s Exact test variant of the Chi2 test. Significance values are denoted as: p = <0.05 *, p = <0.001 ***, p = <0.0001**** Raw data for cell counts shown in S1 Table.
Fig 4
Fig 4. The gypsy-mCherry reporter reveals that intercellular transmission of gypsy requires functional env.
A) Cartoon schematic showing the experimental design of the transwell assay. One population is transfected with the gypsy-mCherry constructs for 48 hours, washed, and placed opposite untransfected S2 cells separated by a 0.4 μm membrane for an additional 48 hours prior to imaging. (B) Fluorescent images showing mCherry labeled cells in the S2 cell recipient population. pAc-H2B-mCherry and gypsy-ΔEnv-mCherry recipient populations show no or few labeled cells respectively, and are not shown. Donor populations are not shown. Scale bars = 10 μm. (C) Quantification showing the percentage of cells expressing mCherry for the pAc-H2B-mCherry (control) and gypsy-mCherry constructs for both the donor and recipient populations in the transwell assay. Quantification is presented as totals cells counted from 3 near equivalent sets of biological replicates. Significance was calculated against gypsy-ΔEnv-mCherry. Significance was determined using the Fisher’s Exact test variant of the Chi2 test. Significance values are denoted as: p = <0.05 *, p = <0.001 ***, p = <0.0001**** Raw data for cell counts shown in S1 Table.
Fig 5
Fig 5. Functional env is not required for the intracellular retrotransposition of gypsy.
Cartoon schematic showing the overall structure of the gypsy-CLEVREnv_mut construct, which is identical to gypsy-CLEVR but has a frameshift mutation within the env ORF, seen in detail in the sequence comparison directly below. B) Fluorescent images showing the absence of WM signal in gypsy-CLEVR and gypsy-CLEVREnv_mut populations lacking Gal4, and positive WM signal in gypsy-CLEVR and gypsy-CLEVRΔEnv when co-transfected with tubulin Gal4 as well as with pAc-Env. C) Quantification of the percentage of cells that showed positive WM signal for gypsy-CLEVR and gypsy-CLEVRΔEnv with and without Gal4, as well as with pAc-Env. No statistically significant differences were found absent gypsy-CLEVR and gypsy-CLEVREnv_mut lacking the presence of Gal4. Quantification is presented as totals cells counted from 3 near equivalent sets of biological replicates. Significance was determined using the Fisher’s Exact test variant of the Chi2 test. Significance values are denoted as: p = <0.05 *, p = <0.001 ***, p = <0.0001**** Raw data for cell counts shown in S1 Table.

Similar articles

Cited by

References

    1. Huang CR, Burns KH, Boeke JD. Active transposition in genomes. Annu Rev Genet. 2012;46:651–75. 10.1146/annurev-genet-110711-155616 - DOI - PMC - PubMed
    1. Kazazian HH Jr. Mobile elements: drivers of genome evolution. Science. 2004;303(5664):1626–32. 10.1126/science.1089670 - DOI - PubMed
    1. Babushok DV, Kazazian HH Jr. Progress in understanding the biology of the human mutagen LINE-1. Hum Mutat. 2007;28(6):527–39. 10.1002/humu.20486 - DOI - PubMed
    1. Dubnau J. The Retrotransposon storm and the dangers of a Collyer’s genome. Curr Opin Genet Dev. 2018;49:95–105. 10.1016/j.gde.2018.04.004 - DOI - PMC - PubMed
    1. Faulkner GJ, Billon V. L1 retrotransposition in the soma: a field jumping ahead. Mob DNA. 2018;9:22. 10.1186/s13100-018-0128-1 - DOI - PMC - PubMed

Publication types

LinkOut - more resources