. 2021 May 4;33(5):905-922.e6.
doi: 10.1016/j.cmet.2021.03.025. Epub 2021 Apr 21.

The adverse metabolic effects of branched-chain amino acids are mediated by isoleucine and valine

Affiliations

The adverse metabolic effects of branched-chain amino acids are mediated by isoleucine and valine

Deyang Yu et al. Cell Metab. .

Abstract

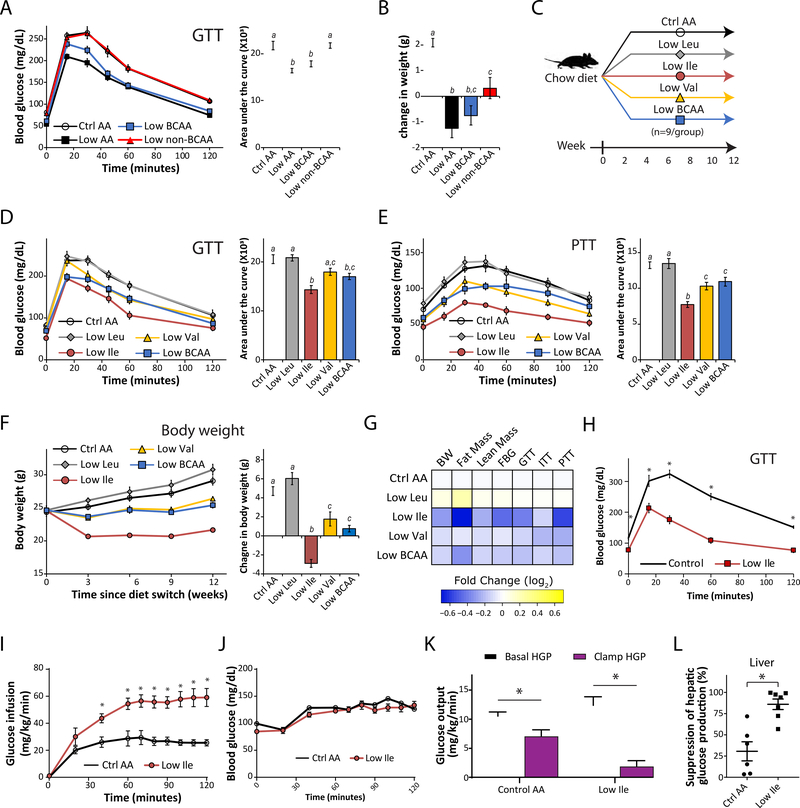
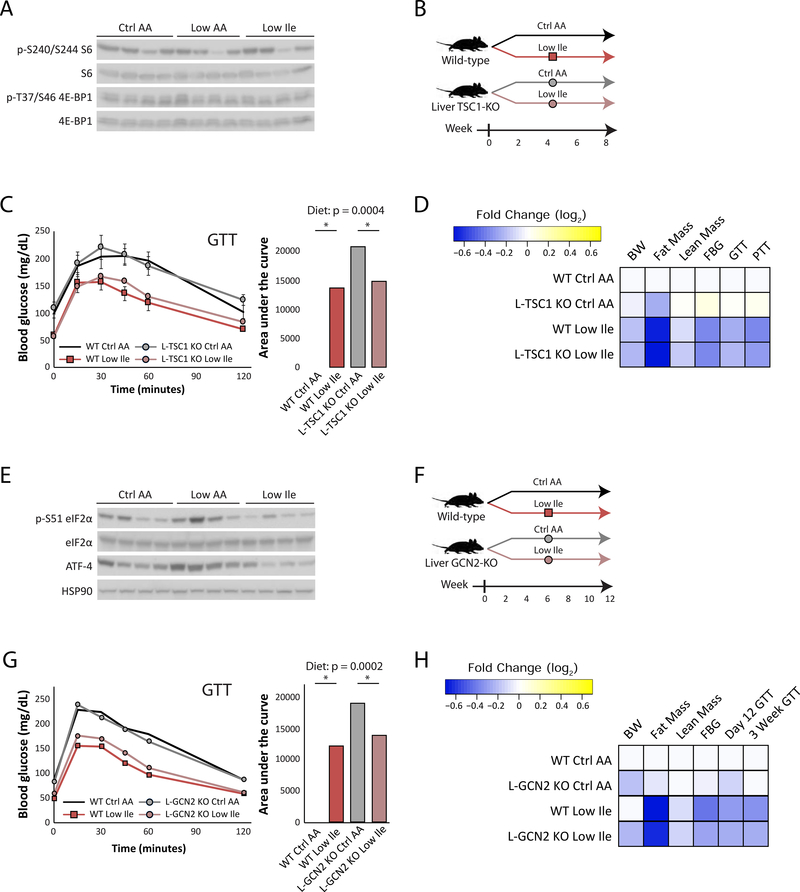
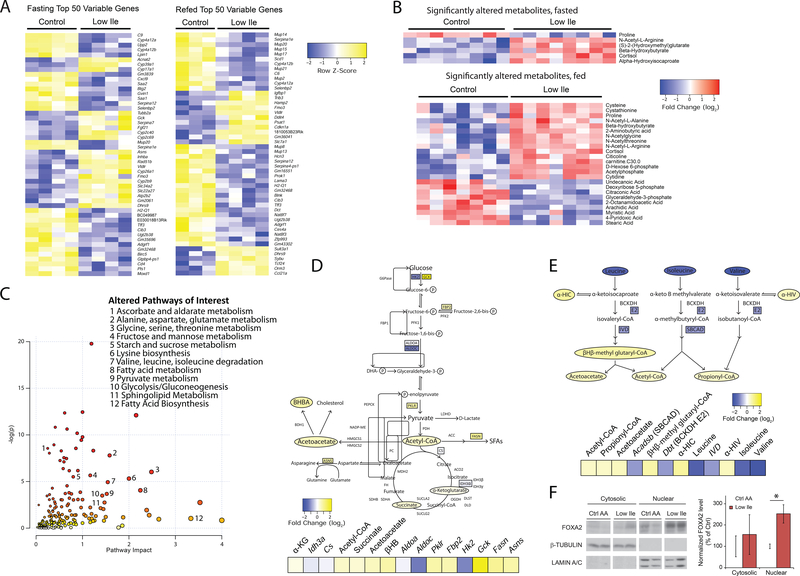
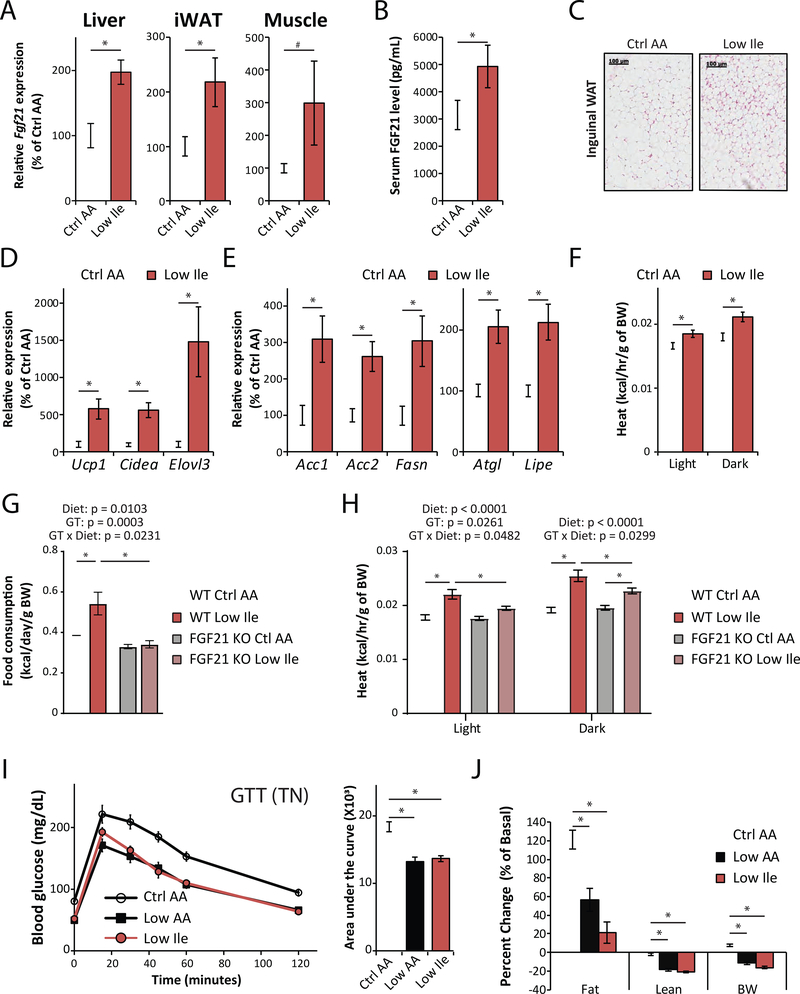
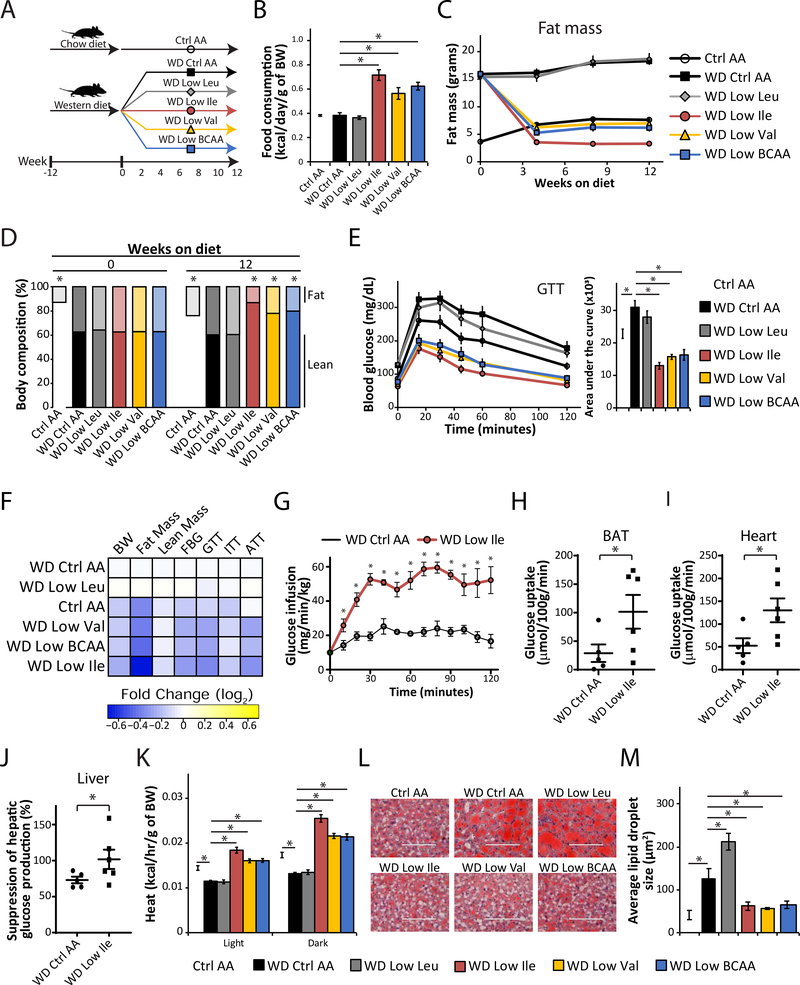
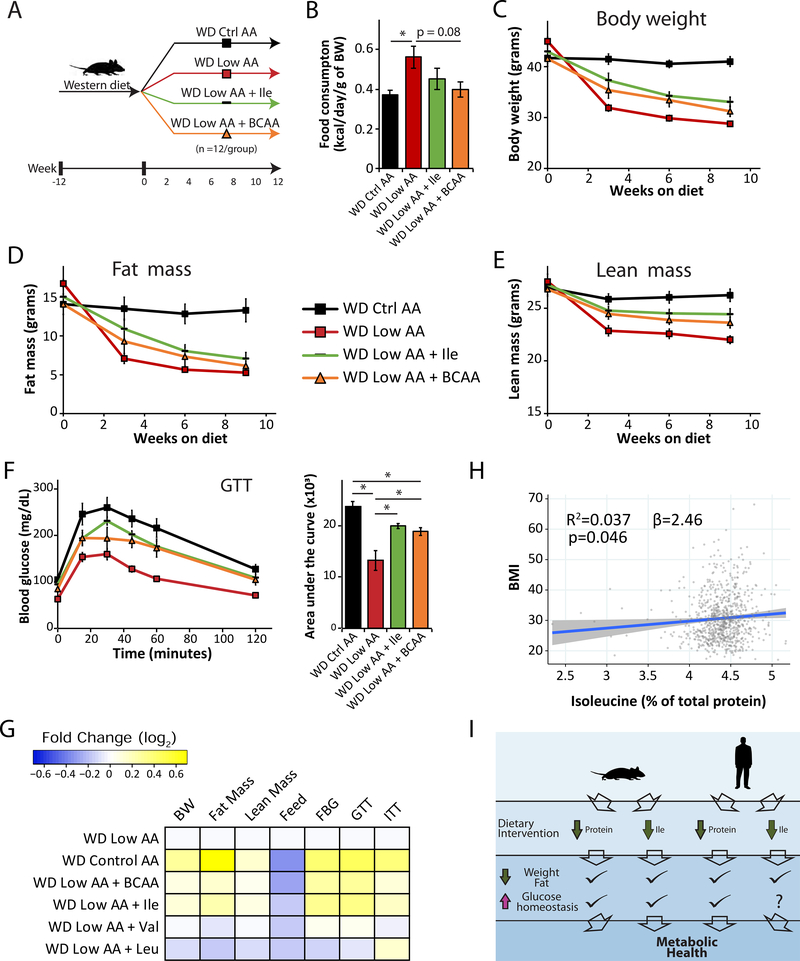
Low-protein diets promote metabolic health in rodents and humans, and the benefits of low-protein diets are recapitulated by specifically reducing dietary levels of the three branched-chain amino acids (BCAAs), leucine, isoleucine, and valine. Here, we demonstrate that each BCAA has distinct metabolic effects. A low isoleucine diet reprograms liver and adipose metabolism, increasing hepatic insulin sensitivity and ketogenesis and increasing energy expenditure, activating the FGF21-UCP1 axis. Reducing valine induces similar but more modest metabolic effects, whereas these effects are absent with low leucine. Reducing isoleucine or valine rapidly restores metabolic health to diet-induced obese mice. Finally, we demonstrate that variation in dietary isoleucine levels helps explain body mass index differences in humans. Our results reveal isoleucine as a key regulator of metabolic health and the adverse metabolic response to dietary BCAAs and suggest reducing dietary isoleucine as a new approach to treating and preventing obesity and diabetes.

Keywords: FGF21; GCN2; body mass index; branched-chain amino acids; diabetes; insulin resistance; isoleucine; mTORC1; obesity; valine.


Conflict of interest statement

Declaration of interests D.W.L. has received funding from and is a scientific advisory board member of Aeovian Pharmaceuticals, which seeks to develop novel, selective mTOR inhibitors for the treatment of various diseases. UW-Madison has applied for a patent based in part on the findings reported here, for which N.E.R. and D.W.L. are inventors.

Figures

Figure 1.
Figure 1.. Dietary restriction of Ile or Val, but not Leu, improves metabolic health.
(A) Glucose tolerance of mice after 3 weeks on a Ctrl AA diet, a Low AA diet, a Low BCAA diet, or a Low non-BCAA diet (restricted in all essential AAs except for BCAAs). (B) Change in body weight of mice after 3 weeks, n=16–18/group. (C) Experimental scheme. (D and E) Glucose tolerance (D) and pyruvate tolerance (E) of mice after 3 and 5 weeks on the indicated diets, respectively. (F) Body weight and change in body weight of mice after 12 weeks. (D-F) n = 8–9/group. *p<0.05, Tukey-Kramer test following ANOVA, means with different letters are statistically different. (G) Heatmap of the metabolic effects of each diet; FBG = fasting blood glucose. (H) Glucose tolerance of mice after 3 weeks on a Ctrl AA or a Low Ile diet (n=12–13/group; *p<0.05, Sidak’s test post 2-way RM ANOVA). (I-L) Glucose infusion rate (I), blood glucose level (J), basal and clamp hepatic glucose production (K), and insulin responsiveness (L), were determined during a hyperinsulinemic-euglycemic clamp in mice maintained on a Ctrl AA diet or a Low-Ile diet for 3 weeks (n=6–7/group; *p<0.05, Student’s t-test). Data represented as mean ± SEM.
Figure 2.
Figure 2.. Replenishing Ile significantly attenuates the metabolic effects of LP.
(A) Experimental scheme. (B) Average food consumption (normalized by body weight) during the 3rd week on the indicated diets. (C-E) Glucose tolerance (C), insulin tolerance (D), and pyruvate tolerance (E) of mice after 3, 4, or 5 weeks on the indicated diets, respectively. (F) Body weight and change in body weight of mice after 12 weeks. (B-F) n=4 cages of 3 animals each/group (B) or n=12/group (C-F); * = p<0.05, Sidak’s test post ANOVA, comparing all groups to the Ctrl AA and Low AA diet groups. (G) Heatmap of the metabolic effects of each diet. Data represented as mean ± SEM.
Figure 3.
Figure 3.. The metabolic effects of Ile restriction are independent of hepatic mTORC1 and GCN2 activity.
(A) Western blot analyses of mTORC1 signaling in the liver of fasted mice after 3 weeks of feeding the indicated diets. (B) Experimental scheme. (C) Glucose tolerance in WT and L-TSC1 KO mice fed the diets for 3 weeks (n=7–8/group; for AUC, statistics for the overall effects of genotype, diet, and the interaction represent the p value from a two-way ANOVA, *p<0.05, from a Sidak’s post-test examining the effect of parameters identified as significant in the two-way ANOVA). (D) Heatmap depiction of the metabolic effects of the indicated diets in WT and L-TSC1 KO mice. (E) Western blot analyses of GCN2 signaling in the liver of fasted mice after 3 weeks. (F) Experimental scheme. (G) Glucose tolerance in WT and L-GCN2 KO mice fed the indicated diets for 3 weeks (n=6–7/group; for AUC, statistics for the overall effects of genotype, diet, and the interaction represent the p value from a two-way ANOVA, *p<0.05, from a Sidak’s post-test examining the effect of parameters identified as significant in the 2-way ANOVA). (H) Heatmap of the metabolic effects of each diet. Data represented as mean ± SEM.
Figure 4.
Figure 4.. Ile restriction reprograms hepatic metabolism
(A) Heatmaps of top 50 variable genes in transcriptomic analysis of Control or Low Ile-fed mouse livers. (B) Heatmaps of all significantly altered metabolites in targeted metabolite analysis of Control or Low Ile-fed mouse livers. In (A) and (B), mice were either fasted overnight or fasted overnight, then refed for 3 hours. (C) Representation of pathways altered in Low Ile-fed liver based on transcriptomic and metabolomics data. Metabolic pathways of interest are highlighted. (D) Drawn pathways in central metabolism altered in Low Ile feeding. (E) Drawn pathways in BCAA degradation altered in Low Ile feeding. Genes and metabolites colored by log2-fold change in transcriptomic and metabolomics data. Data in (C), (D), and (E) is integrated from significant changes in transcriptomic and metabolomic data gathered in the fasted state. (F) Representative cropped western blots and quantification of nuclear and cytosolic FoxA2 in the liver of fasted mice after 3 weeks of feeding the diets (n=6/group; *p<0.05, Sidak’s test post ANOVA). Data represented as mean ± SEM.
Figure 5.
Figure 5.. Reducing dietary Ile induces the FGF21-UCP1 axis and promotes energy expenditure
(A) Fgf21 expression in the liver, inguinal white adipose tissue (iWAT) and muscle of Ctrl AA or Low Ile fed mice after 3 weeks of diet, n=8/group. (B) Plasma FGF21 level in Ctrl AA or Low Ile fed mice after 3 weeks of diet, n=5–8/group. (C) Representative images of H&E stained iWAT of Ctrl AA or Low Ile fed mice. Scale bar=100 μm. n=5–6/group. (D and E) Expression of thermogenic genes (D), lipolytic and lipogenic genes (E) in iWAT of Ctrl AA or Low Ile fed mice after 3 weeks on the indicated diets. n=8/group. (A-E) *p<0.05, t-test. (F) Energy expenditure (Heat) in mice after 6 weeks on the diets as assessed by metabolic chambers. n=5–8/group. *p<0.05, Dunnett’s test post ANOVA, considering data from all groups shown in Figure S4L. (G-H) Food consumption per gram of body weight (G) measured after 3 weeks of diet, and energy expenditure (H) measured after 12 weeks of diet to wild-type and FGF21 KO mice (n=6–9/group; the overall effect of genotype (GT), diet, and the interaction represent the p-value from a 2-way ANOVA conducted separately for the light and dark cycles; *p<0.05, Sidak’s test post 2-way ANOVA). (I and J) Glucose tolerance (I) and change in body composition (J) of mice housed at thermoneutral (TN) temperature (28.5°C) (n=12/group; *p<0.05, Sidak’s test post ANOVA). Data represented as mean ± SEM.
Figure 6.
Figure 6.. Restricting dietary Ile or Val improves metabolic health of DIO mice.
(A) Experimental scheme. (B) Food consumption normalized by body weight during the 3rd week on the diets. (C – D) Fat mass (C), body composition (D), and glucose tolerance (E) of mice consuming the indicated diets. (B-E) n=5–6 cages of 2 animals each/group (B) or n = 10/group (C-E); (B, D, E) *p < 0.05, Dunnett’s test post ANOVA, each group compared to the WD Ctrl AA group. (F) Heatmap of the metabolic effects of each diet. (G-J) Glucose infusion rate (G), glucose uptake into BAT (H) and heart (I), and hepatic insulin responsiveness (J) was determined during a hyperinsulinemic-euglycemic clamp in mice preconditioned with a WD for 12 weeks and then maintained on either a WD Ctrl AA diet or a WD Low Ile diet for 3 weeks. Each symbol represents a single animal (n=5–6/group, 1-tailed Student’s t-test, *p<0.05). (K) Energy expenditure (Heat) as assessed by metabolic chamber (n =5–8/group). (L-M) Representative Oil-Red-O–stained sections of liver of mice after 12 weeks on the diets, scale bar=100 μm (L) and quantification of lipid droplet size (M) (n=4/group). (K-M) *p<0.05, Dunnett’s test post ANOVA, groups compared to the of WD Ctrl AA diet group. *p<0.05. Data represented as mean ± SEM.
Figure 7.
Figure 7.. Increased Ile intake attenuates the beneficial effects of LP on obesity and is associated with higher BMI in human.
(A) Experimental scheme. (B) Average food consumption during the first month on the indicated diets normalized by body weight. (C–F) Body weight (C), fat mass (D), lean mass (E), and glucose tolerance (F) of mice consuming WD Ctrl AA, WD Low AA, WD Low AA + Ile, and WD Low AA + BCAA diets. (B-F) n=6 cages of 2 animals each/group (B) or n=11–12/group (C-F); *p<0.05, Sidak’s test post ANOVA; each group compared to the WD Ctrl AA and WD Low AA groups. (G) Heatmap of the metabolic effects of each diet. (H) Association between body mass index (BMI) and percent of total protein from Ile from the SHOW study (n=788, shaded area represents 95% CI). (I) Graphic summary of the study. Data represented as mean ± SEM.

Comment in

  • The coming of age for branched-chain amino acids.
    Gao C, Cao N, Wang Y. Gao C, et al. J Cardiovasc Aging. 2021;1(2):10.20517/jca.2021.02. doi: 10.20517/jca.2021.02. Epub 2021 May 14. J Cardiovasc Aging. 2021. PMID: 34568877 Free PMC article. No abstract available.

References

    1. (1999). Diabetes mellitus: a major risk factor for cardiovascular disease. A joint editorial statement by the American Diabetes Association; The National Heart, Lung, and Blood Institute; The Juvenile Diabetes Foundation International; The National Institute of Diabetes and Digestive and Kidney Diseases; and The American Heart Association. Circulation 100, 1132–1133. - PubMed
    1. Akter S, Mizoue T, Nanri A, Goto A, Noda M, Sawada N, Yamaji T, Iwasaki M, Inoue M, Tsugane S, et al. (2020). Low carbohydrate diet and all cause and cause-specific mortality. Clin Nutr. - PubMed
    1. Appuhamy JA, Knoebel NA, Nayananjalie WA, Escobar J, and Hanigan MD (2012). Isoleucine and leucine independently regulate mTOR signaling and protein synthesis in MAC-T cells and bovine mammary tissue slices. J Nutr 142, 484–491. - PubMed
    1. Arriola Apelo SI, Singer LM, Lin XY, McGilliard ML, St-Pierre NR, and Hanigan MD (2014). Isoleucine, leucine, methionine, and threonine effects on mammalian target of rapamycin signaling in mammary tissue. J Dairy Sci 97, 1047–1056. - PubMed
    1. Ayala JE, Bracy DP, Julien BM, Rottman JN, Fueger PT, and Wasserman DH (2007). Chronic treatment with sildenafil improves energy balance and insulin action in high fat-fed conscious mice. Diabetes 56, 1025–1033. - PubMed

Publication types

MeSH terms