Review
. 2021 Aug 20;433(17):166995.
doi: 10.1016/j.jmb.2021.166995. Epub 2021 Apr 20.

Structural Insights into the Mechanisms and Pharmacology of K2P Potassium Channels

Affiliations
Review

Structural Insights into the Mechanisms and Pharmacology of K2P Potassium Channels

Andrew M Natale et al. J Mol Biol. .

Abstract

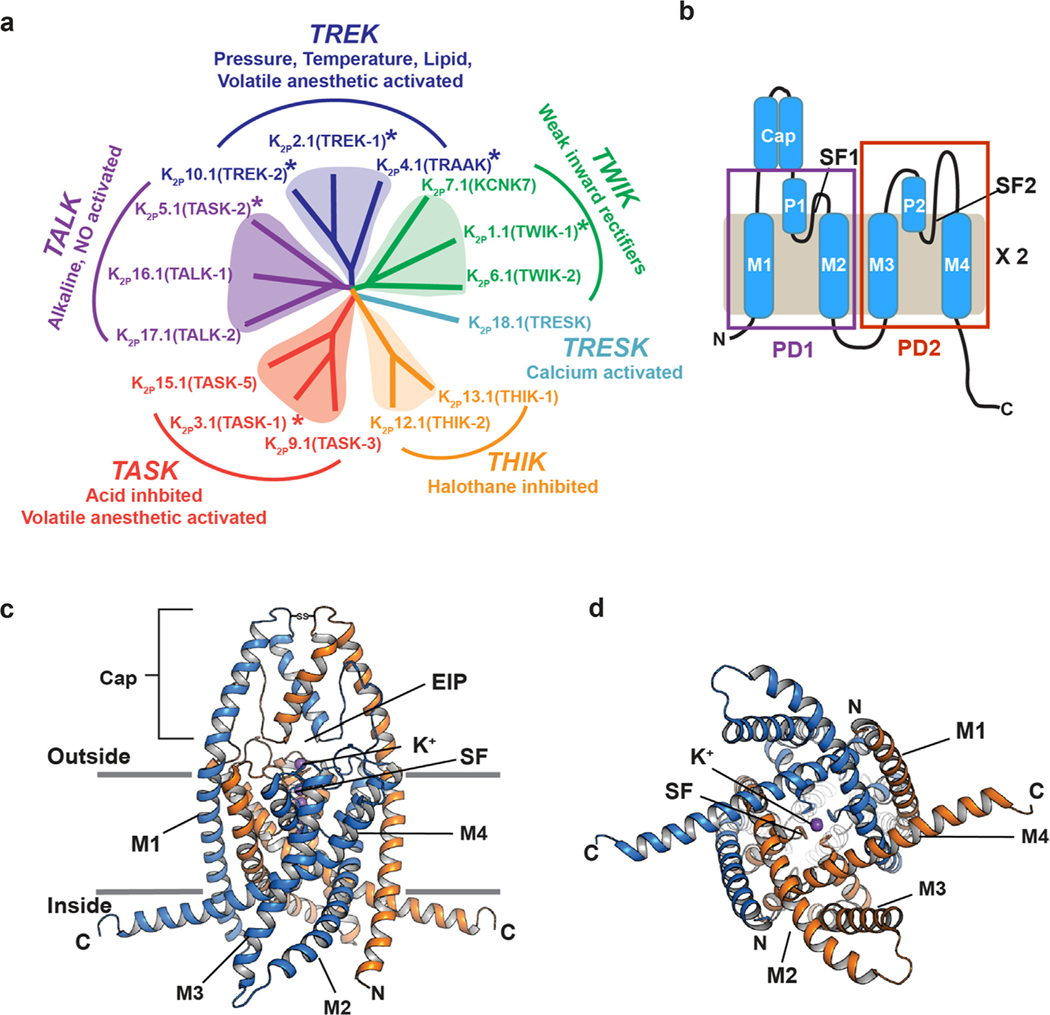
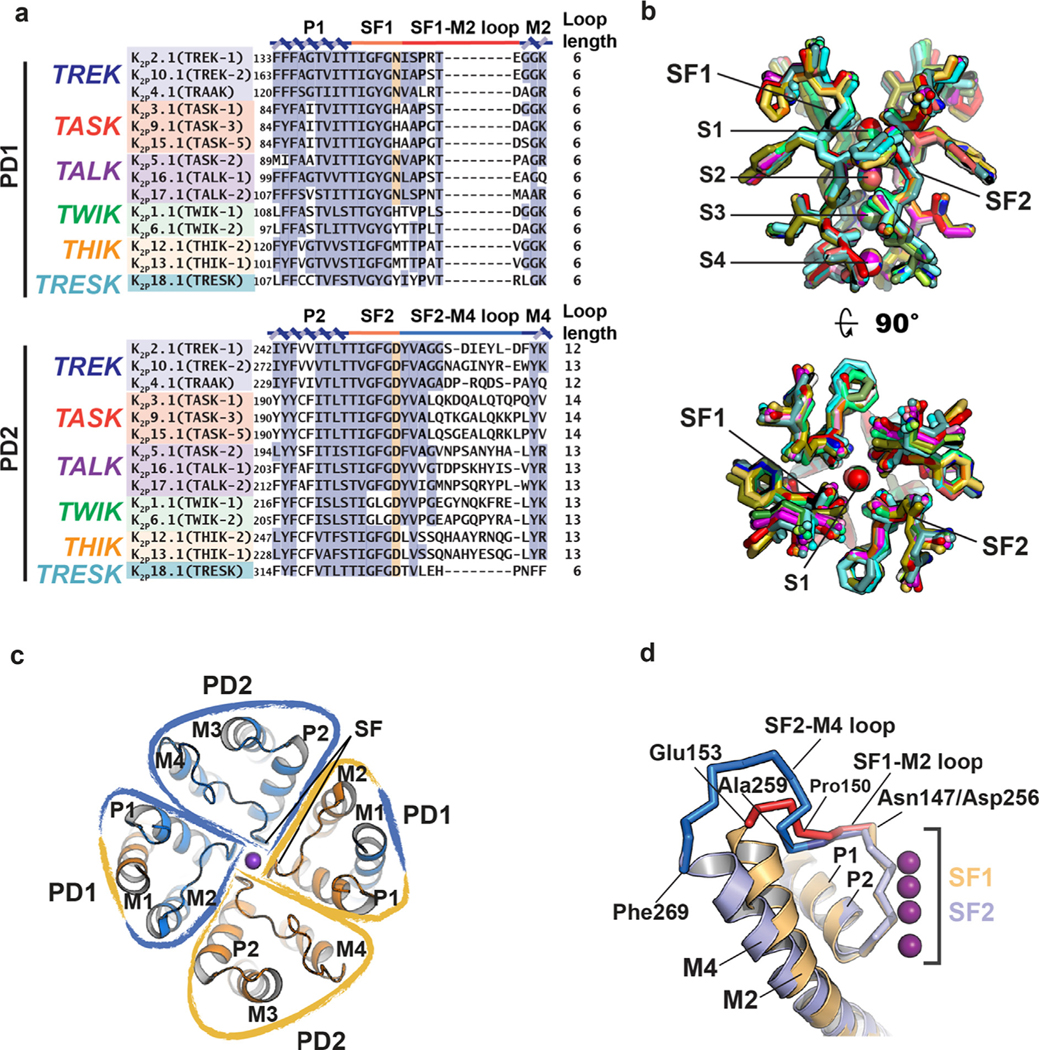
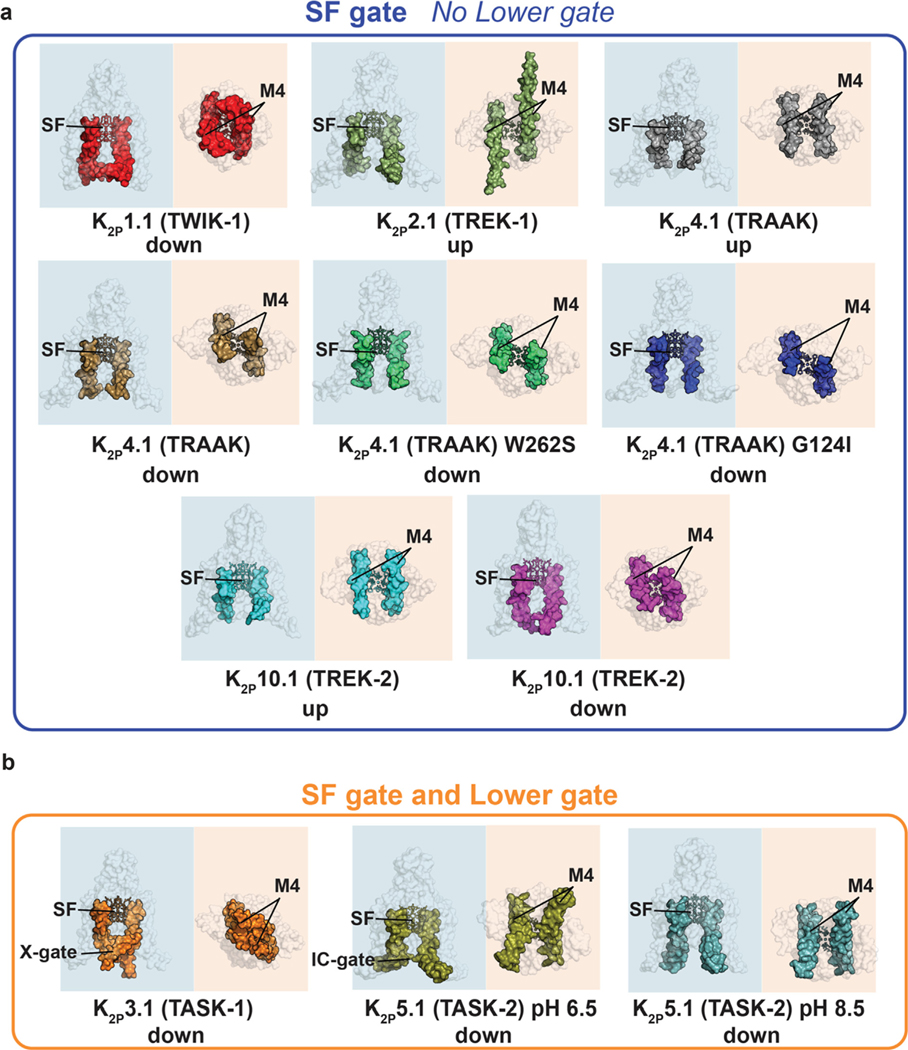
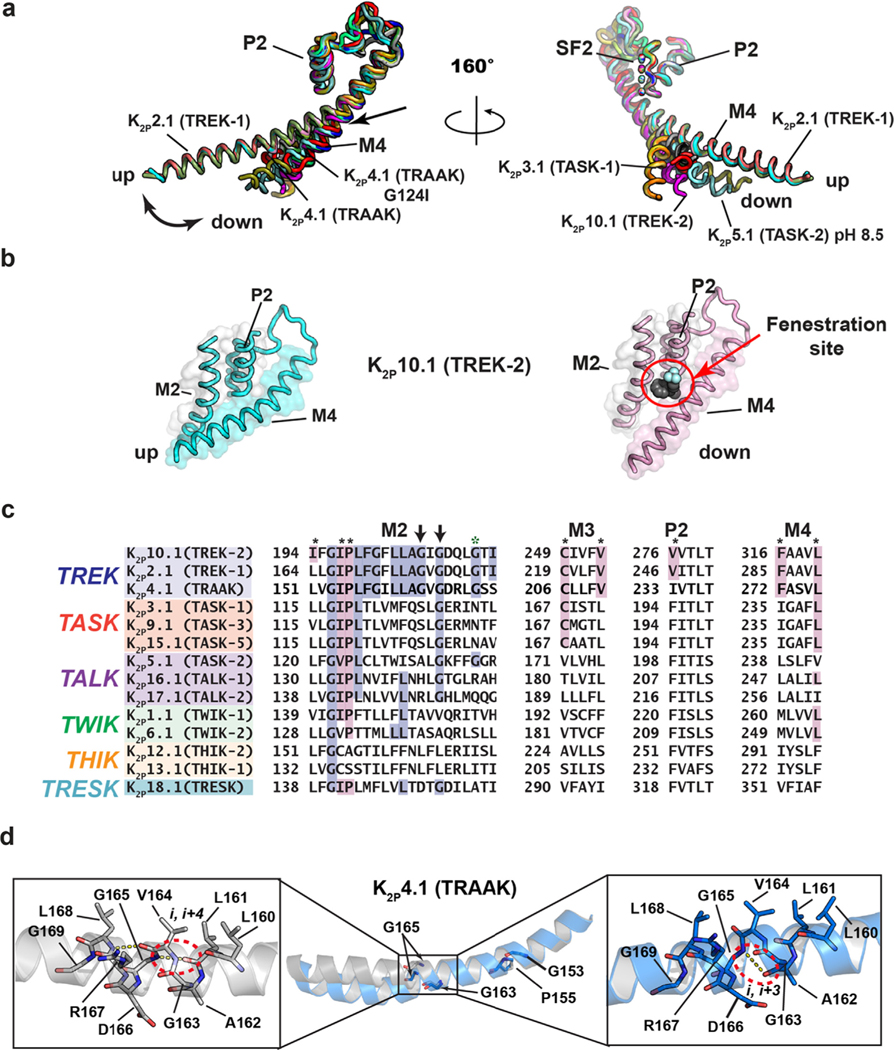
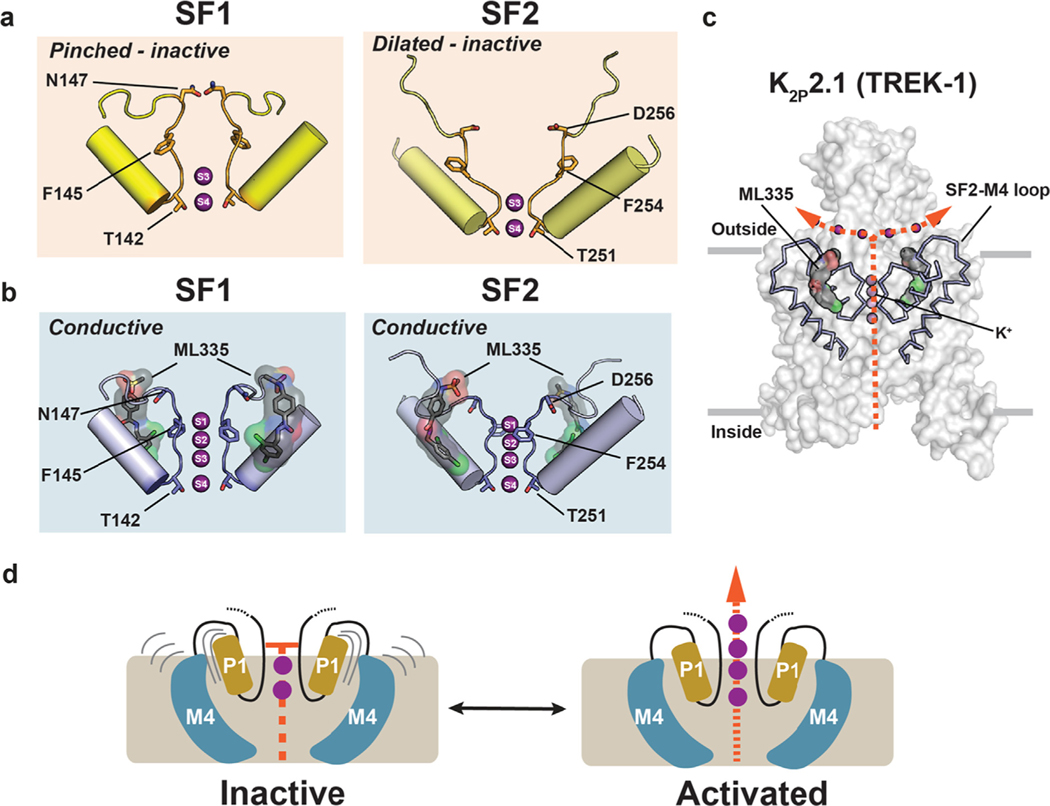
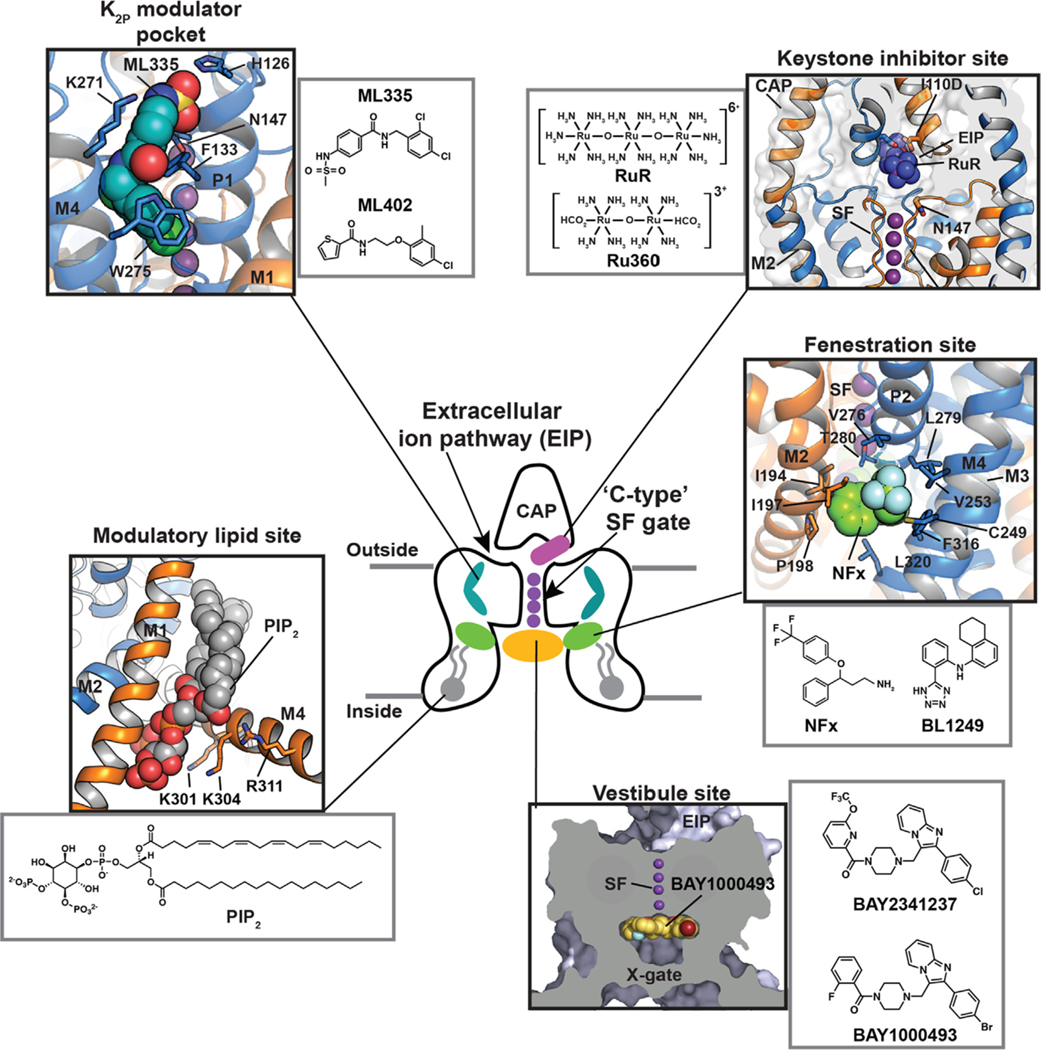
Leak currents, defined as voltage and time independent flows of ions across cell membranes, are central to cellular electrical excitability control. The K2P (KCNK) potassium channel class comprises an ion channel family that produces potassium leak currents that oppose excitation and stabilize the resting membrane potential in cells in the brain, cardiovascular system, immune system, and sensory organs. Due to their widespread tissue distribution, K2Ps contribute to many physiological and pathophysiological processes including anesthesia, pain, arrythmias, ischemia, hypertension, migraine, intraocular pressure regulation, and lung injury responses. Structural studies of six homomeric K2Ps have established the basic architecture of this channel family, revealed key moving parts involved in K2P function, uncovered the importance of asymmetric pinching and dilation motions in the K2P selectivity filter (SF) C-type gate, and defined two K2P structural classes based on the absence or presence of an intracellular gate. Further, a series of structures characterizing K2P:modulator interactions have revealed a striking polysite pharmacology housed within a relatively modestly sized (~70 kDa) channel. Binding sites for small molecules or lipids that control channel function are found at every layer of the channel structure, starting from its extracellular side through the portion that interacts with the membrane bilayer inner leaflet. This framework provides the basis for understanding how gating cues sensed by different channel parts control function and how small molecules and lipids modulate K2P activity. Such knowledge should catalyze development of new K2P modulators to probe function and treat a wide range of disorders.

Keywords: K(2P) channel; M2 and M4 helix transmembrane motions; polysite pharmacology; selectivity filter C-type gate.


Conflict of interest statement

Declaration of Competing Interest The authors declare that they have no known competing financial interests or personal relationships that could have appeared to influence the work reported in this paper.

Figures

Figure 1.
Figure 1.
K2P channel family relationships and structure. (a) K2P family dendrogram. Subfamilies and key characteristics are indicated. Asterisks indicate structurally characterized K2Ps. (b) K2P subunit diagram. Pore domains 1 and 2 (PD1 and PD2), transmembrane helices (M1–M4), pore helices (P1 and P2), selectivity filters (SF1 and SF2), and Cap domain are indicated. (c and d) Cartoon diagram of the K2P2.1 (TREK-1) structure (PDB:6CQ6). Chains are colored marine and orange. Potassium ions are purple. Grey lines indicate membrane. c, side view, (d) cytoplasmic view. Channel elements are labeled as in ‘b’. ‘EIP’ denotes the extracellular ion pathway.
Figure 2.
Figure 2.
K2P pore region structure. (a) Sequence alignment of selectivity filter and loop regions of PD1 and PD2 for the indicated channels. P1, M2, P2, and M4 helices (blue), SF1 and SF2 (orange), SF1-M2 loop (red), and SF2-M4 loop (light blue) are indicated. Terminal residue of the selectivity filter is highlighted. (b) Superposition of the selectivity filters and permeant ions for: K2P1.1 (TWIK-1) (3UKM) (red), K2P2.1 (TREK-1) (6CQ6) (smudge), K2P2.1 (TREK1):ML335 (6CQ8) (deep salmon), K2P2.1 (TREK-1):ML402 (6CQ9), K2P3.1 (TASK-1) (6RV2) (orange), K2P3.1 (TASK-1):BAY1000493 (6RV3) (yellow orange), K2P3.1 (TASK-1):BAY2341237(6RV4) (olive), K2P4.1 (TRAAK) (3UM7) (aquamarine), (4I9W) (limon), (4WFE) (forest green), (4WFF) (white), (4WFG) (grey), (4WFH) (black), K2P4.1 (TRAAK) G124I (4RUE) (blue), K2P4.1 (TRAAK) W262S (4RUF) (lime green), K2P5.1 (TASK-2) pH 6.5 (6WLV) (deep olive), K2P5.1 (TASK-2) pH 8.5 (6WM0) (light teal), K2P10.1 (TREK-2) (4BW5) (pink), (4XDJ) (magenta), (4XDK) (purple). SF1, SF2 and ion binding positions, S1-S4, are indicated. Ions are shown as spheres and colored according to the parent structure. (c) K2P pore domains (PD1 and PD2) highlighting the inherent heterotetrameric nature of the pore and the domain-swapped positions of M1. (d) Superposition of K2P2.1 (TREK-1) (PDB:6CQ6) P1-SF1-M2 (orange) and P2-SF2-M4 (slate). SF1-M2 loop (red) and SF2-M4 loop (blue) and portions having a shared conformation (dark blue) are indicated. Residue labels indicate the SF1-M2 and SF2-M4 loop ends and structural divergence point (Pro150/Ala259). GenBank sequences in ‘a’ are: K2P2.1 (TREK-1), AAD47569.1; K2P10.1 (TREK-2), AAL95705.1; K2P4.1 (TRAAK), AAF64062.1; K2P3.1 (TASK-1), AAC51777.1; K2P9.1 (TASK-3), AAF63708.1; K2P15.1 (TASK-5), AAG33127.1; K2P5.1 (TASK-2), AAC79458.1; K2P16.1 (TALK-1), AAK49532.1; K2P17.1 (TALK-2), AAK49533.1; K2P1.1 (TWIK-1), AAB01688.1, K2P6.1 (TWIK-2), AAD22980.1; K2P12.1 (THIK-2), AAG32313.1; K2P13.1 (THIK-1), AAG32314.1; K2P18.1 (TRESK), BAC78527.1.
Figure 3.
Figure 3.
K2P structure comparison highlighting the M4 position and presence or absence of a lower gate. (a) K2Ps having only the SF gate: K2P1.1 (TWIK-1) (PDB:3UKM), K2P2.1 (TREK-1) (PDB:6CQ6), K2P4.1 (TRAAK) (PDB:4WFG), K2P4.1 (TRAAK) (PDB:4WFF), K2P4.1 W262S (PDB:4RUF), K2P4.1 (TRAAK) G124I (PDB:4RUE), K2P10.1 (TREK-2) (PDB:4BW5), K2P10.1 (TREK-2) (PDB:4XDJ). (b) K2Ps having both an SF gate and a Lower gate K2P3.1 (TASK-1) (PDB:6RV2) and K2P5.1 (TASK-2) pH 8.5 (PDB:6WM0). SF, M4, X-gate, Intracellular gate (IC gate) are indicated. ‘Up’ and ‘down’ indicate M4 position. Shading indicates view from the side (blue) and intracellular face (orange).
Figure 4.
Figure 4.
K2P transmembrane moving parts. (a) Superposition of the P2-SF2-M4 portion for: K2P1.1 (TWIK-1) (3UKM) (red), K2P2.1 (TREK-1) (6CQ6) (smudge), K2P2.1 (TREK-1):ML335 (6CQ8) (deep salmon), K2P2.1 (TREK-1):ML402 (6CQ9), K2P3.1 (TASK-1) (6RV2) (orange), K2P3.1 (TASK-1):BAY1000493 (6RV3) (yellow orange), K2P3.1 (TASK-1):BAY2341237(6RV4) (olive), K2P4.1 (TRAAK) (3UM7) (aquamarine), (4I9W) (limon), (4WFE) (forest green), (4WFF) (white), (4WFG) (grey), (4WFH) (black), K2P4.1 (TRAAK) G124I (4RUE) (blue), K2P4.1 (TRAAK) W262S (4RUF) (lime green), K2P5.1 (TASK-2) pH 6.5 (6WLV) (deep olive), K2P5.1 (TASK-2) pH 8.5 (6WM0) (light teal), K2P10.1 (TREK-2) (4BW5) (pink), (4XDJ) (magenta), (4XDK) (purple). Select structures are indicated. Arrow indicates point of M4 bend. (b) View of the ‘up’ (left) and ‘down’ (right) M4 conformations in K2P10.1 (TREK-2). Fenestration site is occupied by norfluoxetine (space filling) and is indicated by the red circle. (c) Sequence comparisons of the M2 helix and elements that frame the Fenestration site. Residues that interact with the Fenestration site ligand are indicated by the black asterisks and are highlighted in magenta (cf. Figure 6). TREK subfamily ‘GVG’ sequence is indicated by the arrows. Green asterisk indicates the position of azo-isoflurane labeling. (d) Buckling at the conserved TREK family ‘GVG’ sequence in K2P4.1 (TRAAK). Dashed red oval highlights the site of the i,i + 4 to i,i + 3 hydrogen bond shift. Residue numbers are from human K2P4.1 (TRAAK) PDB:4RUE. Genbank sequences in ‘c’ are the same as those in Figure 2(a).
Figure 5.
Figure 5.
Structural changes in the K2P selectivity filter C-type gate. (a) SF1 and SF2 structures in low [K+] showing the pinched and dilated conformations. (b) SF1 and SF2 structures in low [K+] showing the conductive conformation with ML335 (surface and sticks). (c) Structure of K2P2.1 (TREK-1) (solid) highlighting SF2 and the surrounding structure (wireframe), ML335 (black, space filling), and potassium ions (purple spheres). Orange arrows show the flow of K+ through the channel. Grey bars indicate the membrane. (d) Model for K2P gating at the K2P C-type gate. Grey lines indicate mobile elements. Only P1 and M4 are depicted for simplicity. Activation involves rigidification of the SF gate elements and increased ion flow. K+ ions are shown as purple spheres. ML335 is shown in space filling. In ‘a’ and ‘b’ ion positions and select SF residues are indicated.
Figure 6.
Figure 6.
Polysite model of K2P structural pharmacology. Central cartoon shows the locations of structurally defined K2P small molecule binding sites including the Keystone inhibitor site (magenta) (PDB: 6V3I), K2P modulator pocket (cyan) (PDB:6CQ8), Fenestration site (green) (PDB:4XDK), Modulatory lipid site (grey) (PDB:6W8C), and Vestibule site (orange) (PDB: 6RV3). Cap, Extracellular ion pathway (EIP), and ‘C-type’ SF gate are indicated. Potassium ions are shown (purple). Grey lines denote the lipid bilayer. Black boxes show the details of the individual sites. Grey boxes show modulator chemical structures. X-gate is not shown in the central cartoon.

References

    1. Hodgkin AL, Huxley AF, (1947). Potassium leakage from an active nerve fibre. J. Physiol, 106, 341–367. - PMC - PubMed
    1. Hodgkin AL, Huxley AF, (1952). A quantitative description of membrane current and its application to conduction and excitation in nerve. J. Physiol, 117, 500–544. - PMC - PubMed
    1. Hodgkin AL, Katz B, (1949). The effect of sodium ions on the electrical activity of giant axon of the squid. J. Physiol, 108, 37–77. - PMC - PubMed
    1. Lesage F, Guillemare E, Fink M, Duprat F, Lazdunski M, Romey G, et al., (1996). TWIK-1, a ubiquitous human weakly inward rectifying K+ channel with a novel structure. EMBO J., 15, 1004–1011. - PMC - PubMed
    1. Fink M, Duprat F, Lesage F, Reyes R, Romey G, Heurteaux C, et al., (1996). Cloning, functional expression and brain localization of a novel unconventional outward rectifier K+ channel. EMBO J., 15, 6854–6862. - PMC - PubMed

Publication types

MeSH terms