

Prediction of Covid-19 spreading and optimal coordination of counter-measures: From microscopic to macroscopic models to Pareto fronts
- PMID: 33887760
- PMCID: PMC8062158
- DOI: 10.1371/journal.pone.0249676
Prediction of Covid-19 spreading and optimal coordination of counter-measures: From microscopic to macroscopic models to Pareto fronts
Abstract
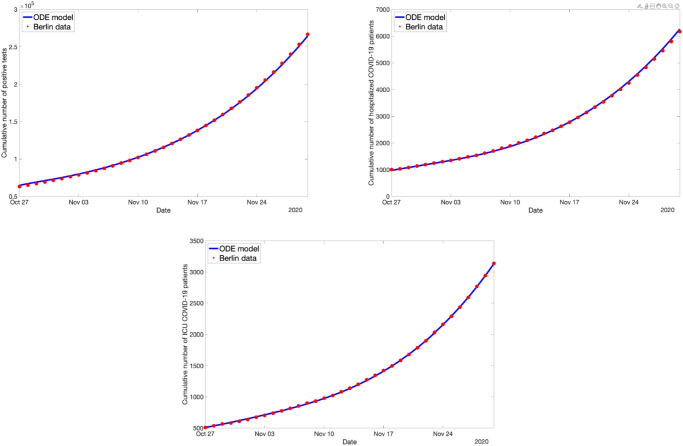
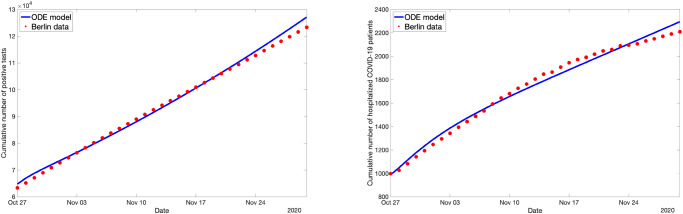
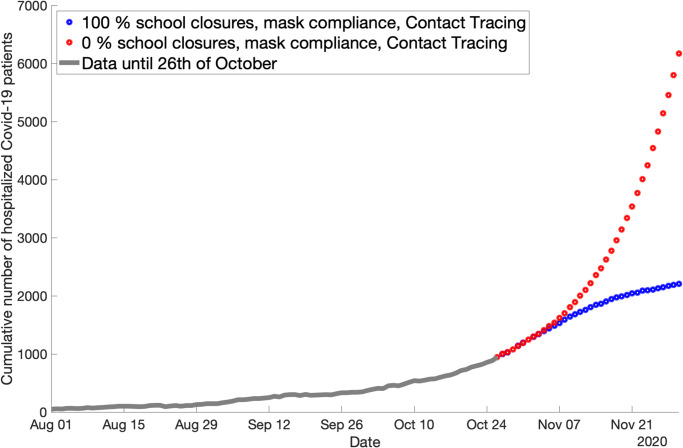
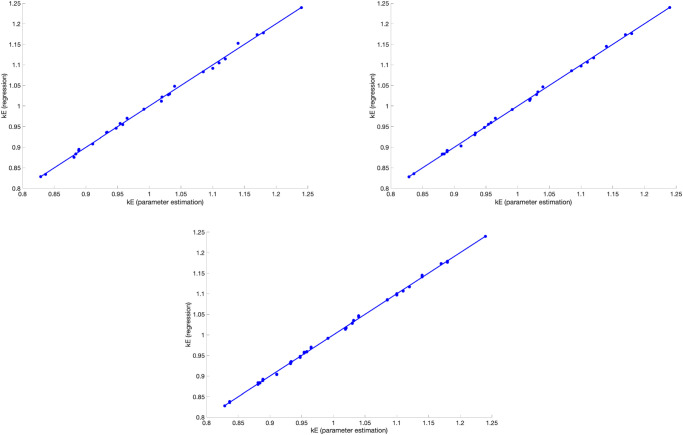
The Covid-19 disease has caused a world-wide pandemic with more than 60 million positive cases and more than 1.4 million deaths by the end of November 2020. As long as effective medical treatment and vaccination are not available, non-pharmaceutical interventions such as social distancing, self-isolation and quarantine as well as far-reaching shutdowns of economic activity and public life are the only available strategies to prevent the virus from spreading. These interventions must meet conflicting requirements where some objectives, like the minimization of disease-related deaths or the impact on health systems, demand for stronger counter-measures, while others, such as social and economic costs, call for weaker counter-measures. Therefore, finding the optimal compromise of counter-measures requires the solution of a multi-objective optimization problem that is based on accurate prediction of future infection spreading for all combinations of counter-measures under consideration. We present a strategy for construction and solution of such a multi-objective optimization problem with real-world applicability. The strategy is based on a micro-model allowing for accurate prediction via a realistic combination of person-centric data-driven human mobility and behavior, stochastic infection models and disease progression models including micro-level inclusion of governmental intervention strategies. For this micro-model, a surrogate macro-model is constructed and validated that is much less computationally expensive and can therefore be used in the core of a numerical solver for the multi-objective optimization problem. The resulting set of optimal compromises between counter-measures (Pareto front) is discussed and its meaning for policy decisions is outlined.
Conflict of interest statement
The authors have declared that no competing interests exist.
Figures
References
-
- World Health Organization. https://www.who.int/health-topics/coronavirus#tab=tab_3, accessed September 2020.
-
- The COVID Tracking Project. https://covidtracking.com/data, accessed September 2020.
-
- Johns Hopkins University. https://coronavirus.jhu.edu/map.html, accessed September 2020.
-
- World Health Organization. WHO numbers. https://covid19.who.int/, accessed September 2020.
-
- US Centers for Disease Control and Prevention. https://www.cdc.gov/coronavirus/2019-ncov/need-extra-precautions/people-..., accessed September 2020.
Publication types
MeSH terms
LinkOut - more resources
Full Text Sources
Medical
Research Materials
Miscellaneous
