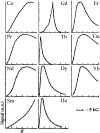
Electron paramagnetic resonance of lanthanides
- PMID: 33888211
- PMCID: PMC10076100
- DOI: 10.1016/bs.mie.2021.01.038
Electron paramagnetic resonance of lanthanides
Abstract
Many applications of lanthanides exploit their electron spin relaxation properties. Double electron-electron measurements of distances are possible because of the relatively long relaxation times of Gd3+. Relaxation enhancement measurements of distance are possible because of the much shorter relaxation times of other lanthanides. Magnetic resonance imaging contrast agents use the long relaxation time of the S-state Gd3+ ion, and NMR shift reagents use the fast relaxation of selected other lanthanides. Other than Gd3+ and the isoelectronic Eu2+ ion, spin relaxation of the lanthanides is so fast that their EPR spectra can be observed only in the liquid helium temperature range. In this chapter the EPR properties of each of the lanthanides is briefly summarized, with an emphasis on electron spin relaxation.
Keywords: Electron paramagnetic resonance; Electron spin relaxation; Kramers' ion; Non-Kramers' ions.
Copyright © 2021 Elsevier Inc. All rights reserved.
Figures


 ) 1.0 mM Gd3+, 1/Tm for (
 ) 2.0 mM Gd(DTPA)2−, 1/T1 for (
 ) 1.0 mM Gd3+, and 1/T1 for (
 ) 2.0 mM Gd(DTPA)2− (unpublished data).
 ) 10 mM Tb3+ in 1:1 water:ethanol, (
 ) 1 mM Tb3+ in 1:1 water:ethanol, (
 ) Tb2(oxalate)3 in La(oxalate)3, (
 ) 10 mM Tm3+ in 1:1 water:ethanol, (
  ) 1 mM Tm3+ in 1:1 water:ethanol; 1/T1 for (
 ) 10 mM Tb3+ in 1:1 water:ethanol, (
 ) 1 mM Tb3+ in 1:1 water:ethanol, (
 ) Tb2(oxalate)3 in La(oxalate)3, (
 ) 10 mM Tm3+ in 1:1 water:ethanol, (
 ) 1 mM Tm3+ in 1:1 water:ethanol. The solid lines are fits to the temperature dependence of 1/T1 including contributions from the direct and Raman processes. Figure reproduced, with permission, from (McPeak et al. 2020).
References
-
- Abragam A and Bleaney B (1970). Electron Paramagnetic Resonance of Transition Ions, Oxford, Oxford University Press.
-
- Aggarwal P, Eaton SS and Eaton GR (2016). Effect of Lanthanide and Cobalt Ions on Electron Spin Relaxation of Tempone in Glassy Water:Glycerol at 20 to 200 K. Appl. Magn. Reson 47: 1123–1134.
-
- Al'tshuler SA and Kozyrev BM (1974). Electron Paramagnetic Resonance in Compounds of Transition Elements.2nd ed. Ed., Jerusalem, Halsted-Wiley.
-
- Alsaadi BM, Rossotti RJC and Williams RJP (1980). Electron relaxation rates of lanthanide aquo-cations. J. C. S. Dalton Trans 1980: 2147–2150.
Publication types
MeSH terms
Substances
Grants and funding
LinkOut - more resources
Full Text Sources
Other Literature Sources

