. 2021 Oct;31(10):1952-1969.
doi: 10.1101/gr.271791.120. Epub 2021 Apr 22.

Comprehensive characterization of tissue-specific chromatin accessibility in L2 Caenorhabditis elegans nematodes

Affiliations

Comprehensive characterization of tissue-specific chromatin accessibility in L2 Caenorhabditis elegans nematodes

Timothy J Durham et al. Genome Res. 2021 Oct.

Abstract

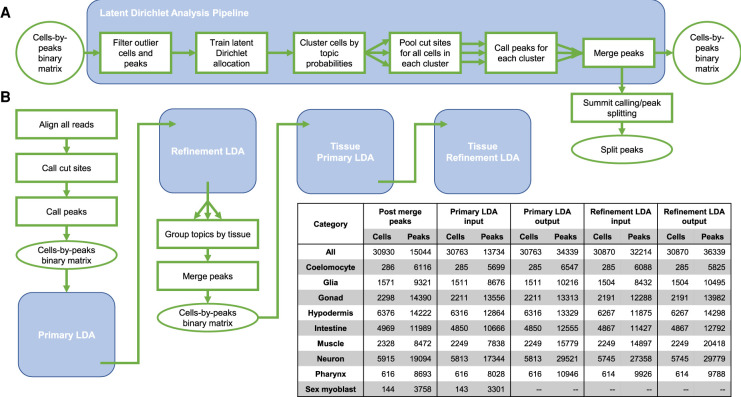
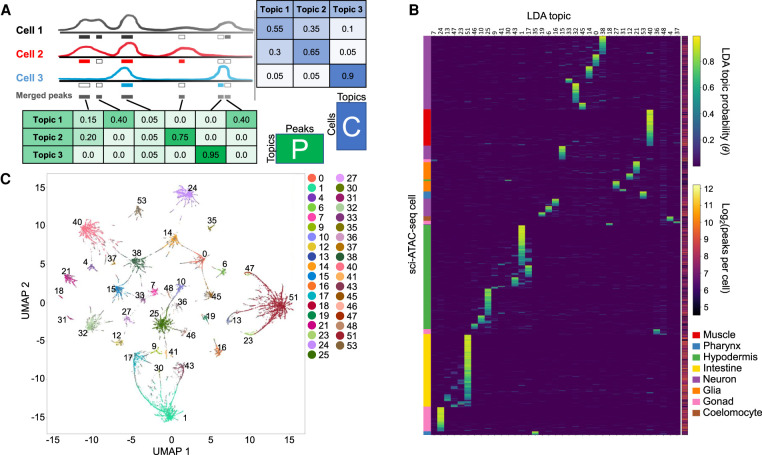
Recently developed single-cell technologies allow researchers to characterize cell states at ever greater resolution and scale. Caenorhabditis elegans is a particularly tractable system for studying development, and recent single-cell RNA-seq studies characterized the gene expression patterns for nearly every cell type in the embryo and at the second larval stage (L2). Gene expression patterns give insight about gene function and into the biochemical state of different cell types; recent advances in other single-cell genomics technologies can now also characterize the regulatory context of the genome that gives rise to these gene expression levels at a single-cell resolution. To explore the regulatory DNA of individual cell types in C. elegans, we collected single-cell chromatin accessibility data using the sci-ATAC-seq assay in L2 larvae to match the available single-cell RNA-seq data set. By using a novel implementation of the latent Dirichlet allocation algorithm, we identify 37 clusters of cells that correspond to different cell types in the worm, providing new maps of putative cell type-specific gene regulatory sites, with promise for better understanding of cellular differentiation and gene regulation.


Figures

Figure 1.
Figure 1.
An iterative peak calling procedure yields more peaks from the complex mix of worm cell types. (A) The core peak calling procedure is to model the data using latent Dirichlet allocation (LDA), cluster the cells, and call peaks based on the clusters. (B) A flow chart represents the overall peak-calling strategy. First, bulk peaks are called, followed by two iterations of clustering and peak calling based on an LDA model. Then, we group the cells by tissue and repeat the two steps of clustering and peak calling. The number of cells included and the number of peaks called at each step are given in the inset table.
Figure 2.
Figure 2.
The peaks called from sci-ATAC-seq data show substantial overlap with existing chromatin data collected from whole worms. (A) The majority of sci-ATAC-seq peaks overlap sites called in the transcription factor (TF) ChIP-seq peaks from modERN or the bulk ATAC-seq peaks from Jänes et al. (2018). (B) Peaks from the other data sets also show substantial overlap with sci-ATAC-seq peaks. Most of the ChIP-seq TF peaks that do not overlap a sci-ATAC-seq peak are singleton peaks that are only found in a single experiment. (C) Breaking out the ChIP-seq peak overlaps by the developmental stage of the worms assayed and comparing the distribution across stages of the peaks with overlaps compared with the stage distribution for randomly selected ChIP-seq peaks show an enrichment for peaks found in larval stage L2. Error bars, 95% confidence interval.
Figure 3.
Figure 3.
LDA modeling yields 37 major cell clusters that are characterized mostly by a single topic each. (A) LDA modeling learns latent topics that explain the data and return two matrices, here designated P and C. Matrix P, referred to in the text as the peaks-by-topics matrix, captures the probability distribution of each topic over all peaks, whereas matrix C, referred to in the text as the cells-by-topics matrix, captures the probability distribution of each cell over all topics. (B) Heatmap showing the normalized C matrix values for the 37 topics associated with clusters; this plot highlights that most cells have probability concentrated in one or a few topics. Cell types determined for the topics based on analysis of the P matrix are annotated on the left, and the number of peaks per cell is shown to the right. (C) UMAP embedding of the C matrix colored to indicate the 37 cell clusters. Any cells that are not assigned to a cluster are plotted as small gray dots and are mostly found on the periphery of the clusters.
Figure 4.
Figure 4.
Overlapping peaks important for each topic with ChIP-seq peaks collected from cell type–specific TFs suggests at least some topics represent tissue types. Peaks associated with each topic were overlapped with ChIP-seq peaks for three cell type–specific TFs: HLH-1, which is specific for muscle (top); ELT-1, which is specific for seam cells (middle); and ELT-2, which is specific for the intestine (bottom). Topic distributions for peaks with ChIP-seq site overlaps were compared with the topic distribution for randomly sampled peaks, and the results are plotted here as the log2 ratio of the overlap topic distribution to the random topic distribution. Error bars, 95% confidence interval for 100 random samples.
Figure 5.
Figure 5.
Topic-specific peaks tend to be near tissue-specific genes. Peaks associated with each topic were mapped to the nearest downstream gene, and the tissue expression distribution of the genes near the top 250 most-specific peaks for each topic was compared with the tissue expression distribution of 250 randomly selected genes. Here we plot the results as the log2 ratio of the topic-associated tissue expression distribution to that of randomly selected genes. Error bars, 95% confidence interval after comparing to the tissue expression distribution of 100 random samples. LDA topic numbers are shown in the bottom right corner of each plot. Topics with similar tissue-specificity patterns are grouped together, and the tissue type names and colors are as in Cao et al. (2017). Tissue assignments were made by eye based on the tissue with maximal fold-change and are written in the bottom left corner of each plot. If no single tissue was clearly the maximum, then a more general tissue annotation was chosen (e.g., “neurons” for topic 38). These annotations may need to be revisited with new data. Note that for concise visualization in this figure, we display just 20 of our 37 topics, but we report a version of this figure with all 37 topics in Supplemental Figure S9. All plots have the same y-axis range, from a log2 ratio of −4.5 to 4.0.
Figure 6.
Figure 6.
Novel sites of accessible chromatin with no overlapping modERN ChIP-seq peaks show topic specificity. We compare the normalized peak-by-topic matrix values between the peaks that overlap a ChIP-seq site (A) and those that do not (B). The nonoverlapping peaks are enriched for topics associated with gonad (especially germline/topic 24) and topics associated with neurons. The nonoverlapping peaks also tend to be observed in fewer cells.
Figure 7.
Figure 7.
Known tissue-specific genes show topic-specific chromatin accessibility. UCSC Genome Browser multilocus view of the regions surrounding nine known tissue-specific genes (top and bottom), as well as the tissue expression patterns from sci-RNA-seq (middle). In each genome browser view, the top track shows the locations of sci-ATAC-seq peaks colored by tissue type, the second track shows the stacked sci-ATAC-seq signal from each tissue, the third track shows consensus peak regions around local maxima in the signal track, and the fourth track shows the gene models. The gene expression bar plots show expression values for 27 tissues in TPM units, with the same coloring and order as the legend in Figure 5.
Figure 8.
Figure 8.
Subclustering of muscle and intestinal cells separates them by position along the anterior–posterior body axis. (A) Peaks near genes that should be expressed throughout a tissue, like hlh-1 and myo-3 in body wall muscle or end-1 and elt-2 in the intestine, show accessibility in cells throughout the UMAP. (B) In both the muscle and intestine data, we can detect subclusters of cells that show peaks near genes that mark the anterior or posterior regions of these tissues based on literature and microscopy data (Packer et al. 2019).
Figure 9.
Figure 9.
Subclustering of neurons reveals finer structure that distinguishes different types of neurons. (A) Cells with reads in peaks near genes with expression patterns specific to neuron subtypes cluster together (bbs-8: ciliated sensory neurons; gcy-32: oxygen sensory neurons; unc-30: GABA-ergic neurons; mec-7: touch receptor neurons; ceh-24: cholinergic neurons). (B) Cells in the UMAP plot are colored by the number of marker genes with nearby coaccessible peaks. Here, we show marker genes for the ASE neurons, a specific pair of ciliated sensory neurons, which are identified in one of the bbs-8 clusters from A (marked by the left-facing arrow), and show marker genes shared by the oxygen sensory neurons AQR, PQR, and URX, which further support the cluster marked with gcy-32 in A (marked by the right-facing arrow).

Similar articles

Cited by

References

    1. Adey A, Morrison HG, Asan, Xun X, Kitzman JO, Turner EH, Stackhouse B, MacKenzie AP, Caruccio NC, Zhang X, et al. 2010. Rapid, low-input, low-bias construction of shotgun fragment libraries by high-density in vitro transposition. Genome Biol 11: R119. 10.1186/gb-2010-11-12-r119 - DOI - PMC - PubMed
    1. Altun ZF, Hall DH. 2002. Epithelial system, hypodermis. WormAtlas 10.3908/wormatlas.1.13 - DOI
    1. Altun ZF, Hall DH. 2009. Alimentary system, intestine. WormAtlas 10.3908/wormatlas.1.4 - DOI
    1. Araya CL, Kawli T, Kundaje A, Jiang L, Wu B, Vafeados D, Terrell R, Weissdepp P, Gevirtzman L, Mace D, et al. 2014. Regulatory analysis of the C. elegans genome with spatiotemporal resolution. Nature 512: 400–405. 10.1038/nature13497 - DOI - PMC - PubMed
    1. Becht E, McInnes L, Healy J, Dutertre C-A, Kwok IWH, Ng LG, Ginhoux F, Newell EW. 2019. Dimensionality reduction for visualizing single-cell data using UMAP. Nat Biotechnol 37: 38–44. 10.1038/nbt.4314 - DOI - PubMed

Publication types