

doi: 10.1101/gr.266171.120.
Epub 2021 Apr 22.
Modeling transcriptional regulation of model species with deep learning
Affiliations
- PMID: 33888512
- PMCID: PMC8168591
- DOI: 10.1101/gr.266171.120
Item in Clipboard
Modeling transcriptional regulation of model species with deep learning
Genome Res.
2021 Jun.
Abstract
To enable large-scale analyses of transcription regulation in model species, we developed DeepArk, a set of deep learning models of the cis-regulatory activities for four widely studied species: Caenorhabditis elegans, Danio rerio, Drosophila melanogaster, and Mus musculus DeepArk accurately predicts the presence of thousands of different context-specific regulatory features, including chromatin states, histone marks, and transcription factors. In vivo studies show that DeepArk can predict the regulatory impact of any genomic variant (including rare or not previously observed) and enables the regulatory annotation of understudied model species.
© 2021 Cofer et al.; Published by Cold Spring Harbor Laboratory Press.
Figures
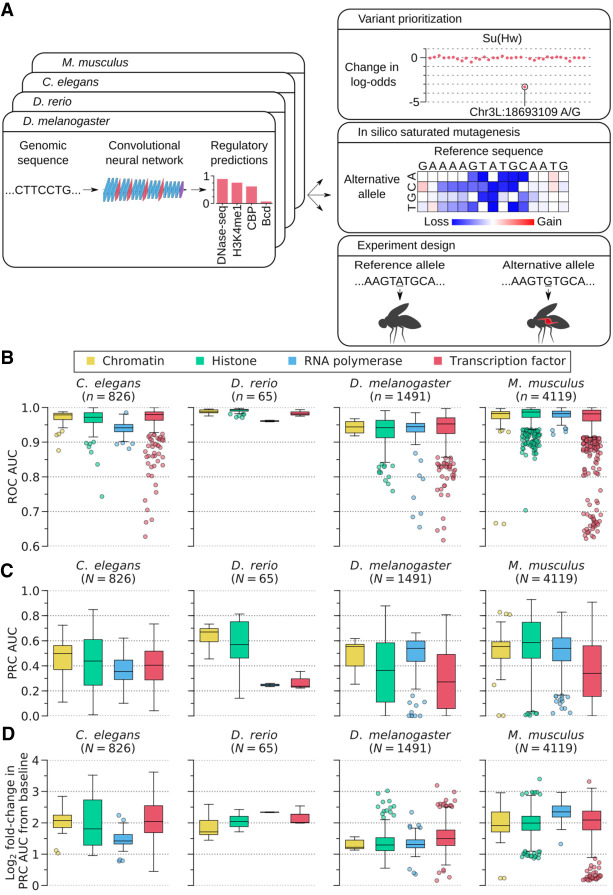
Overview of DeepArk models and their predictive accuracy. (A) The DeepArk architecture (Supplemental Fig. S1 ) uses convolutional layers to scan an input sequence for regulatory motifs and uses maximum pooling layers to perform dimensionality reduction. By using many successive layers, DeepArk is able to extract complex motifs while presumably leveraging interactions between motifs (LeCun et al. 2015; Avsec et al. 2021) and can use a wide sequence context of 4095 bp. Key applications enabled by DeepArk include prioritizing observed genomic variants by their putative regulatory effects (top right), exposing the predictive sequence features for regulatory events through in silico saturated mutagenesis (middle right), and predicting the regulatory effects of novel variants for prospective experiments (bottom right). (B) Performance on test chromosomes from each organism, as quantified by the area under the curve (AUC) of the receiver operating characteristic (ROC) curve (Supplemental Table S1 ). Only regulatory features with at least 50 positive test examples are included. For each box plot, the center line marks the median, and the top and bottom edges of the box mark the first and third quartiles, respectively. The top and bottom whiskers extend to 1.5× the interquartile range (IQR), with data points outside of this range considered outliers and plotted individually. (C) DeepArk's performance on the test chromosomes from each organism, here quantified by the AUC for the precision-recall curve (PRC) (Supplemental Table S1 ). Only regulatory features with at least 50 positive test examples are shown. For each box plot, the center line marks the median, and the top and bottom edges of the box mark the first and third quartiles, respectively. The top and bottom whiskers extend to 1.5× the IQR. Data points outside of this range are considered outliers and plotted individually. (D) Performance on the test chromosomes from each organism in terms of the log2 fold-change in the AUC for the PRC relative to the feature-specific baselines (Supplemental Table S1 ). Only regulatory features with at least 50 positive test examples are shown. For each box plot, the center line marks the median, and the top and bottom edges of the box mark the first and third quartiles, respectively. The top and bottom whiskers extend to 1.5× the IQR. Data points outside of this range are considered as outliers and plotted individually. DeepArk's performance never falls below the baseline.
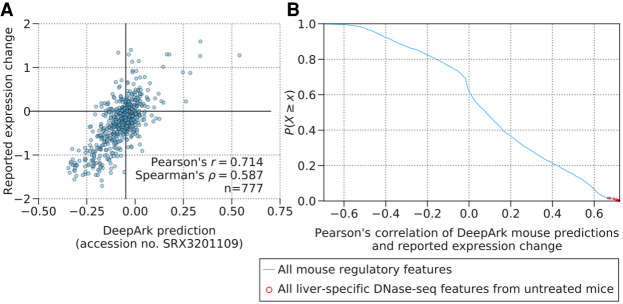
DeepArk's variant effect predictions are well correlated with variant expression effects measured in a massively parallel in vivo reporter assay (MPRA) of enhancer activity. (A) The plot shows DeepArk's predictions for a liver-specific DNase-seq experiment (accession no. SRX3201109) for all possible variants (blue circles) in the ALDOB enhancer (hg19: Chr 9: 104,195,570–104,195,828) and the expression effects measured by the massively parallel reporter assay from Patwardhan et al. (2012), which are significantly correlated (Pearson's r = 0.714, P = 3.58 × 10−122, n = 777 and Spearman's ρ = 0.587, P = 2.91 × 10−73, n = 777). Note that the high degree of correlation with this DeepArk feature and the reported expression change is representative of the high correlation witnessed for liver-specific DNase-seq predictions in general, as shown in the next panel in comparison to other features. (B) The blue line in the plot shows the empirical complementary cumulative distribution function of the Pearson's correlation between the reported expression change in the MPRA of the ALDOB enhancer performed by Patwardhan et al. (2012) and DeepArk's variant effect predictions for each regulatory feature for M. musculus. The red circles correspond to liver-specific DNase-seq experiments from mice under control conditions (accession numbers SRX188645, SRX681492, SRX681493, SRX681494, SRX681495, SRX681496, SRX681497, SRX681498, SRX681499, SRX191053, and SRX3201109). The correlations of these liver-specific DNase-seq features are especially strong (average Pearson's correlation of 0.7046, n = 11 features), which is appropriate because the MPRA in question also measures the effects on expression levels in murine livers.
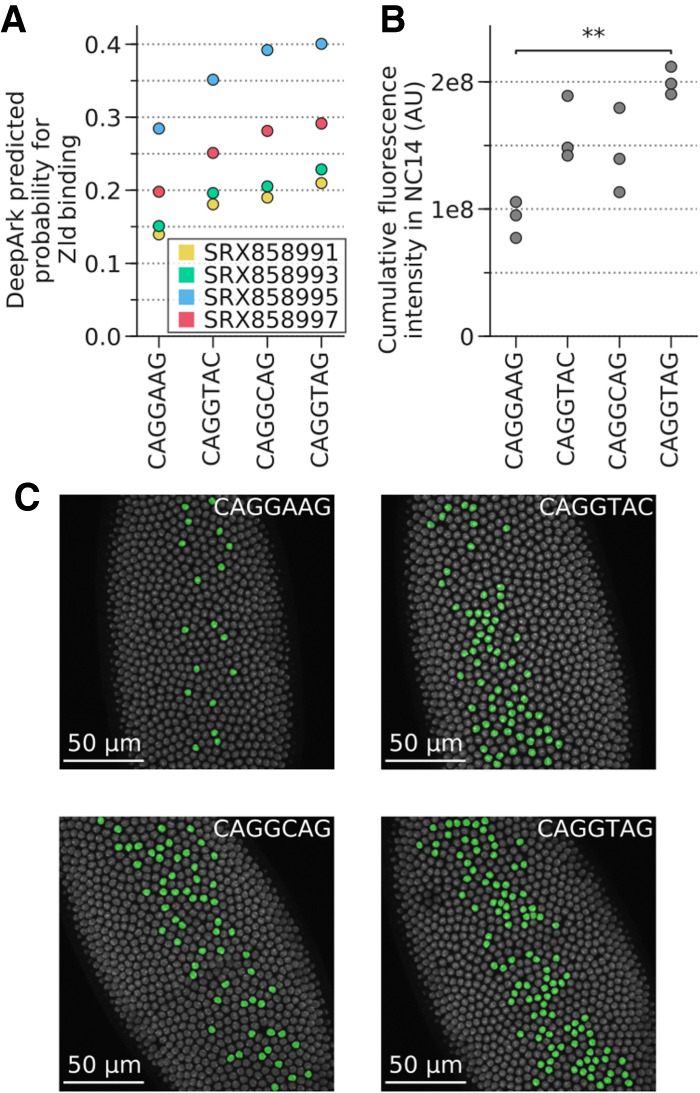
DeepArk's predicted effects for the different T48 mesodermal enhancer variants correlate with in vivo results. (A) Plot of all DeepArk predictions for Zld binding during nuclear cycle 14 for each of the four enhancer alleles. Each point represents a DeepArk prediction for a specific Zld ChIP-seq experiment and a specific allele. The CAGGTAG allele has the highest predicted probability of binding, whereas the reference allele CAGGAAG has the lowest. (B) The total transcriptional output for each of the four alleles, as quantified with in vivo MS2-GFP tagging during nuclear cycle 14. Each point in the graph represents the total transcription output (Methods) of all nuclei in a single embryo. Note that CAGGAAG and CAGGTAG have the lowest and highest transcriptional outputs, respectively, which is consistent with DeepArk's predictions. Bonferroni-corrected two-sided t-test with unequal variances: (**) P = 4.139 × 10⁻³; all others, P > 5 × 10⁻². (C) False-color nuclei with active transcription in Drosophila embryos during minute 20 of nuclear cycle 14 illustrate the distinct levels of transcriptional activation induced by each allele (Supplemental Fig. S6 ). Three replicates were imaged for each allele. (AU) Arbitrary units, which represent the intensity of the pixels that correspond to the fluorescence of the MS2-GFP-tagged foci relative to the background GFP signal (Methods). (NC14) Nuclear cycle 14.
References
Publication types
MeSH terms
Grants and funding
LinkOut - more resources
Full Text Sources
Other Literature Sources
Molecular Biology Databases