. 2021 Apr 22;70(8):1538-1549.
doi: 10.1136/gutjnl-2020-323868. Online ahead of print.

Genome-wide analysis of 944 133 individuals provides insights into the etiology of haemorrhoidal disease

Tenghao Zheng #  1   2 David Ellinghaus #  3   4 Simonas Juzenas #  3   5 François Cossais  6 Greta Burmeister  7 Gabriele Mayr  3 Isabella Friis Jørgensen  4 Maris Teder-Laving  8 Anne Heidi Skogholt  9 Sisi Chen  10 Peter R Strege  10 Go Ito  3   11 Karina Banasik  4 Thomas Becker  12 Frank Bokelmann  13 Søren Brunak  4 Stephan Buch  14 Hartmut Clausnitzer  15 Christian Datz  16 DBDS ConsortiumFrauke Degenhardt  3 Marek Doniec  17 Christian Erikstrup  18 Tõnu Esko  8 Michael Forster  3 Norbert Frey  19   20   21 Lars G Fritsche  22 Maiken Elvestad Gabrielsen  9 Tobias Gräßle  23   24 Andrea Gsur  25 Justus Gross  7 Jochen Hampe  14   26 Alexander Hendricks  7 Sebastian Hinz  7 Kristian Hveem  9 Johannes Jongen  27   28 Ralf Junker  15 Tom Hemming Karlsen  29 Georg Hemmrich-Stanisak  3 Wolfgang Kruis  30 Juozas Kupcinskas  31 Tilman Laubert  27   28   32 Philip C Rosenstiel  3   33 Christoph Röcken  34 Matthias Laudes  35 Fabian H Leendertz  23   24 Wolfgang Lieb  36 Verena Limperger  15 Nikolaos Margetis  37 Kerstin Mätz-Rensing  38 Christopher Georg Németh  12   39 Eivind Ness-Jensen  9   40   41 Ulrike Nowak-Göttl  15 Anita Pandit  22 Ole Birger Pedersen  42 Hans Günter Peleikis  27   28 Kenneth Peuker  14   26 Cristina Leal Rodriguez  4 Malte Christoph Rühlemann  3 Bodo Schniewind  43 Martin Schulzky  3 Jurgita Skieceviciene  31 Jürgen Tepel  44 Laurent Thomas  9   45   46   47 Florian Uellendahl-Werth  3 Henrik Ullum  48 Ilka Vogel  49 Henry Volzke  50 Lorenzo von Fersen  51 Witigo von Schönfels  12 Brett Vanderwerff  22 Julia Wilking  7 Michael Wittig  3 Sebastian Zeissig  14   26 Myrko Zobel  52 Matthew Zawistowski  22 Vladimir Vacic  53 Olga Sazonova  53 Elizabeth S Noblin  53 23andMe Research TeamGianrico Farrugia  10 Arthur Beyder  10 Thilo Wedel  6 Volker Kahlke  27   28   54 Clemens Schafmayer #  7 Mauro D'Amato #  55   2   56   57 Andre Franke #  58   33
Affiliations

Genome-wide analysis of 944 133 individuals provides insights into the etiology of haemorrhoidal disease

Tenghao Zheng et al. Gut. .

Abstract

Objective: Haemorrhoidal disease (HEM) affects a large and silently suffering fraction of the population but its aetiology, including suspected genetic predisposition, is poorly understood. We report the first genome-wide association study (GWAS) meta-analysis to identify genetic risk factors for HEM to date.

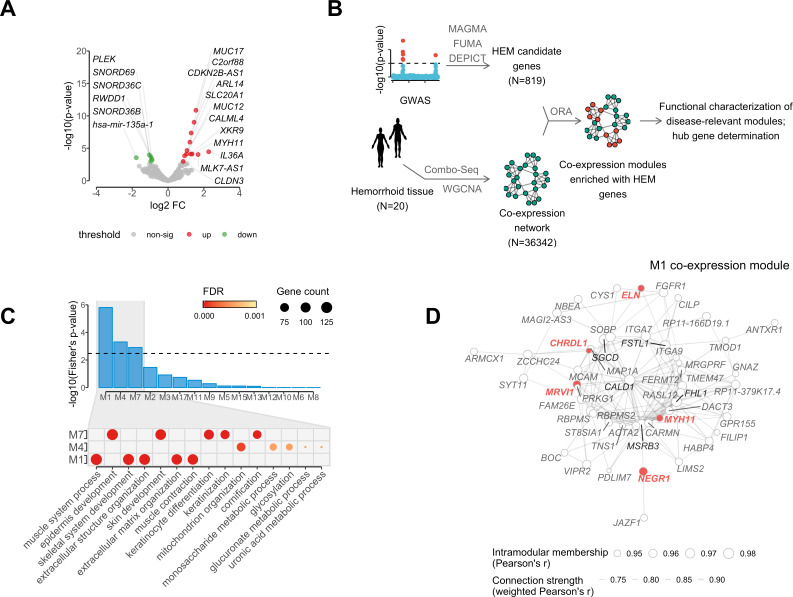
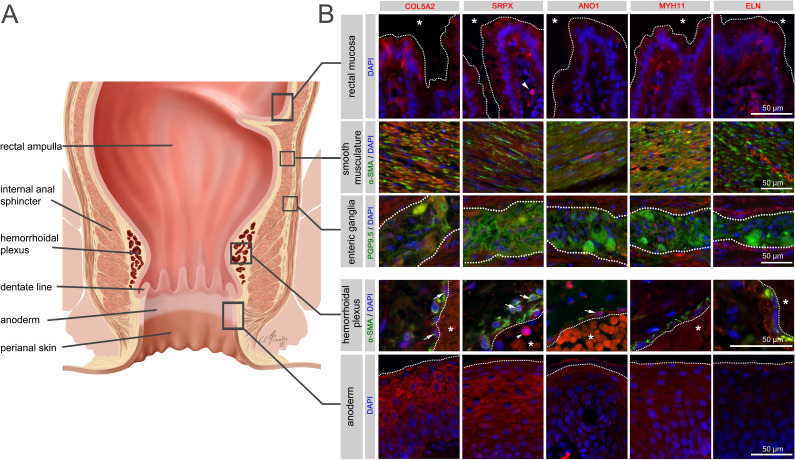
Design: We conducted a GWAS meta-analysis of 218 920 patients with HEM and 725 213 controls of European ancestry. Using GWAS summary statistics, we performed multiple genetic correlation analyses between HEM and other traits as well as calculated HEM polygenic risk scores (PRS) and evaluated their translational potential in independent datasets. Using functional annotation of GWAS results, we identified HEM candidate genes, which differential expression and coexpression in HEM tissues were evaluated employing RNA-seq analyses. The localisation of expressed proteins at selected loci was investigated by immunohistochemistry.

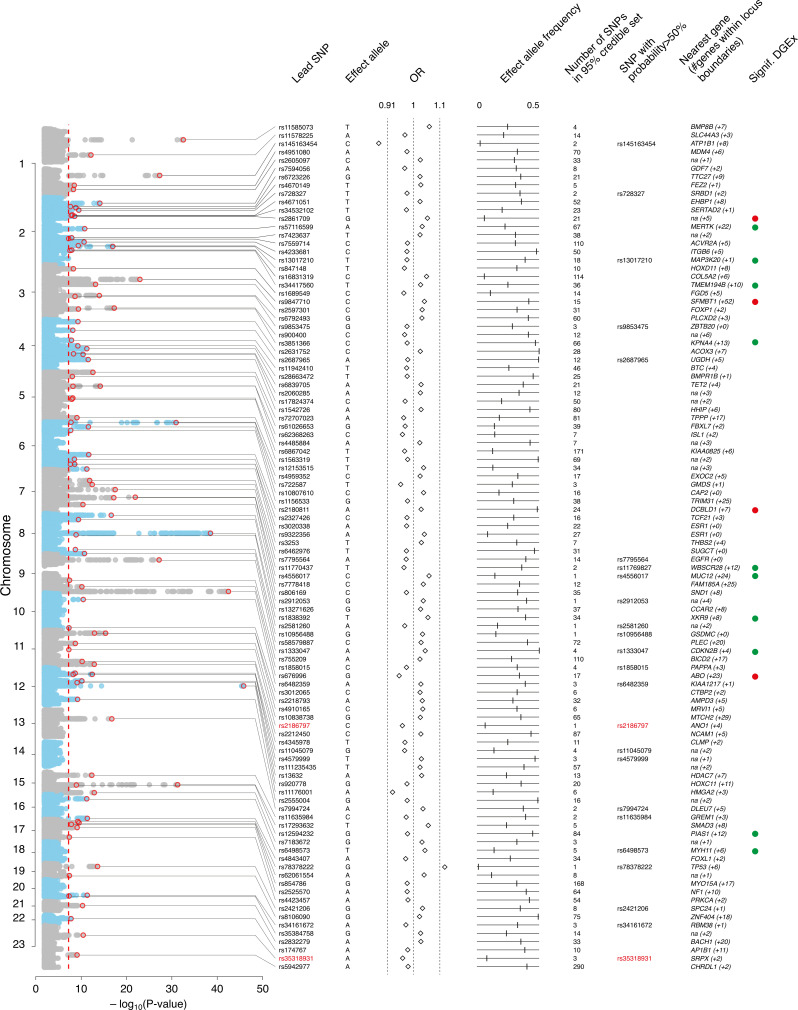
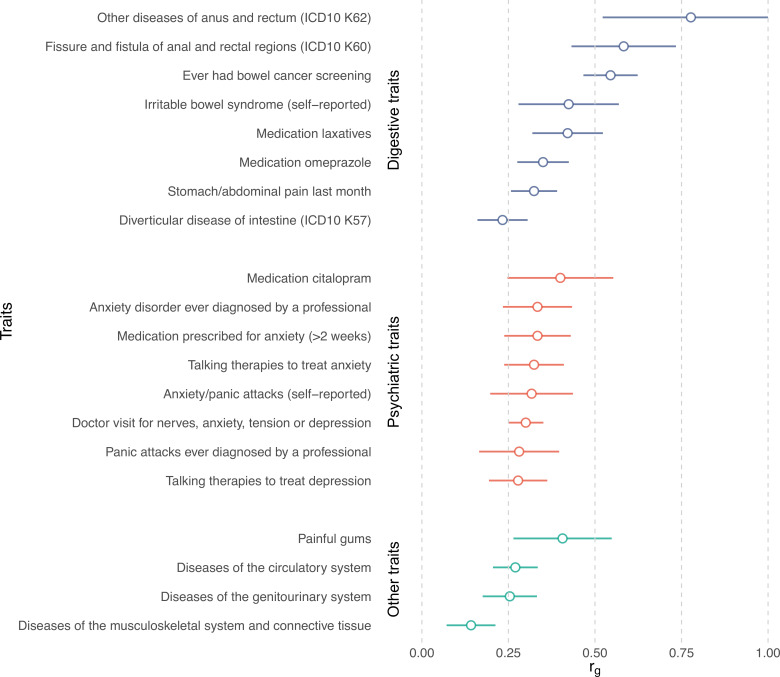
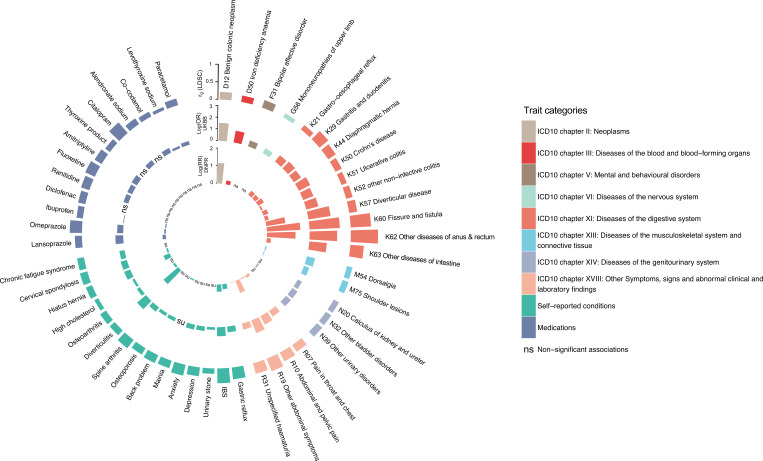
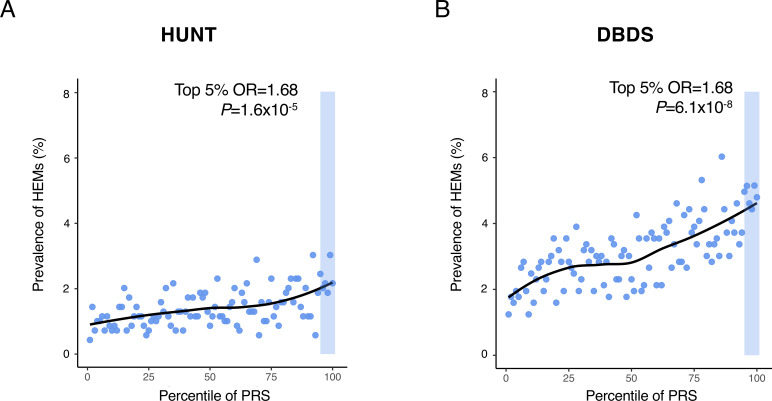
Results: We demonstrate modest heritability and genetic correlation of HEM with several other diseases from the GI, neuroaffective and cardiovascular domains. HEM PRS validated in 180 435 individuals from independent datasets allowed the identification of those at risk and correlated with younger age of onset and recurrent surgery. We identified 102 independent HEM risk loci harbouring genes whose expression is enriched in blood vessels and GI tissues, and in pathways associated with smooth muscles, epithelial and endothelial development and morphogenesis. Network transcriptomic analyses highlighted HEM gene coexpression modules that are relevant to the development and integrity of the musculoskeletal and epidermal systems, and the organisation of the extracellular matrix.

Conclusion: HEM has a genetic component that predisposes to smooth muscle, epithelial and connective tissue dysfunction.

Keywords: anal canal histopathology; anorectal disorders; genetics.


Conflict of interest statement

Competing interests: Vladimir Vacic and Olga V. Sazonova are/were employed by and hold stock or stock options in 23andMe, Inc. All other authors have nothing to declare.

Figures

Figure 1
Figure 1
Annotation of 102 haemorrhoidal disease (HEM) genome-wide association study (GWAS) risk loci. From left to right: Manhattan plot of GWAS meta-analysis results, (genome-wide significance level—P Meta <5×10⁻⁸—indicated with vertical dotted red line); Lead single nucleotide polymorphism (SNP)—marker associated with the strongest association signal from each locus (also annotated with a red circle in the Manhattan plot); Effect allele—allele associated with reported genetic risk effects (OR), also always the minor allele; OR with respect to the effect allele; Effect allele frequency—frequency of the effect allele in the discovery dataset; Number of SNPs in 95% credible set—the minimum set of variants from Bayesian fine-mapping analysis that is >95% likely to contain the causal variant; SNP with probability >50%—single variant (if detected) with >50% probability of being causal (coding SNPs highlighted in red); Nearest gene (#genes within locus boundaries)—gene closest to the lead SNP (if within 100 kb distance, otherwise ‘na’) and number of additional genes positionally mapped to the locus using FUMA (online supplemental table 2 and online methods). Signif. DGEx—locus containing HEM genes differentially expressed in RNA Combo-Seq analysis of HEM affected tissue, detected at higher (green) and/or lower (red) level of expression (see online methods).
Figure 2
Figure 2
Genetic correlation between haemorrhoidal disease and other traits estimated by linkage disequilibrium score regression analysis. Genetic correlations (r g +se) are shown for selected traits, grouped by domain. Only correlations significant after Bonferroni correction were considered (full list available in online supplemental table 6). ICD, International Classification of Diseases.
Figure 3
Figure 3
Analysis of haemorrhoidal disease (HEM) genetically correlated traits in UK Biobank (UKBB) and the Danish National Patient Registry (DNPR). Traits and conditions identified in linkage disequilibrium score regression analyses of genetic correlation with HEM (outer ring in the circos plot, see also figure 2 and online supplemental table 6) were studied for their differential prevalence in UKBB and DNPR, based on data extracted from participants’ healthcare records. Significant results are reported, respectively, as ORs (log(OR), UKBB, middle ring) and relative risk (log(RR), DNPR, inner ring) or ‘ns’ (for non-significant findings). Diseases and traits are categorised according to ICD10 diagnostic codes or self-reported conditions and use of medications from questionnaire data (see online methods). Self-reported traits in UKBB (dark blue colour) were manually mapped to ICD10-codes in DNPR.
Figure 4
Figure 4
Risk haemorrhoidal disease (HEM) prevalence across polygenic risk score (PRS) percentile distributions. PRS was derived from the results of the association meta-analysis (see online methods). HEM prevalence (%, Y-axis) is reported on a scatter plot in relation to PRS percentile distribution (X-axis) in the Norwegian Trøndelag Health Study (HUNT) (A) and the Danish Blood Donor Study (DBDS) (B) population cohorts. The top 5% of the distribution is highlighted with a shaded area in both cohorts, and the results of testing HEM prevalence in this group versus the rest of the population are also reported (p value and OR from logistic regression; online methods).
Figure 5
Figure 5
Analysis of mRNA and microRNA (Combo-Seq) data from haemorrhoidal disease (HEM) affected tissue, in relation to HEM genes coexpression networks. (A) Volcano plot reporting HEM genes differentially expressed in haemorrhoidal tissue (significantly upregulated=red, and downregulated=green); (B) schematic representation of the analytical flow for HEM genes coexpression network module identification and characterisation; (C) upper panel (barplot): overrepresentation analysis of HEM genes in coexpression network modules, with significant enrichment (P FDR <0.05) in modules M1, M4 and M7; lower panel (dotplot): top five gene ontology terms (biological process) from gene set enrichment analysis relative to M1, M4 and M7 coexpression modules (gene counts and false discovery rate (FDR)-adjusted significance level are also reported as indicated); (D) coexpression hub network of module M1. The network represents strength of connections (weighted Pearson’s correlation >0.7) among the top 50 hub genes with highest values of intramodular membership (size of the node). HEM genes and the top 5 hub genes are highlighted in red and black, respectively.
Figure 6
Figure 6
Immunohistochemistry for selected haemorrhoidal disease (HEM) candidate proteins. Illustration of the rectum and anal canal (A) indicating the site-specific localisation of the immunohistochemical panels analysed in (B). Results of fluorescence immunohistochemistry are shown for selected HEM candidate proteins encoded by HEM genes COL5A2 (rs16831319), SRPX (rs35318931), ANO1 (rs2186797), MYH11 (rs6498573) and ELN (rs11770437) (see also online supplemental table 11 and online supplemental figure 13). Antibody staining was performed on FFPE colorectal tissue specimens from control individuals. Picture layers correspond to the rectal mucosa (top row, epithelial surface delimited by a white dotted line, *=intestinal lumen), smooth musculature (second row), enteric ganglia (third row, ganglionic boundaries delimited by a white dotted line), haemorrhoidal plexus (fourth row, endothelial surface delimited by a white dotted line, *=vascular lumen) and the anoderm (bottom row, surface of the anoderm delimited by a white dotted line). Blue: DAPI; green: α-SMA (anti-alpha smooth muscle actin antibody) for rows 2 and 4 (smooth musculature/haemorrhoidal plexus) and PGP9.5 (member of the ubiquitin hydrolase family of proteins, neuronal marker) for row 3 (enteric ganglia); red: antibody for the respective candidate protein. Arrows point to respective candidate-positive cells within the vascular wall. Arrowheads point to respective candidate-positive nucleated immune cells.

Comment in

References

    1. Jacobs D. Clinical practice. Hemorrhoids. N Engl J Med 2014;371:944–51. - PubMed
    1. Duthie HL, Gairns FW. Sensory nerve-endings and sensation in the anal region of man. Br J Surg 1960;47:585–95. 10.1002/bjs.18004720602 - DOI - PubMed
    1. Haas PA. Haas GP, Schmaltz S, Fox TA, Jr. The prevalence of hemorrhoids. Dis Colon Rectum 1983;26:435-9. - PubMed
    1. Yang JY, Peery AF, Lund JL, et al. . Burden and cost of outpatient hemorrhoids in the United States Employer-Insured population, 2014. Am J Gastroenterol 2019;114:798–803. 10.14309/ajg.0000000000000143 - DOI - PMC - PubMed
    1. Margetis N. Pathophysiology of internal hemorrhoids. Ann Gastroenterol 2019;32:264–72. 10.20524/aog.2019.0355 - DOI - PMC - PubMed