. 2021 Apr 27;118(17):e2003596118.
doi: 10.1073/pnas.2003596118.

Fast skeletal myosin-binding protein-C regulates fast skeletal muscle contraction

Affiliations

Fast skeletal myosin-binding protein-C regulates fast skeletal muscle contraction

Taejeong Song et al. Proc Natl Acad Sci U S A. .

Abstract

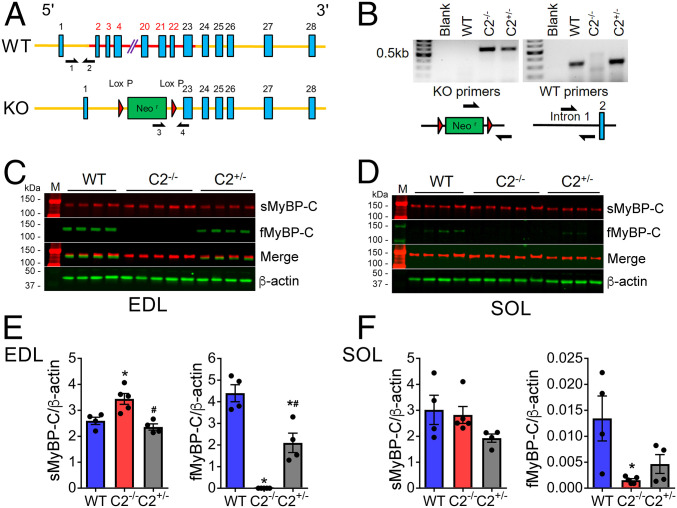
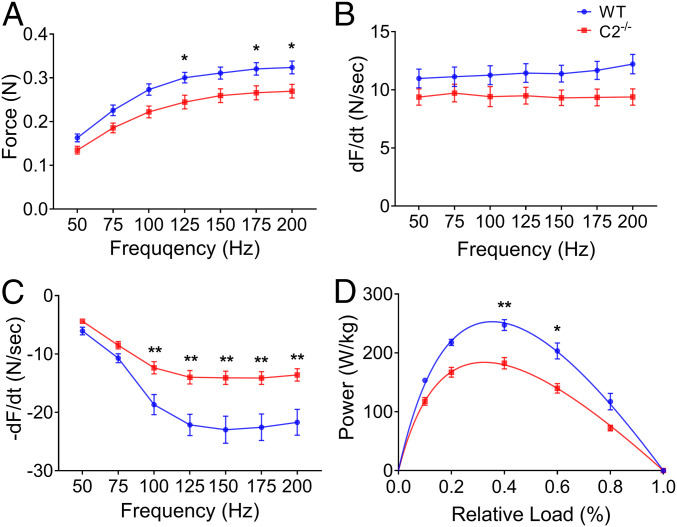
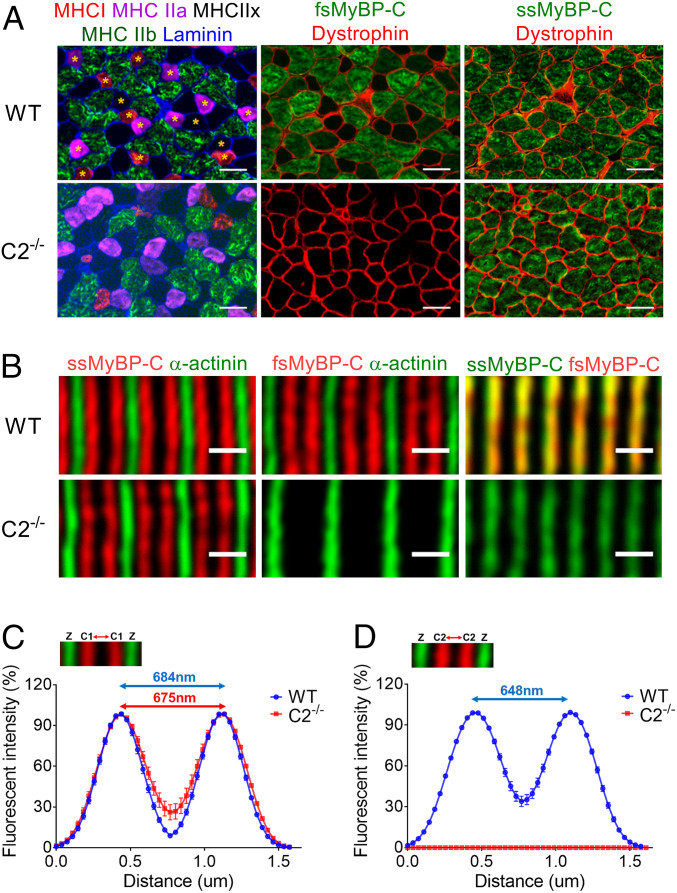
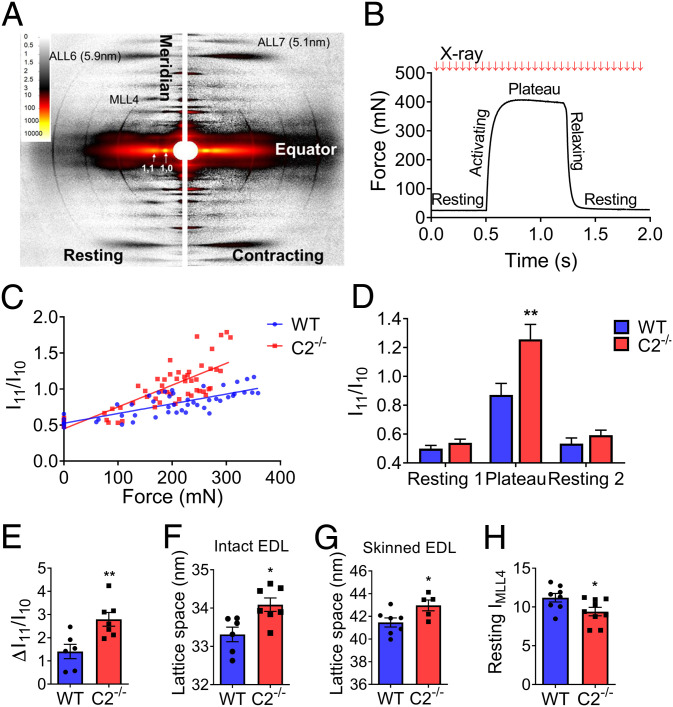
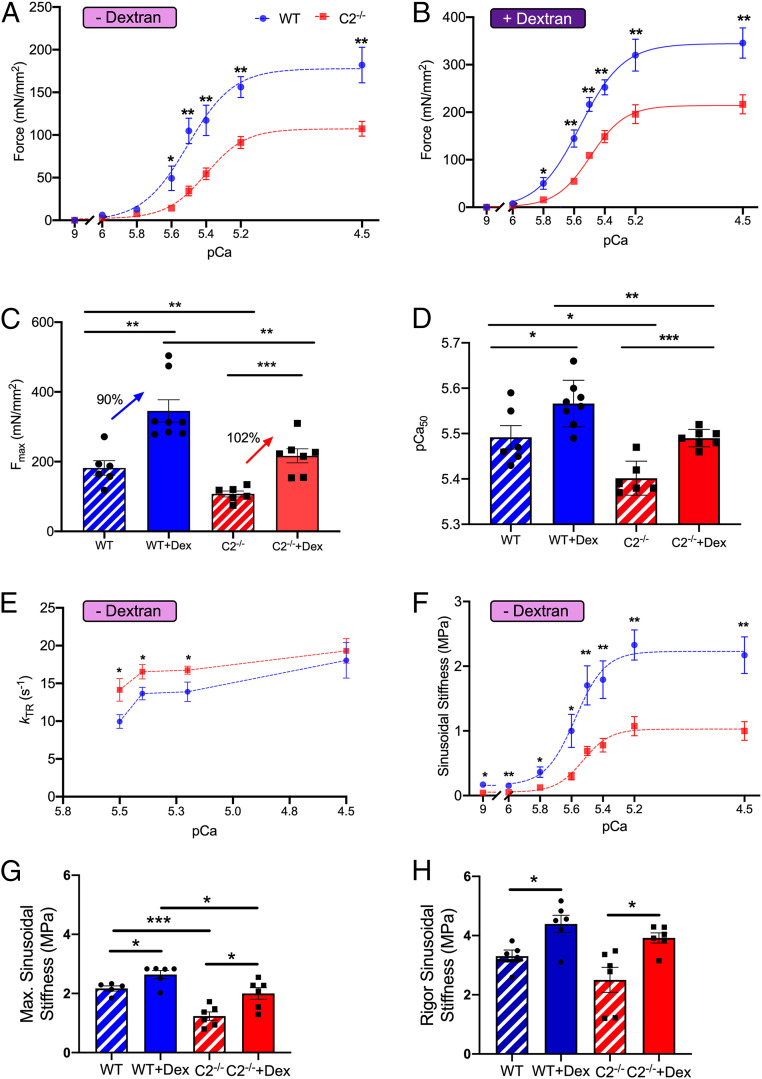
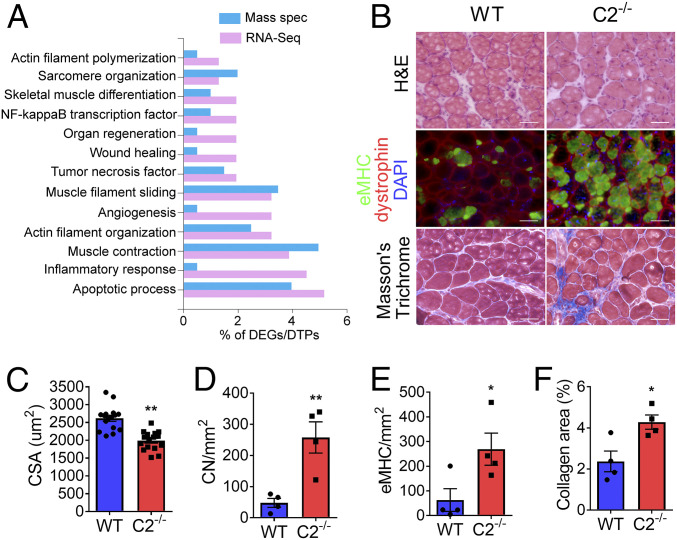
Fast skeletal myosin-binding protein-C (fMyBP-C) is one of three MyBP-C paralogs and is predominantly expressed in fast skeletal muscle. Mutations in the gene that encodes fMyBP-C, MYBPC2, are associated with distal arthrogryposis, while loss of fMyBP-C protein is associated with diseased muscle. However, the functional and structural roles of fMyBP-C in skeletal muscle remain unclear. To address this gap, we generated a homozygous fMyBP-C knockout mouse (C2-/-) and characterized it both in vivo and in vitro compared to wild-type mice. Ablation of fMyBP-C was benign in terms of muscle weight, fiber type, cross-sectional area, and sarcomere ultrastructure. However, grip strength and plantar flexor muscle strength were significantly decreased in C2-/- mice. Peak isometric tetanic force and isotonic speed of contraction were significantly reduced in isolated extensor digitorum longus (EDL) from C2-/- mice. Small-angle X-ray diffraction of C2-/- EDL muscle showed significantly increased equatorial intensity ratio during contraction, indicating a greater shift of myosin heads toward actin, while MLL4 layer line intensity was decreased at rest, indicating less ordered myosin heads. Interfilament lattice spacing increased significantly in C2-/- EDL muscle. Consistent with these findings, we observed a significant reduction of steady-state isometric force during Ca2+-activation, decreased myofilament calcium sensitivity, and sinusoidal stiffness in skinned EDL muscle fibers from C2-/- mice. Finally, C2-/- muscles displayed disruption of inflammatory and regenerative pathways, along with increased muscle damage upon mechanical overload. Together, our data suggest that fMyBP-C is essential for maximal speed and force of contraction, sarcomere integrity, and calcium sensitivity in fast-twitch muscle.

Keywords: MYBPC2; contraction; distal arthrogryposis; fMyBP-C; skeletal muscle.


Conflict of interest statement

Competing interest statement: S.S. provided consulting and collaborative research studies to the Leducq Foundation, Red Saree Inc., Greater Cincinnati Tamil Sangam, AstraZeneca, MyoKardia, Merck, and Amgen, but such work is unrelated to the content of this manuscript.

Figures

Fig. 1.
Fig. 1.
fMyBP-C KO increases the level of sMyBP-C expression in C2−/− muscles. (A) Schematic illustration of Mybpc2 gene KO in mouse chromosome 7. (B) Genotype of WT, homozygous (C2−/−), and heterozygous (C2+/−) mice was determined by PCR to detect KO and WT alleles. Protein expression of sMyBP-C and fMyBP-C was measured in (C) EDL and (D) SOL muscles of WT, C2−/−, and C2+/− mice by Western blot. A molecular weight marker labeled M was loaded on both sides of the gel. The quantification of protein expression of sMyBP-C and fMyBP-C in (E) EDL and (F) SOL of WT, C2−/−, and C2+/− mice (n = 4 to 5 in each group). Error bars represent ± SEM, *P < 0.05 to WT and #P < 0.05 to C2−/−. Statistical analyses were performed in all groups by ordinary one-way ANOVA followed by Tukey’s multiple comparison test.
Fig. 2.
Fig. 2.
Force–frequency relationship and isotonic power generation of WT and C2−/− EDL muscles. (A) Escalated isometric tetanic force generation over increasing electrical frequency (50 to 200 Hz at 50 mA). Rates of (B) force development and (C) relaxation are depicted at given frequency. (D) Power generation of EDL muscle during isotonic muscle contraction at specific relative force (n = 5 to 9 in each group). Error bars represent ± SEM and *P < 0.05 and **P < 0.01 versus WT. Statistical analyses were performed in all groups by unpaired t test or ordinary two-way ANOVA followed by Bonferroni’s multiple comparison test.
Fig. 3.
Fig. 3.
Localization and spatial distribution of skeletal MyBP-C paralogs in EDL muscles. (A) Muscle fiber types were determined by expression of different MHC isoforms (Left). Global and equivalent protein expression of sMyBP-C in all WT and C2−/− fibers (Right). fMyBP-C protein was detected in large-sized fibers and colocalized with type IIb and some type IIx in WT (Top, Middle). Asterisks indicate fibers not expressing fMyBP-C. No type I or IIa fibers were colocalized with fMyBP-C (Top, Left). EDL muscles were serially sectioned at 10 µm thickness and stained with designated antibodies. (Scale bar: 50 µm.) (B) Skinned EDL fibers from WT and C2−/− were immmunostained with sMyBP-C, fMyBP-C, and α-actinin. A doublet pattern of sMyBP-C (red) between two Z-lines stained with α-actinin (green) (Left). fMyBP-C (red) was also detected in the same location and pattern as sMyBP-C in WT, but it was completely missing in C2−/− (Middle). (Scale bar: 1 µm.) The relative fluorescence signal of sMyBP-C and fMyBP-C, along with α-actinin, in skinned EDL fiber was measured from the images taken under high magnification (63×). The distribution of (C) sMyBP-C and (D) fMyBP-C fluorescence intensity was depicted in the graph. Two to three images were captured from one fiber, and two to three fibers were chosen from each mouse (n = 3). These values were the averaged distance between two peaks (SI Appendix, Fig. S5).
Fig. 4.
Fig. 4.
Increased sarcomere lattice spacing and disorganized myosin movement in C2−/− EDL intact muscles and skinned fibers. (A, Left) X-ray diffraction pattern of EDL muscle at rest (Right) and during contraction. Equatorial reflections (I11 and I10) and layer line patterns (MLL4, ALL6, and ALL7) are as indicated. (B) Force as a function of time during maximally activated isometric tetanus of EDL muscle. X-ray exposures (10 ms) were taken every 20 ms during isometric contraction. (C) Linear relationship of the ratio of I11 to I10 (I11/I10) to force development. Slope of I11/I10, as a function of force, is steeper in C2−/−. (D) Average I11/I10 during rest and maximal contraction. X-axis indicates resting (1 and 2) and plateau periods during the contraction as shown in Fig. 4B. (E) Change in I11/I10 relative to rest during isometric muscle contraction. (F) Calculated lattice spacings in intact EDL muscle at optimal muscle length (Lo) (G) and skinned EDL fibers at sarcomere length 2.2 µm. (H) Intensity of MLL4 in resting EDL muscle (n = 6 to 9 in each group). Error bars represent ± SEM, *P < 0.05 and **P < 0.01. Statistical analyses were performed in all groups by unpaired t test or ordinary two-way ANOVA followed by Bonferroni’s multiple comparison test.
Fig. 5.
Fig. 5.
Reduced maximal isometric force, calcium sensitivity of steady-state muscle activation, and sinusoidal stiffness in fast-twitch fiber of C2−/− EDL skinned fibers. (A) Force–pCa curve of skinned single EDL fiber in pCa 9.0 to 4.5 at 2.3 µm sarcomere length. (B) Increased steady-state isometric force generation after 3% dextran treatment in both WT and C2−/− muscle fiber. (C) Maximum isometric force at pCa 4.5 with or without dextran treatment. The increase of isometric maximal force in C2−/− fiber in dextran versus nondextran was 12% higher than that of WT in dextran versus nondextran. (D) Significantly decreased myofilament calcium sensitivity of contraction (pCa50) in C2−/− fiber with and without dextran treatment. (E) kTR in submaximum calcium concentrations (pCa 5.5 and 5.4) increased in C2−/−(n = 6 in each group) and (F) reduced sinusoidal stiffness of C2−/− fiber in all calcium concentrations (pCa 9.0 to 4.5). (G) Maximum sinusoidal stiffness at pCa 4.5 increased more in C2−/− (+62%) compared to WT (+22%) after dextran (3%) treatment (WT, n = 5 to 6 and C2−/−, n = 6). (H) Complete deletion of fMyBP-C protein has no effect on sinusoidal stiffness during rigor in EDL muscle. (AF) WT, n = 6; WT + Dex, n = 8; C2−/−, n = 6; and C2−/− + Dex, n = 7. (H) WT, n = 5; WT + Dex, n = 6; C2−/−, n = 6; and C2−/− + Dex, n = 6. Error bars represent ± SEM, *P < 0.05, **P < 0.01, and ***P < 0.001. NS, nonsignificant. Statistical analyses were performed in WT and C2−/− by unpaired Student’s t test in each condition.
Fig. 6.
Fig. 6.
Severe muscle damage in C2−/− after chronic mechanical overloading. (A) Bar plot showing specific gene ontology biological process and associated percentage of DEGs [cutoff: log2 fold change > 2; P < 0.05] and differentially translated proteins (P < 0.05) from RNA-seq and mass spectrometry, respectively, generated using the FunRich 3.1.3 tool. (B) Representative images of cross-sectioned PLN muscles at 14 d after synergistic muscle ablation-induced overloading. (Top) Samples were stained with hematoxylin and eosin and (Bottom) Masson’s trichrome or (Middle) immunostained with antibodies against eMHC (green), dystrophin (red), and DAPI (blue). (C) Smaller cross-sectional area (CSA) of PLN muscle in C2−/−. Average CSA of PLN muscle fiber was measured in four areas per muscle (n = 4 PLN per group). (D) Average number of CN- and (E) eMHC-positive fibers as well as (F) the fibrotic tissue area in PLN was increased in C2−/− after overloading. Three to four different areas in each section were examined and averaged in each muscle (n = 4 PLN per group). (Scale bar: 50 μm.) *P < 0.05 and **P < 0.01. Statistical analyses were performed in all groups by unpaired t test.

References

    1. Starr R., Offer G., Polypeptide chains of intermediate molecular weight in myosin preparations. FEBS Lett. 15, 40–44 (1971). - PubMed
    1. Gautel M., Fürst D. O., Cocco A., Schiaffino S., Isoform transitions of the myosin binding protein C family in developing human and mouse muscles: Lack of isoform transcomplementation in cardiac muscle. Circ. Res. 82, 124–129 (1998). - PubMed
    1. Luther P. K., et al. ., Understanding the organisation and role of myosin binding protein C in normal striated muscle by comparison with MyBP-C knockout cardiac muscle. J. Mol. Biol. 384, 60–72 (2008). - PMC - PubMed
    1. Flashman E., Redwood C., Moolman-Smook J., Watkins H., Cardiac myosin binding protein C: Its role in physiology and disease. Circ. Res. 94, 1279–1289 (2004). - PubMed
    1. McConnell B. K., et al. ., Dilated cardiomyopathy in homozygous myosin-binding protein-C mutant mice. J. Clin. Invest. 104, 1235–1244 (1999).Corrected in: J. Clin. Invest.104, 1771 (1999). - PMC - PubMed

Publication types