. 2021 Apr 27;118(17):e2012894118.
doi: 10.1073/pnas.2012894118.

Thermosensitive TRPV4 channels mediate temperature-dependent microglia movement

Affiliations

Thermosensitive TRPV4 channels mediate temperature-dependent microglia movement

Rei Nishimoto et al. Proc Natl Acad Sci U S A. .

Abstract

Microglia maintain central nervous system homeostasis by monitoring changes in their environment (resting state) and by taking protective actions to equilibrate such changes (activated state). These surveillance and protective roles both require constant movement of microglia. Interestingly, induced hypothermia can reduce microglia migration caused by ischemia, suggesting that microglia movement can be modulated by temperature. Although several ion channels and transporters are known to support microglia movement, the precise molecular mechanism that regulates temperature-dependent movement of microglia remains unclear. Some members of the transient receptor potential (TRP) channel superfamily exhibit thermosensitivity and thus are strong candidates for mediation of this phenomenon. Here, we demonstrate that mouse microglia exhibit temperature-dependent movement in vitro and in vivo that is mediated by TRPV4 channels within the physiological range of body temperature. Our findings may provide a basis for future research into the potential clinical application of temperature regulation to preserve cell function via manipulation of ion channel activity.

Keywords: TRP channels; TRPV4; microglia; movement.


Conflict of interest statement

The authors declare no competing interest.

Figures
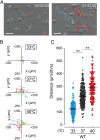
Fig. 1.
Fig. 1.
Microglia exhibit temperature-dependent motility in vitro. (A) Representative images at 37 °C from time-lapse imaging (Movie S1). Images taken at time 0 and 1 h 57 min are shown on the left and right, respectively. Filled colored circles indicate x,y coordinates of a representative target and colored lines indicate trajectory. The trajectories were superimposed on the images using the ImageJ Manual tracking plugin. (Scale bar represents 50 μm.) (B) Trajectories of 10 representative microglia over 2 h at 33 °C, 37 °C, and 40 °C. Paths are arranged to show origins at x = y = 0. Each line indicates the trajectory of one cell. (C) Temperature-dependent changes in distance traveled by primary mouse microglia at 33 °C (n = 137), 37 °C (n = 181), and 40 °C (n = 171). Filled circles indicate migration distance of each microglia over 2 h. Horizontal lines indicate mean ± SEM **P < 0.01 (one-way ANOVA followed by post hoc Bonferroni tests for multiple comparisons).
Fig. 2.
Fig. 2.
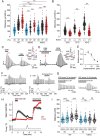
TRPM2, TRPM4, and TRPV4 channels are functionally expressed in microglia. (A) Expression patterns of eight thermosensitive TRP channel genes in WT microglia and two controls (Gapdh and Cd11b, a microglia marker). C indicates amplified fragments using each cDNA as a template. (B) Mean calcium imaging traces in primary microglia from WT (black, n = 36) and TRPV4KO (red, n = 27) mice. Data are represented as mean ± SEM. GSK indicates treatment with the TRPV4 activator GSK-1016790A (500 nM). Ionomycin (5 μM) was applied to assess cell viability. (C) Representative whole-cell current traces of GSK-1016790A (GSK, 500 nM)–evoked responses in WT microglia (Top, n = 7 cells) and TRPV4KO microglia (Bottom, n = 6 cells) with ramp pulses from −100 mV to 100 mV every 5 s; Vm = −60 mV. Inset shows IV relationship at the arrowhead. (D) Representative whole-cell current traces of ADP ribose (500 μM)–evoked responses in WT microglia (Top, and n = 3 cells) and TRPM2 KO microglia (Bottom, n = 3 cells) with ramp pulses from −100 mV to 100 mV delivered every 3 s; Vm = −60 mV. Inset shows IV relationship at the arrowhead. (E and F) Representative whole-cell traces of heat-evoked currents in WT microglia in the absence (E) or presence (F) of 9-phenanthrol (Upper, 100 μM) with ramp pulses from −100 mV to 100 mV delivered every 5 s. Lower trace indicates temperature transition. Vm = −70 mV. Inset shows IV relationships at the corresponding letters.
Fig. 3.
Fig. 3.
Genetic elimination of Trpm2 or Trpm4 and 9-phenanthrol, a TRPM4 inhibitor, affects temperature-dependent microglia movement. (A) Average distances of migrating microglia isolated from WT, M2KO, or V4KO mice exposed to 33 °C (M2KO, n = 128; V4KO, n = 236), 37 °C (M2KO, n = 99; V4KO, n = 262), or 40 °C (M2KO, n = 102; V4KO, n = 217). WT data are shown in Fig. 1C. Filled circles indicate migration distance for each microglia cell over 2 h. Horizontal lines indicate mean ± SEM. At 33 °C, 37 °C, and 40 °C, M2KO microglia moved 115.0 ± 4.2 μm, 177.7 ± 7.9 μm, and 215.4 ± 7.2 μm, respectively, whereas V4KO microglia moved 118.6 ± 3.8 μm, 186.4 ± 4.6 μm, and 196.8 ± 5.9 μm at those respective temperatures. **P < 0.01 (two-way ANOVA followed by post hoc Bonferroni tests for multiple comparisons). (B) Inhibition of temperature-dependent microglia movement by 9-phenanthrol (30 μM) at 33 °C (n = 212), 37 °C (n = 124), and 40 °C (n = 187). (−) indicates the control distance before application of 9-phenanthrol at each temperature condition. Filled circles indicate migration distance for each microglia cell over 2 h. Horizontal lines indicate mean ± SEM. Mean values are 99.5 ± 2.8 μm, 144.7 ± 5.1 μm, and 220.0 ± 6.0 μm versus 52.5 ± 1.7 μm, 56.6 ± 2.5 μm, and 79.6 ± 3.4 μm in the presence and absence of 9-phenanthrol at 33 °C, 37 °C, and 40 °C, respectively. **P < 0.01 (two-way ANOVA followed by post hoc Bonferroni tests for multiple comparisons). (C and D) Representative whole-cell trace of GSK (100 nM)-induced currents in absence and presence of 9-phenanthrol (30 μM) inhibitor upon ramp pulses from −100 mV to 100 mV in a HEK293T cell expressing mouse TRPV4; (Inset) Ramp-pulse responses at A, B, and C are shown as an IV relationship. Vm = −60 mV. (E) Concentration-dependent inhibition of TRPV4 currents by 9-phenanthrol. The maximum GSK (100 nM)-induced inward current in the presence of 9-phenanthrol was normalized to currents observed in the presence of 1 μM 9-phenanthrol. The results were fitted with a logistic curve (n = 6 to 8). Data are represented as mean ± SEM. (F) Representative whole-cell traces of heat-evoked currents in a HEK293T cell expressing mouse TRPV4 without (left) and with 9-phenanthrol (right, 30 μM) treatment. n = 3 for each. Vm = −60 mV. (G) Dose-dependent inhibition of ADP ribose (10 μM)–induced current by 1 μM (left) and 30 µM (right) 9-phenanthrol in a HEK293T cell expressing mouse TRPM2. Vm = −60 mV. (H) Calcium imaging traces in primary microglia from WT (black, n = 30) or V4KO (red, n = 30) mice. Data are represented as mean ± SEM. GSK indicates treatment with the TRPV4 activator GSK-1016790A (500 nM). Ionomycin (5 μM) was applied to assess cell viability. Bottom trace shows the heat stimulation. (I) Distances of migrating microglia isolated from WT or V4KO mice exposed to DMSO (1/1000) or GSK (500 nM) at 33 °C (WT, n = 156 for DMSO and n = 155 for GSK; V4KO, n = 151 for DMSO and n = 150 for GSK) or 37 °C (WT, n = 154 for DMSO and n = 151 for GSK; V4KO, n = 145 for DMSO and n = 150 for GSK). Filled circles indicate migration distance for each microglia cell over 1 h. Horizontal lines indicate mean ± SEM ***P < 0.001 (two-way ANOVA followed by post hoc Bonferroni comparison).
Fig. 4.
Fig. 4.
TRPV4-deficient microglia lose temperature-dependent process movement in vivo. (A) Experimental protocol for in vivo time-lapse imaging. Saline or LPS (1 mg/kg) was injected intraperitoneally 2 h prior to recordings. (B) Analysis of cell body displacement of WT microglia in the absence (saline injection) or presence of LPS. WT saline at 37 °C (first, n = 125 cells), 32 °C (n = 121), and 37 °C (second, n = 113) from three mice; WT LPS at 37 °C (first, n = 178 cells), 32 °C (n = 133), and 37 °C (second, n = 139) from three mice. Data are represented as mean ± SEM. ns, not significant (two-way ANOVA followed by post hoc Bonferroni tests for multiple comparisons). (C) Analysis of WT microglia process movement in the presence or absence (saline injection) of LPS. WT saline at 37 °C (first, n = 63 processes), 32 °C (n = 28), and 37 °C (second, n = 41) from three mice; WT LPS at 37 °C (first, n = 67 processes), 32 °C (n = 72), and 37 °C (second, n = 70) from three mice. Data are represented as mean ± SEM *P < 0.05, **P < 0.01, and ***P < 0.001 (two-way ANOVA followed by post hoc Bonferroni tests for multiple comparisons). (D) Comparison of movement of microglia processes from WT or V4KO mice in the absence (saline injection) or presence of LPS. WT saline at 37 °C (first, n = 63 processes), 32 °C (n = 28), and 37 °C (second, n = 41) from three mice; WT LPS at 37 °C (first, n = 67 processes), 32 °C (n = 72), and 37 °C (second, n = 70) from three mice; V4KO saline at 37 °C (first, n = 46 processes), 32 °C (n = 46), and 37 °C (second, n = 46) from three mice; V4KO LPS at 37 °C (first, n = 79 processes), 32 °C (n = 75), and 37 °C (second, n = 59) from three mice. Data are represented as mean ± SEM **P < 0.01, ***P < 0.001 (two-way ANOVA followed by post hoc Bonferroni tests for multiple comparisons). (E) Comparison of total process length of microglia from WT or V4KO mice in the absence (saline) or presence of LPS at 37 °C. WT saline (n = 52 cells) from four mice; WT LPS (n = 64 cells) from five mice; V4KO saline (n = 35 cells) from three mice; and V4KO LPS (n = 109 cells) from seven mice. Data are represented as mean ± SEM, **P < 0.01 (two-way ANOVA followed by post hoc Bonferroni tests for multiple comparisons). (F) Comparison of the number of branches per microglia cell from WT or V4KO mice in the absence (saline) or presence of LPS at 37 °C. WT saline (n = 52 cells) from four mice; WT LPS (n = 64 cells) from five mice; V4KO saline (n = 35 cells) from three mice; and V4KO LPS (n = 109 cells) from seven mice. Data are represented as mean ± SEM, *P < 0.05, **P < 0.01 (two-way ANOVA followed by post hoc Bonferroni tests for multiple comparisons).

References

    1. Nimmerjahn A., Kirchhoff F., Helmchen F., Resting microglial cells are highly dynamic surveillants of brain parenchyma in vivo. Science 308, 1314–1318 (2005). - PubMed
    1. Wolf S. A., Boddeke H. W., Kettenmann H., Microglia in physiology and disease. Annu. Rev. Physiol. 79, 619–643 (2017). - PubMed
    1. Wake H., Moorhouse A. J., Jinno S., Kohsaka S., Nabekura J., Resting microglia directly monitor the functional state of synapses in vivo and determine the fate of ischemic terminals. J. Neurosci. 29, 3974–3980 (2009). - PMC - PubMed
    1. Seo J. W., et al. ., Time-dependent effects of hypothermia on microglial activation and migration. J. Neuroinflammation 9, 164 (2012). - PMC - PubMed
    1. Yenari M. A., Han H. S., Neuroprotective mechanisms of hypothermia in brain ischaemia. Nat. Rev. Neurosci. 13, 267–278 (2012). - PubMed

Publication types

Substances

LinkOut - more resources