. 2021 May 14;372(6543):eabg2538.
doi: 10.1126/science.abg2538. Epub 2021 Apr 22.

Radiation-related genomic profile of papillary thyroid carcinoma after the Chernobyl accident

Affiliations

Radiation-related genomic profile of papillary thyroid carcinoma after the Chernobyl accident

Lindsay M Morton et al. Science. .

Abstract

The 1986 Chernobyl nuclear power plant accident increased papillary thyroid carcinoma (PTC) incidence in surrounding regions, particularly for radioactive iodine (131I)-exposed children. We analyzed genomic, transcriptomic, and epigenomic characteristics of 440 PTCs from Ukraine (from 359 individuals with estimated childhood 131I exposure and 81 unexposed children born after 1986). PTCs displayed radiation dose-dependent enrichment of fusion drivers, nearly all in the mitogen-activated protein kinase pathway, and increases in small deletions and simple/balanced structural variants that were clonal and bore hallmarks of nonhomologous end-joining repair. Radiation-related genomic alterations were more pronounced for individuals who were younger at exposure. Transcriptomic and epigenomic features were strongly associated with driver events but not radiation dose. Our results point to DNA double-strand breaks as early carcinogenic events that subsequently enable PTC growth after environmental radiation exposure.


Conflict of interest statement

Competing interests:

E.T.D. is an employee of Nvidia Corporation and owns stock in Nvidia, Illumina, and Pacific Biosciences. G.G. receives research funds from IBM and Pharmacyclics, and is an inventor on patent applications related to MuTect, ABSOLUTE, MutSig, MSMuTect, MSMutSig, MSIdetect, POLYSOLVER and TensorQTL. G.G. is a founder, consultant and holds privately held equity in Scorpion Therapeutics. All other authors declare no competing interests.

Figures

Fig. 1.
Fig. 1.. Landscape of somatic alterations in 440 papillary thyroid carcinomas, by radiation dose from 131I exposure.
Blank (white) spaces represent unavailable data due to lack of data from a specific platform (Figs. S1–S3). Signature analyses were restricted to high purity samples, defined as those with tumor purity >20% and no evidence of tumor contamination in the normal tissue. Abbreviations: BRAFV600E-RAS score (BRS), copy neutral loss of heterozygosity (CNLOH), deletion (DEL), dinucleotide polymorphism (DNP, i.e., doublet), ERK-activity score (ERK), indel (ID), insertion (INS), microsatellite (ms), papillary thyroid carcinoma (PTC), probability of causation (POC), single nucleotide variant (SNV), somatic copy number alteration (SCNA), single nucleotide variant (SNV), structural variant (SV), thyroid differentiation score (TDS), trinucleotide polymorphism (TNP, i.e., triplet).
Fig. 2.
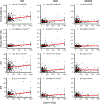
Fig. 2.. Relationship between radiation dose from 131I exposure and small deletions.
(A) Total small deletion count and restricted to (B) clonal and (C) subclonal small deletions. (D) Total deletion:SNV ratio and restricted to (E) clonal and (F) subclonal deletions and SNVs. (G) Total ID5 count and restricted to (H) clonal and (I) subclonal ID5. (J) Total ID8 count and restricted to (K) clonal and (L) subclonal ID8. β per 100 mGy and P-value were derived from multivariable linear regression models adjusting for age at PTC and sex. Gray shading indicates 95% confidence interval (CI). Full model results are provided in Table S18.
Fig. 3.
Fig. 3.. Relationship between radiation dose from 131I exposure and selected SV metrics.
(A) Number of simple/balanced SVs. (B) Likelihood of having a fusion versus mutation driver. (C) Number of clonal ≥5 bp EJ small deletions. (D) Number of confirmed clonal simple/balanced/end-joining SVs. (E) Number of confirmed clonal other SVs (E). Different scales are used for each panel to reflect the distributions and uncertainties of the excess odds ratio (EOR) estimates. Referent group for categorical analyses: EOR=0 (which is equivalent to odds ratio=1). EOR per 100 mGy and P-value were derived from multivariable proportional odds or logistic regression models adjusting for age at PTC and sex. Full model results are provided in Table S18.
Fig. 4.
Fig. 4.. Distribution of radiation dose from 131I exposure by driver type and pathway.
Fig. 5.
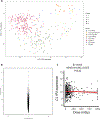
Fig. 5.. Selected RNA-seq results.
(A) Differential expression by driver and cluster. (B) Differential expression for all genes by radiation dose from 131I exposure. (C) Differential expression of CLIP2 by radiation dose from 131I exposure. Abbreviation: principal component (PC).
Fig. 6.
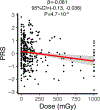
Fig. 6.. Relationship between radiation dose from 131I exposure and PRS.
Data for the 12 single nucleotide polymorphisms that comprise the PRS are provided in Table S15.
Fig. 7.
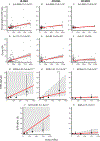
Fig. 7.. Relationship between radiation dose from 131I exposure and selected genomic characteristics by age at exposure.
Clonal deletion:SNV ratio for (A) <5 years at exposure, (B) 5–9 years at exposure, and (C) ≥10 years at exposure. Number of clonal ID8 mtuations for (D) <5 years at exposure, (E) 5–9 years at exposure, and (F) ≥10 years at exposure. Number of clonal ≥5 bp EJ small deletions for (G) <5 years at exposure, (H) 5–9 years at exposure, and (I) ≥10 years at exposure. Likelihood of having a fusion versus mutation driver for (J) <10 years at exposure and (K) ≥10 years at exposure. All analyses exclude 131I-unexposed individuals. β or EOR per 100 mGy and P-value were derived from multivariable linear, proportional odds, or logistic regression models adjusting for age at PTC and sex. Full model results are provided in Table S22. * Models evaluating the effect of dose on driver type restricted to <5 years of age at exposure did not converge, so individuals exposed at <5 and 5–9 years were combined in panel J. EOR/100 mGy for 5–9 years alone=1.78, 95%CI=0.12–226. ^^ in Panel H indicates that the upper 95% CI exceeds the y-axis maximum value.

References

    1. United Nations Scientific Committee on the Effects of Atomic Radiation (UNSCEAR), “Sources and Effects of Ionizing Radiation: UNSCEAR 2008 Report to the General Assembly, with Scientific Annexes,” (United Nations Publication, New York, 2010).
    1. Tronko M et al., Thyroid neoplasia risk is increased nearly 30 years after the Chernobyl accident. Int J Cancer 141, 1585–1588 (2017). - PubMed
    1. Furukawa K et al., Long-term trend of thyroid cancer risk among Japanese atomic-bomb survivors: 60 years after exposure. Int J Cancer 132, 1222–1226 (2013). - PMC - PubMed
    1. Veiga LH et al., Thyroid cancer after childhood exposure to external radiation: an updated pooled analysis of 12 studies. Radiat Res 185, 473–484 (2016). - PMC - PubMed
    1. International Agency for Research on Cancer (Lyon, France, 2012).

Publication types

MeSH terms