. 2021 Apr 23;372(6540):eabf1230.
doi: 10.1126/science.abf1230.

Barcoded viral tracing of single-cell interactions in central nervous system inflammation

Affiliations

Barcoded viral tracing of single-cell interactions in central nervous system inflammation

Iain C Clark et al. Science. .

Abstract

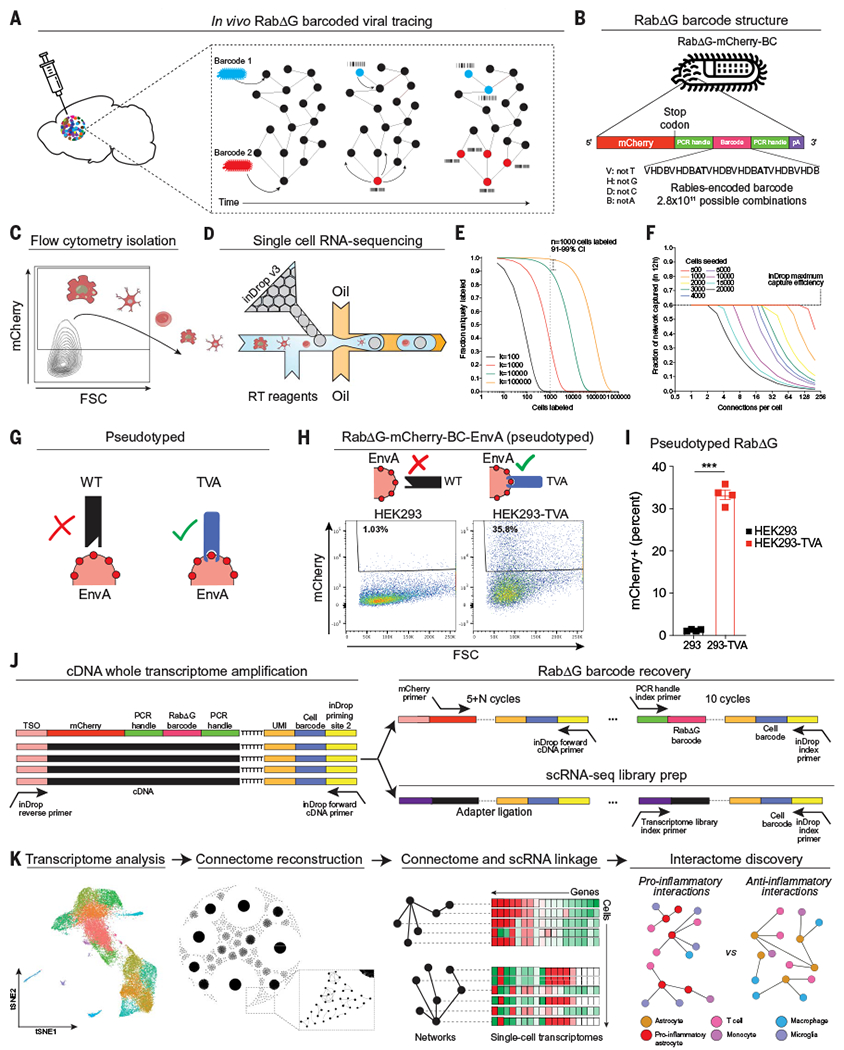
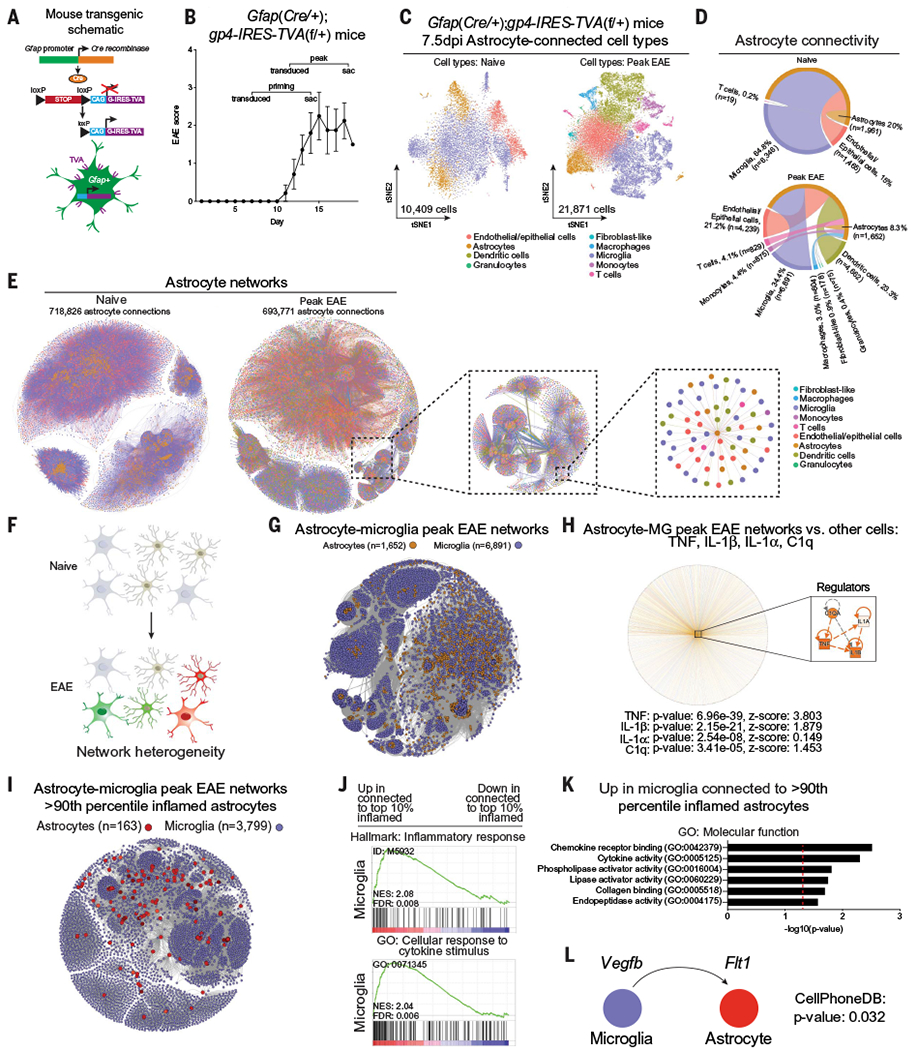
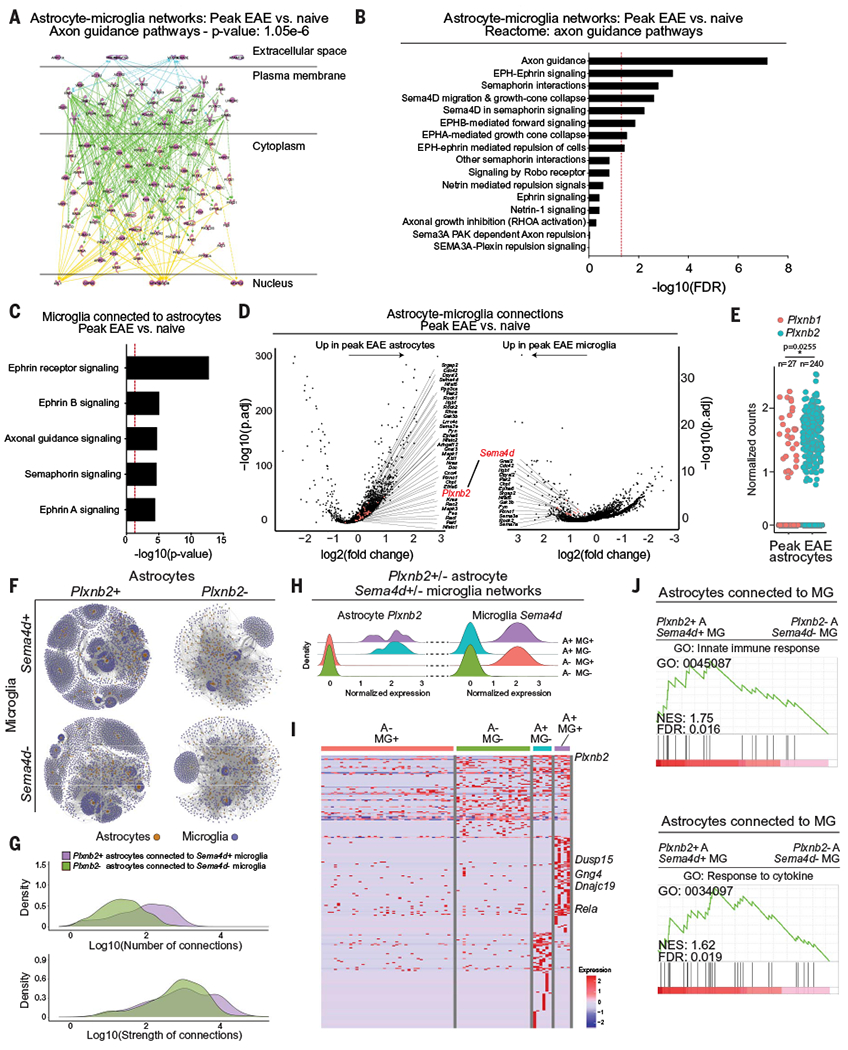
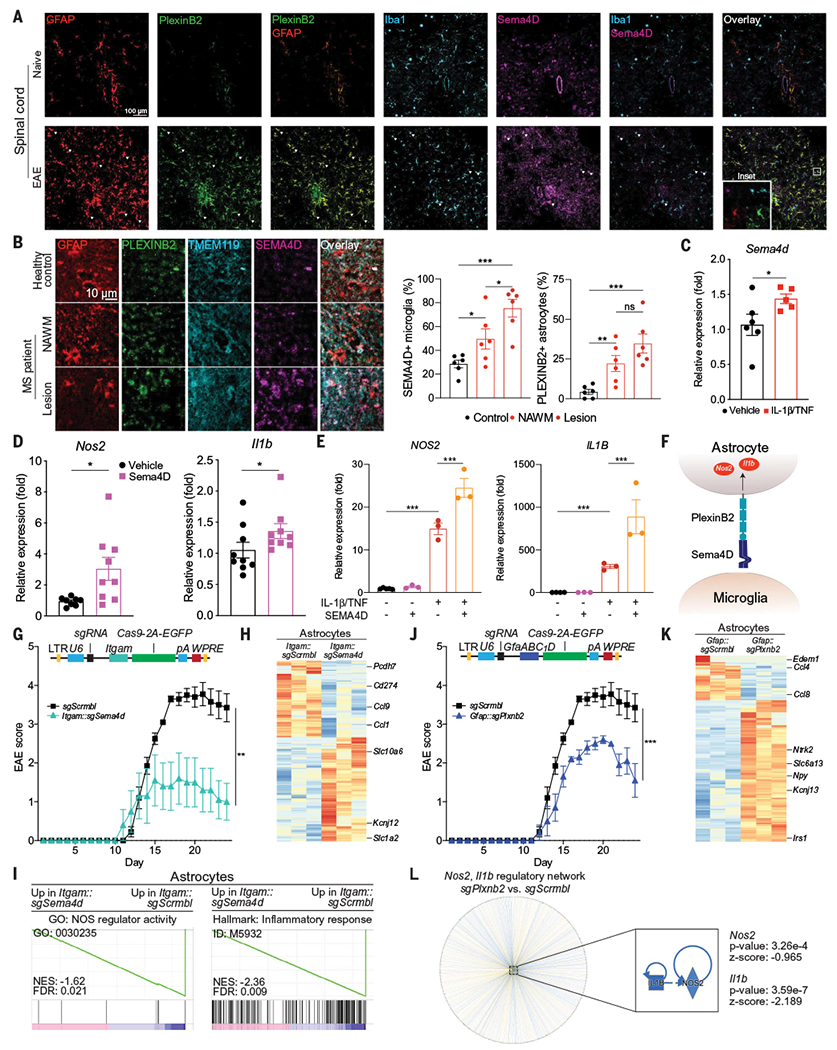
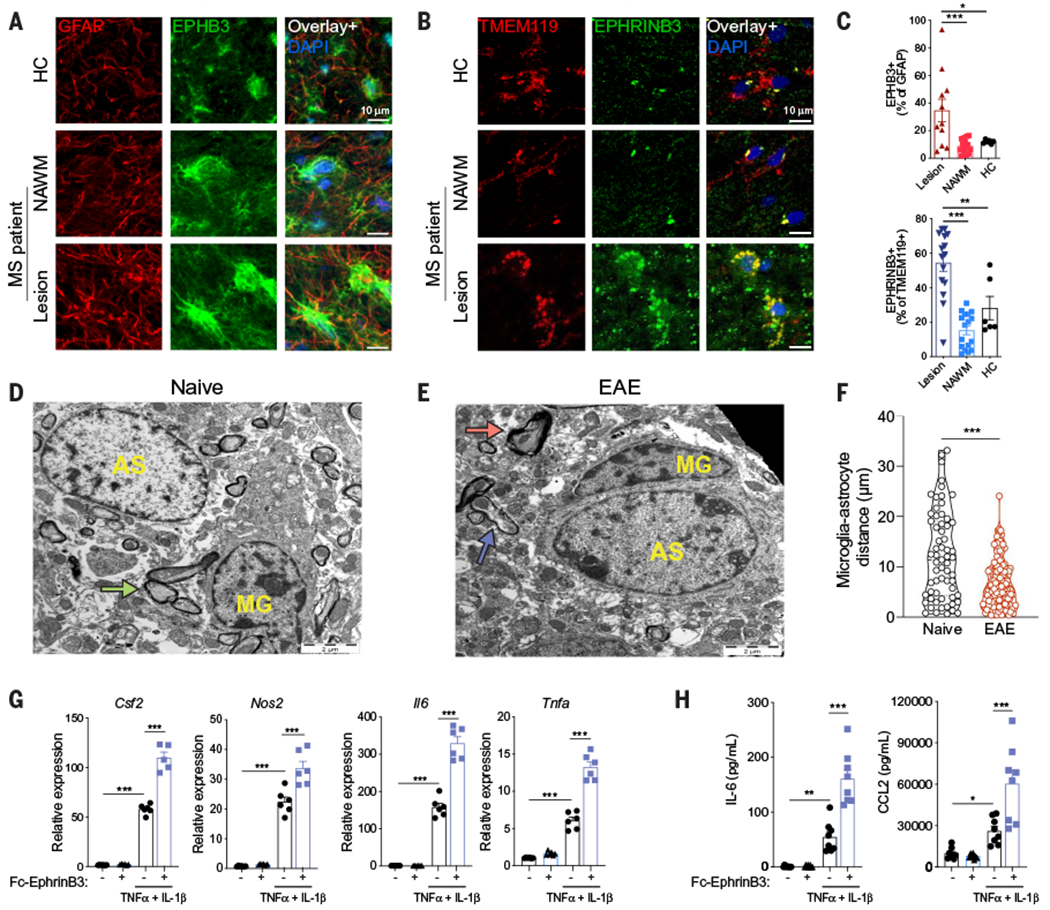
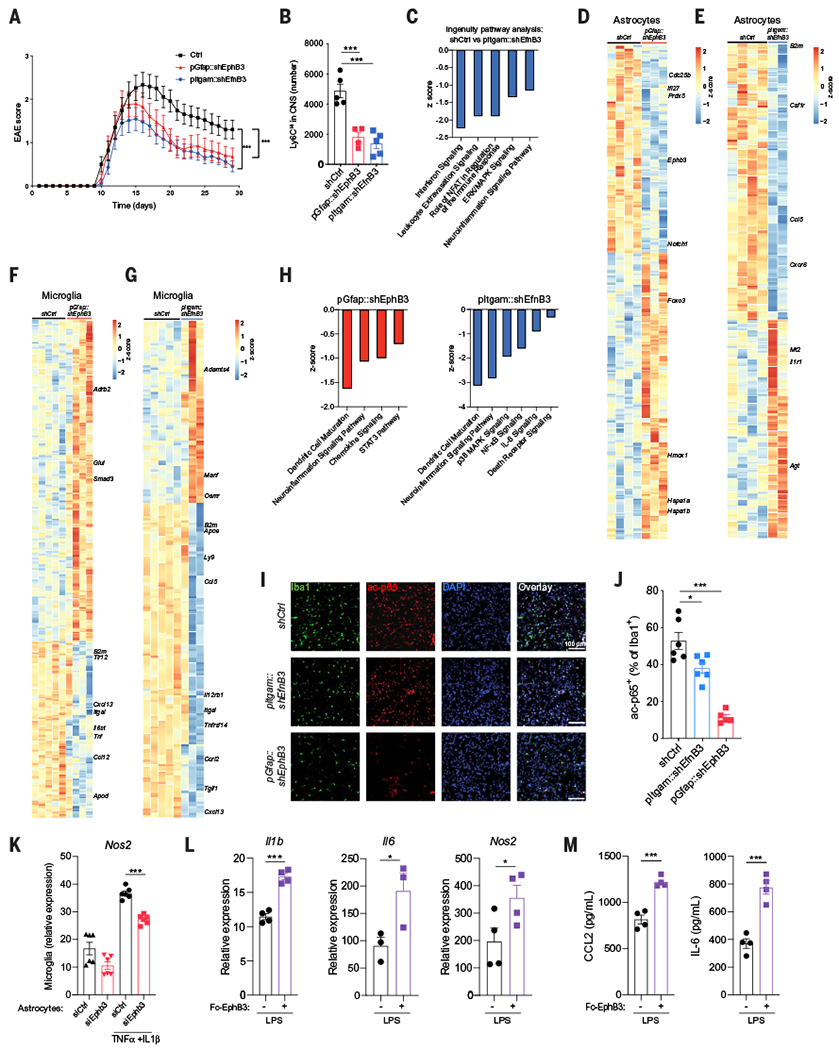
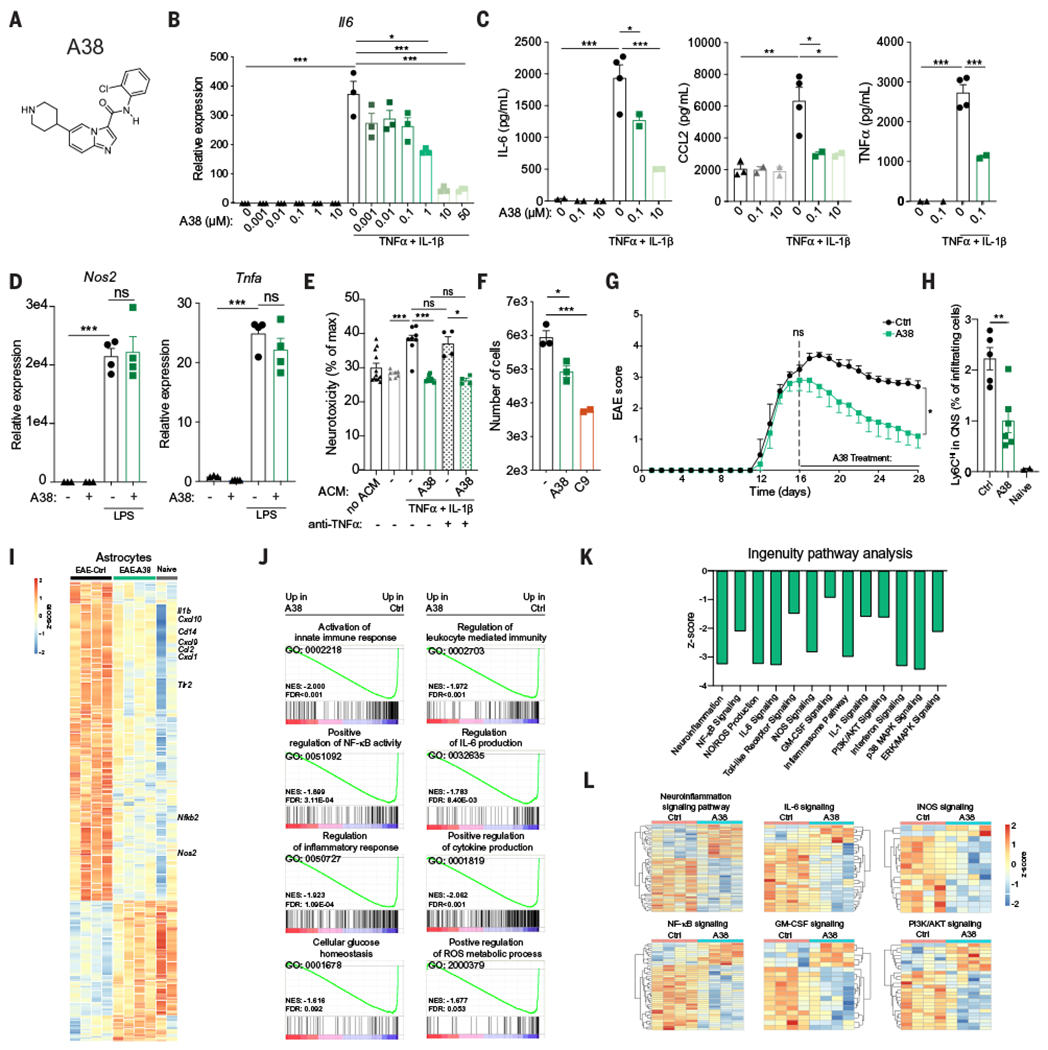
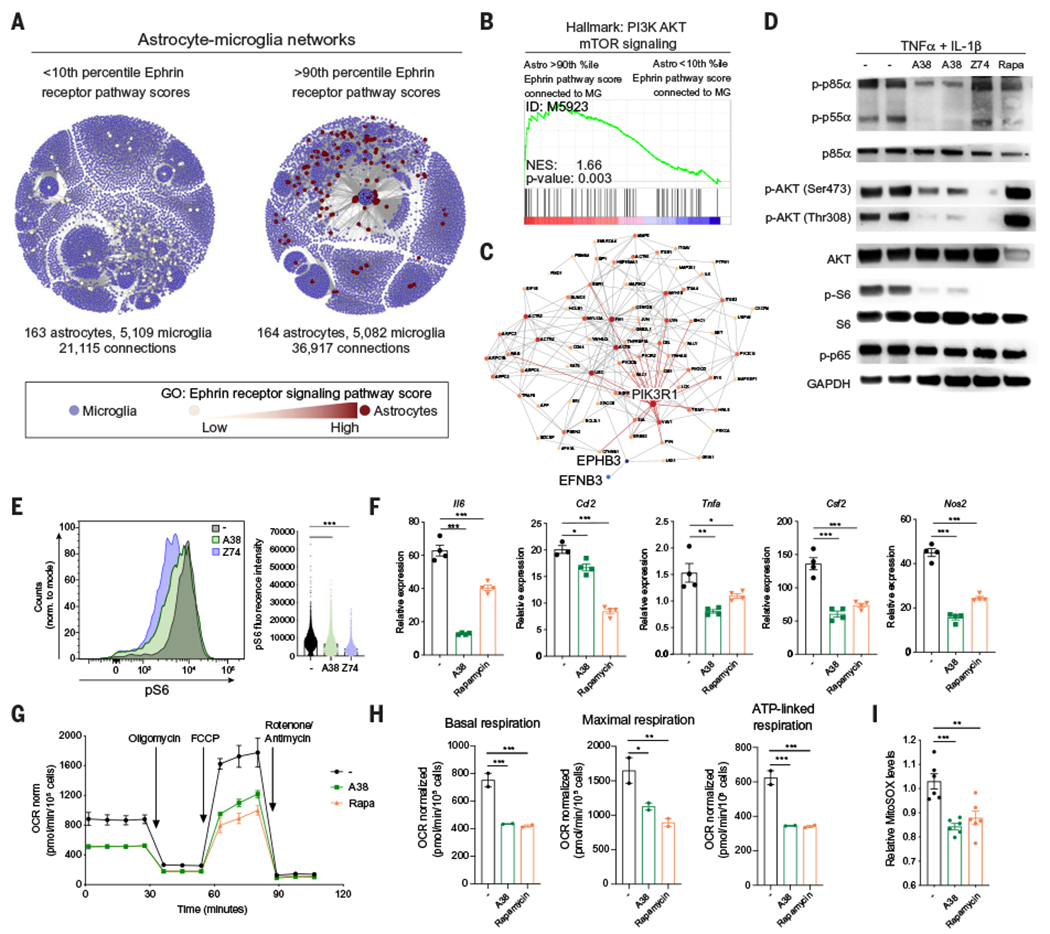
Cell-cell interactions control the physiology and pathology of the central nervous system (CNS). To study astrocyte cell interactions in vivo, we developed rabies barcode interaction detection followed by sequencing (RABID-seq), which combines barcoded viral tracing and single-cell RNA sequencing (scRNA-seq). Using RABID-seq, we identified axon guidance molecules as candidate mediators of microglia-astrocyte interactions that promote CNS pathology in experimental autoimmune encephalomyelitis (EAE) and, potentially, multiple sclerosis (MS). In vivo cell-specific genetic perturbation EAE studies, in vitro systems, and the analysis of MS scRNA-seq datasets and CNS tissue established that Sema4D and Ephrin-B3 expressed in microglia control astrocyte responses via PlexinB2 and EphB3, respectively. Furthermore, a CNS-penetrant EphB3 inhibitor suppressed astrocyte and microglia proinflammatory responses and ameliorated EAE. In summary, RABID-seq identified microglia-astrocyte interactions and candidate therapeutic targets.


Conflict of interest statement

Competing interests: I.C.C., M.A.W., C.G.-V., K.J.H., and F.J.Q. have filed a provisional patent application for the barcoding strategy and the therapeutic targeting of EphB signaling outlined in this paper.

Figures

Fig. 1.
Fig. 1.. Reconstruction of single-cell transcriptomes and connectomes using RABID-seq.
(A) Barcoded RabΔG virus is delivered via intracranial injection, and barcodes transfer to neighboring cells as RabΔG virus spreads throughout interacting cells. (B) The RabΔG genome expresses mCherry, which enables the recovery and sequencing of virus-infected cells. The mCherry transcript harbors a unique barcode with semirandom structure, flanked by constant regions to facilitate amplification. Base pair lengths are not to scale. (C) Flow cytometry recovery of mCherry+ cells from the CNS. FSC, forward scatter. (D) Single-cell RNA-sequencing of mCherry+ cells. RT, reverse transcription. (E) Fraction of uniquely labeled cells as a function of RabDG barcode library diversity and number of cells transduced. (F) Fraction of the in vivo network captured using in Drop (maximum 60% cell capture rate over a maximum period of 12 hours of encapsulation) as a function of the number of connections that each cell makes for different numbers of transduced cells. (G to I) RabΔG pseudotyping for cell targeting. (G) Schematic of RabΔG pseudotyping workflow and cell infectability. WT, wild type. (H) Fluorescence-activated cell sorting (FACS) analysis showing that pseudotyped virus only infects HEK293-TVA cells in vitro. HEK293, human embryonic kidney-293 cells. (I) Percent of HEK293 or HEK293-TVA cells infected with pseudotyped RabΔG virus. n = 4 samples per group. Unpaired two-tailed t test. (J) Generation of scRNA-seq libraries from inDrop using a SMART-seq approach with template switching and whole-transcriptome amplification (WTA). (Top right) WTA material is further amplified using a two-step approach with mCherry-specific primers followed by PCR primers targeting the constant region flanking the barcode. (Bottom right) Sequencing libraries are prepared from WTA product to produce scRNA-seq libraries. TSO, template-switching oligonucleotide. (K) Linkage of transcriptome and connectome data enables reconstruction of genome-wide transcriptional signatures of interacting cells in vivo. Data shown as means ± SEM. ***P < 0.001.
Fig. 2.
Fig. 2.. RABID-seq analysis of astrocyte cell interactions in naïve and EAE mice.
(A) Transgenic mouse line generated to target Gfap-expressing cells with the EnvA-TVA system. (B) EAE disease course. Mice were transduced with barcoded rabies virus, and brains were harvested 7.5 days after infection for scRNA-seq.Error bars indicate mean ± SEM. (C) t-distributed stochastic neighbor embedding (tSNE) plots of single-cell RABID-seq data from naïve and peak-EAE mice. The number of cells that passed bioinformatic filters is displayed near the origin. (D) Circos plots of astrocyte cell interactions in naïve and peak-EAE mice. Percentages are shown relative to the total number of connections. n is the number of cells of each cell type. (E) Network representation of astrocyte cell interactions. To provide a sense of scale, increasingly smaller portions of the network are selected and enlarged. Cells are colored by cell type, as determined using scRNA-seq data. (F to K) Analysis of astrocyte-microglia interactions during peak EAE by RABID-seq. (F) Schematic of heterogeneous interactions between astrocytes and microglia during EAE. (G) Network representation of astrocyte-microglia interactions detected by RABID-seq. (H) IPA (ingenuity pathway analysis) network analysis of single-cell RABID-seq data showing predicted upstream regulators in astrocytes connected to microglia (MG) versus astrocytes connected to other cells. Statistical analysis: right-tailed Fisher’s exact test. (I) Visualization of >90th percentile proinflammatory astrocyte-microglia subnetworks. (J) GSEA (gene set enrichment analysis) preranked analysis of scRNA-seq data comparing microglia connected to >90th percentile proinflammatory astrocytes versus microglia connected to <10th percentile proinflammatory astrocytes. (K) Analysis by gene ontology: molecular function of microglia connected to >90th percentile proinflammatory astrocytes. (L) CellPhoneDB identification of VEGFB-FLT1 signaling between microglia and >90th percentile proinflammatory astrocytes.
Fig. 3.
Fig. 3.. RABID-seq identifies a role for Sema4D-PlexinB2 signaling in microglia-astrocyte communication.
(A) IPA analysis of axon guidance pathway genes activated in astrocyte-microglia networks in peak-EAE versus naïve mice. (B) Differentially regulated axon guidance pathways in astrocyte-microglia networks in peak-EAE versus naïve mice. FDR, false discovery rate. (C) Differentially regulated axon guidance pathways in microglia connected to astrocytes in peak-EAE versus naíve mice. (D) Differential gene expression analysis of astrocytes connected to microglia in peak-EAE versus naíve mice. Differentially expressed genes [adjusted P value (P.adj) < 0.05] from axon guidance pathways in astrocytes (left) and microglia (right) are colored and labeled by gene name on volcano plots of −log10(P.adj) versus fold change. (E) Expression of Plxnbl and Plxnb2 in peak-EAE astrocytes. Two-tailed paired t test on percent per mouse. (F) Subnetworks of Plxnb2+/− astrocytes connected to Sema4d+/− microglia. (G) Density plots of the number of interactions between Plxnb2+ astrocytes connected to Sema4d+ microglia and Plxnb2 astrocytes connected to Sema4d microglia. (H) Normalized single-cell expression of Plxnb2 in astrocytes and Sema4d in microglia within the subnetworks shown in (F). A+: Plxnb2+ astrocytes; A−: Plxnb2 astrocytes; MG+: Sema4d+ microglia; MG−: Sema4d microglia. (I) Differential gene expression between astrocytes in the Plxnb2-Sema4d subnetworks determined by RABID-seq. (J) GSEA preranked analysis of single-cell RABID-seq data comparing Plxnb2+ astrocytes connected to Sema4d+ microglia (A+ MG+) to Plxnb2 astrocytes connected to Sema4d microglia (A− MG−). NES, normalized enrichment score.
Fig. 4.
Fig. 4.. Microglia-astrocyte Sema4D-PlexinB2 signaling promotes CNS inflammation in EAE.
(A) Immunostaining analysis of PlexinB2, GFAP, Ibal, and Sema4D in the spinal cords of naïve and peak-EAE mice. Images are representative of n = 3 mice per group. (B) Immunostaining of MS patient and healthy control CNS tissue. n = 6 images from N = 3 patients per region. Statistical analysis: unpaired two-tailed t test. NAWM, normally appearing white matter. (C) Sema4d expression determined by quantitative PCR (qPCR) in primary mouse microglia treated with IL-1β/TNF versus vehicle. n = 6 vehicle, n = 5 IL-1β/TNF. Statistical analysis: Kolmogorov-Smirnov t test. (D) Nos2 and Il1b expression determined by qPCR in primary mouse astrocytes treated with a recombinant Sema4D fragment with agonistic activity. n = 9 samples per group, n = 8 samples for Nos2 vehicle. Statistical analysis: Kolmogorov-Smirnov t test per group. (E) Nos2 and Il1b expression determined by qPCR in primary human fetal astrocytes treated with the indicated compounds. n = 5 vehicle Nos2, n = 4 vehicle Il1b, n = 3 otherwise. Statistical analysis: unpaired two-tailed t test. (F) Schematic depicting microglial Sema4D binding PlexinB2 expressed in astrocytes. (G) EAE disease course in mice transduced with Itgam::Cas9 coexpressing sgSema4d- or sgScrmbl-targeting lentiviruses. n = 10 sgScrmbl, n = 5 sgSema4d mice. Statistical analysis: two-way repeated measures analysis of variance (ANOVA). (Top) Schematic of lentiviral vector. Lentiviral transduction occurred 7 days before EAE induction to avoid targeting recruited myeloid cells. (H and I) RNA-seq analysis of gene expression (H) and GSEA preranked (I) of astrocytes isolated from mice transduced with Itgam::sgSema4d or Itgam::sgScrmbl. (J) EAE disease course in mice transduced with Gfap::Cas9 coexpressing sgPlxnb2 or sgScrmbl. n = 10 sgScrmbl, n = 5 sgPlxnb2 mice. Statistical analysis: two-way repeated measures ANOVA. (Top) Schematic of lentiviral vector. (K) Differential gene expression determined by RNA-seq in astrocytes from mice transduced with Gfap::sgPlxnb2 versus Gfap::sgScrmbl. (L) Upstream regulator analysis by IPA of Gfap::sgPlxnb2 astrocytes relative to Gfap::sgScrmbl shows down-regulation of Nos2- and Il1b-driven proinflammatory pathways. Data shown as mean ± SEM. *P < 0.05, **P < 0.01, ***P < 0.001. ns, not significant.
Fig. 5.
Fig. 5.. EphB3 receptor signaling boosts astrocyte proinflammatory responses.
(A to C) Immunostaining analysis of MS and healthy control (HC) CNS tissue samples for the colocalization of EPHB3 and GFAP in astrocytes (A) or EPHRINB3 and TMEM119 in microglia (B). (C) Quantification of immunostaining data. n = 6 or 16 images from N = 3 patients per region. Statistical analysis: one-way ANOVA and Dunnett post-test. (D and E) Representative electron micrographs of naïve (D) and EAE (E) spinal cords. Microglia (MG) cells exhibit elongated and dark nuclei with clumped chromatin and dark cytoplasm, and astrocytic cells (AS) are characterized by pale nuclei that are usually regular in shape with a thin rim of heterochromatin beneath the nuclear membrane.Green arrow, intact myelin; red arrow, myelin destruction; blue arrow, remyelination. The black space in the top right corner of (E) indicates the edge of the tissue section. (F) Quantification of microglia-astrocyte distance in electron microscopy images. n = 63 naïve mice, n = 167 EAE mice. Statistical analysis: unpaired two-tailed t test. (G) Csf2, Nos2, Il6, and Tnfa expression determined by qPCR in neonatal mouse astrocytes stimulated with TNFα and IL-1β in the presence of plate-bound Ephrin-B3–Fc chimera. n = 6 samples per group. Statistical analysis: one-way ANOVA and Dunnett post-test. Data are representative of two independent experiments. (H) IL-6 and CCL2 concentration in supernatants of neonatal mouse astrocytes stimulated with TNFα and IL-1β in the presence of plate-bound Ephrin-B3–Fc chimera. n = 6 samples per group. Statistical analysis: one-way ANOVA and Dunnett post-test. Data are representative oftwo independent experiments. Data shown as mean ± SEM. *P < 0.05, **P < 0.01, ***P < 0.001.
Fig. 6.
Fig. 6.. Microglia-astrocyte Ephrin-B3–EphB3 signaling promotes CNS pathology in EAE.
(A) EAE in knockdown mice transduced with lentiviral constructs targeting Ephb3 in astrocytes (red), Efnb3 in microglia (blue), or nontargeting control (black) Ctrl (n = 24 mice), pGfap::shEphb3 (n = 17 mice), pItgam::shEfnb3 (n = 22 mice). Statistical analysis: two-way ANOVA. (B) Quantification of proinflammatory monocytes in the CNS of EAE mice after the knockdown of Ephb3 in astrocytes (red), Efnb3 in microglia (blue), or nontargeting control (black). n = 5 mice per group. Statistical analysis: one-way ANOVA and Dunnett post-test. (C to E) RNA-seq analysis of astrocytes. (C) Differentially regulated pathways in astrocytes after Efnb3 knockdown in microglia analyzed by ingenuity pathways analysis. (D and E) Heatmap of differentially expressed genes in astrocytes after the knockdown of Ephb3 in astrocytes (D) or Efnb3 in microglia (E). (F to H) RNA-seq analysis of microglia isolated from EAE mice transduced with lentiviral vectors targeting Ephb3 in astrocytes, Efnb3 in microglia, or non-targeting control. (F and G) Heatmap of differentially expressed genes in microglia after knockdown of Ephb3 in astrocytes (F) or Efnb3 in microglia (G). (H) Relevant pathways selected from ingenuity pathway analysis of the genes differentially expressed in microglia after Ephb3 knockdown in astrocytes (left) and Efnb3 knockdown in microglia (right). (I) Immunostaining analysis of acetylated p65 (ac-p65) and Iba1 in the CNS of EAE knockdown mice. (J) Quantification of ac-p65+ Iba1+ cells. n = 6 mice per group. Statistical analysis: one-way ANOVA and Tukey post-test. (K) Astrocytes treated with control or Ephb3-targeting small interfering RNA and pretreated with TNFα and IL-1β were cocultured overnight with microglia, and microglial Nos2 expression was determined by qPCR. n = 6 samples per group. Statistical analysis: one-way ANOVA and Tukey post-test. (L and M) Neonatal mouse microglia cultured in plates precoated with EphB3-FcChimera and stimulated with LPS. (L) Illb, Il6, and Nos2 expression determined by qPCR and (M) CCL2 and IL-6 production quantified by enzyme-linked immunosorbent assay (ELISA) in supernatants. n = 4 samples per group. Statistical analysis: unpaired two-tailed t test. Data are representative of two independent experiments. Data shown as mean ± SEM. *P < 0.05, ***P < 0.001.
Fig. 7.
Fig. 7.. Pharmacologic inhibition of EphB3 receptor kinase ameliorates EAE.
(A) A38 structure. (B) Il6 mRNA expression determined by qPCR in neonatal mouse astrocytes stimulated with TNFα and IL-1β in the presence of the indicated concentrations of A38. n = 3 samples per group. Statistical analysis: one-way ANOVA and Sidak post-test. (C) IL-6, CCL2, and TNFα concentration measured by ELISA in supernatants of neonatal mouse astrocytes stimulated as in (B) with the indicated concentrations of A38. n = 4 and 2 samples (0.1 and 10 groups). Statistical analysis: one-way ANOVA and Dunnett post-test. Data are representative of three independent experiments. (D) Nos2 and Tnfa mRNA expression determined by qPCR in neonatal mouse microglia stimulated with LPS in the presence of A38. n = 4 samples. Statistical analysis: one-way ANOVA and Tukey post-test. Data are representative of two independent experiments. (E and F) Primary mouse astrocytes were activated with TNFα and IL-1β, and treated with A38 or C9. Media was replaced, cells were extensively washed, and new medium was added 24 hours later; ACM was collected 48 hours later. (E) ACM was added to the mouse neuron cell line N2A preactivated with IFNγ, and cytotoxicity was determined by quantifying lactate dehydrogenase release after 24 hours; TNF blocking antibody was added where indicated. n = 8 samples per group but n = 4 samples for anti-TNFα groups. Statistical analysis: one-way ANOVA and Tukey post-test. Data are representative of two independent experiments. (F) Migration assay of splenic CD11b+ monocytes performed using ACM. n = 3 samples (- and A38), n = 3 samples (C9). Statistical analysis: one way ANOVA and Dunnett post-test. Data are representative of two independent experiments. (G) EAE in C57Bl/6J mice treated twice a day with vehicle or 20 mg/kg A38 injected intraperitoneally, starting at the peak of the disease. n = 5 mice per group. Statistical analysis: two-way ANOVA. Data are representative of two independent experiments. (H) Quantification of monocytes in the CNS of C57Bl/6J mice treated as in (A). n = 5 Ctrl mice, n = 6 A38 mice, and n = 2 naïve mice. Statistical analysis: one-way ANOVA and Tukey post-test. (I to L) RNA-seq analysis of astrocytes from naïve or EAE mice treated with A38 or vehicle. (I) Heatmap of differentially expressed genes in astrocytes. (J) GSEA of astrocytes. (K and L) Ingenuity pathway analysis of genes differentially expressed in astrocytes from A38-treated mice compared with vehicle-treated mice. Data shown as mean ± SEM. *P < 0.05, **P < 0.01, ***P < 0.001. ns, not significant.
Fig. 8.
Fig. 8.. EphB3 kinase activates mTOR and boosts mitochondrial ROS production in astrocytes.
(A) Subnetworks of astrocytes interacting with microglia, as determined by RABID-seq and binned (<10th versus >90th percentile) based on their expression of Ephrin receptor pathway genes (MSigDB ID: M5923). (B) GSEA preranked analysis of RABID-seq data comparing >90th percentile astrocytes to <10th percentile astrocytes. (C) Protein-protein interaction analysis of the effects of A38 on astrocytes. (D) Western blot analysis of phosphorylated (p-) or total protein for p85α PIK3R1, p55α PIK3R1, AKT, S6, p65, and GAPDH in primary neonatal mouse astrocytes activated for 30 min with TNFα and IL-1β in the presence of the indicated compounds. Z74, ZSTK74 (class I PI3K isoforms inhibitor); Rapa, rapamycin. Blots are representative of three independent experiments. (E) Analysis of S6 phosphorylation determined by intracellular staining and flow cytometry of astrocytes stimulated as in (D). Statistical analysis: one way ANOVA and Tukey post-test. (F) Il6, Ccl2, Tnfa, Csf2, and Nos2 expression determined by qPCR in neonatal mouse astrocytes stimulated with TNFα and IL-1β in the presence of A38 or rapamycin. n = 4 samples per group. Statistical analysis: one way ANOVA and Dunnett post-test. Data are representative of three independent experiments. (G) Seahorse mitochondrial stress test performed on astrocytes pretreated overnight with A38 or rapamycin. n = 2 samples. OCR, oxygen consumption rate; FCCP, trifluoromethoxy carbonylcyanide phenylhydrazone. (H) Quantification of basal mitochondrial respiration, maximal mitochondrial respiration, and ATP-linked respiration calculated from mitochondrial stress assay from (E). n = 2 samples per group. Statistical analysis: one-way ANOVA and Tukey post-test. Data are representative of three independent experiments. (I) Mitochondrial ROS measured by MitoSOX staining after overnight treatment with IL-1β/TNFα and A38 or rapamycin. n = 6 samples per group. Statistical analysis: one-way ANOVA and Tukey post-test. Data are representative of three independent experiments. Data shown as mean ± SEM. *P < 0.05, **P < 0.01, ***P < 0.001.

Comment in

References

    1. Anderson MA et al. Astrocyte scar formation aids central nervous system axon regeneration. Nature 532, 195–200 (2016). doi: 10.1038/nature17623 - DOI - PMC - PubMed
    1. Liddelow SA et al. Neurotoxic reactive astrocytes are induced by activated microglia. Nature 541, 481–487 (2017). doi: 10.1038/nature21029 - DOI - PMC - PubMed
    1. Wheeler MA et al. MAFG-driven astrocytes promote CNS inflammation. Nature 578, 593–599 (2020). doi: 10.1038/s41586-020-1999-0 - DOI - PMC - PubMed
    1. Greenhalgh AD, David S, Bennett FC, Immune cell regulation of glia during CNS injury and disease. Nat. Rev. Neurosci 21, 139–152 (2020). doi: 10.1038/s41583-020-0263-9 - DOI - PubMed
    1. Mayo L. et al. Regulation of astrocyte activation by glycolipids drives chronic CNS inflammation. Nat. Med 20, 1147–1156 (2014). doi: 10.1038/nm.3681 - DOI - PMC - PubMed

Publication types

MeSH terms