. 2021 Apr 23;372(6540):eabe1931.
doi: 10.1126/science.abe1931.

Cholinergic neurons constitutively engage the ISR for dopamine modulation and skill learning in mice

Affiliations

Cholinergic neurons constitutively engage the ISR for dopamine modulation and skill learning in mice

Ashley R Helseth et al. Science. .

Abstract

The integrated stress response (ISR) maintains proteostasis by modulating protein synthesis and is important in synaptic plasticity, learning, and memory. We developed a reporter, SPOTlight, for brainwide imaging of ISR state with cellular resolution. Unexpectedly, we found a class of neurons in mouse brain, striatal cholinergic interneurons (CINs), in which the ISR was activated at steady state. Genetic and pharmacological manipulations revealed that ISR signaling was necessary in CINs for normal type 2 dopamine receptor (D2R) modulation. Inhibiting the ISR inverted the sign of D2R modulation of CIN firing and evoked dopamine release and altered skill learning. Thus, a noncanonical, steady-state mode of ISR activation is found in CINs, revealing a neuromodulatory role for the ISR in learning.


Conflict of interest statement

Competing interests: The authors have no competing interests to disclose.

Figures

Figure 1.
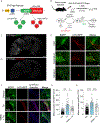
Figure 1.. SPOTlight, a brain-wide reporter of ISR state-dependent translation.
(A) SPOTlight reporter design. (B) Top – Brain-wide delivery of SPOTlight reporter and validation strategy. Bottom – ISR schematic showing Tunicamycin and ISRIB sites of action. (C and D) Mid-section sagittal views of brain-wide SPOTlight EGFP (C) and tdTomato (D) (amplified by anti-RFP with Rhodamine Red-conjugated secondary antibody) expression under basal conditions. Scale bar 1000 microns. (E) A survey of the brain reveals rare cells in the hippocampus (scale bar 100 microns), cerebellum and striatum (scale bars 50 microns) with strong tdTomato signal. (F) In vivo induction of the ISR with acute tunicamycin (middle row) results in a robust increase in tdTomato signal compared to vehicle (top row), which corresponds with p-eIF2α immuno-positive soma in the CA2 pyramidal layer of the mouse hippocampus. This increase is attenuated by pre-treatment with ISRIB (bottom row). Scale bar 50 microns. (G) Quantification of tdTomato signal. (Veh - 8 mice, 76 cells; Tm - 9 mice, 137 cells; ISRIB/Tm - 4 mice, 110 cells). Nested t-test for Tm v Veh: t=3.861, F(1,15)=14.91, **p=0.0015; Tm v ISRIB/Tm: t=2.612, F(1,11)=6.823, *p=0.0242); and ISRIB/Tm v Veh: t=1.000, F(1,10)=1.001, p=0.3407 (ns). Treatment: F(3,20)= 4.788, *p=0.0113 by nested one-way ANOVA with Tukey’s post hoc test for multiple comparisons. (H) Quantification of mean somatic p-eIF2α corrected total cell fluorescence (CTCF). (Veh - 3 mice, 64 cells; Tm - 3 mice, 77 cells; ISRIB/Tm - 3 mice, 79 cells). Nested t-test for Tm v. Veh: t=5.187, F(1,139)= 26.90, ***p=0.0001; ISRIB/Tm v Tm: t=4.620, F(1,154)=21.34, ***p<0.0001; and ISRIB/Tm v Veh: t=0.409, F(1,141)=0.1675, p=0.6830 (ns). Treatment: F(3,257)=12.19, ***p<0.0001 by nested one-way ANOVA with Tukey’s post hoc test for multiple comparisons.
Figure 2.
Figure 2.. CINs show steady-state activity-dependent ISR activation.
(A) Photomicrographs of the dorsal striatum showing levels of SPOTlight EGFP and tdTomato (amplified by anti-RFP/Rhodamine Red) in CINs (ChAT+, top) and SPNs (DARPP32+, bottom). (B) Phospho-eIF2α immunofluorescence in CINs (top) and SPNs (bottom). (C) Quantification of p-eIF2α CTCF from (B). Images were analyzed with FIJI, and immunofluorescence was determined per cell and presented as the mean CTCF ± SEM. (ChAT+ - 3 mice, 92 cells; DARPP32+ - 3 mice, 395 cells). Nested t-test, t=12.54, F(1,4)=157.3, ***p=0.0002. Scale bar 25 microns. (D) Strategy for Cre-mediated expression of hM4Di (Gi) DREADD fused to mCherry or mCherry alone in dorsal striatal CINs of ChAT-Cre heterozygous mice. All mice received chronic clozapine-N-oxide (CNO) at a dose of 3 mg/kg/day divided in two evenly spaced doses for 5 days. (E) Representative photomicrographs from the dorsal striatum of mCherry control (top) vs Gi DREADD-expressing (bottom) mice showing ChAT immunohistochemistry, mCherry expression, p-eIF2α immunohistochemistry with DAPI counterstain, and merged images. Scale bar 25 microns. (F) Quantification of p-eIF2α CTCF from (E). (mCherry control - 5 mice, 270 ChAT+ cells; Gi DREADD - 5 mice, 215 ChAT+ cells). Nested t-test: t=4.079, F(1,8)=16.64, **p=0.0035.
Figure 3.
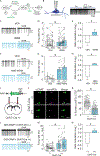
Figure 3.. ISR state in CINs alters D2R modulation of CIN firing.
(A) ISR schematic showing pharmacological and genetic manipulations in green. (B) Illustration of cell-attached recording mode and representative trace displaying the normally observed pause in CIN firing in response to the D2R agonist quinpirole. (C) Representative recordings of spontaneous CIN firing before and after quinpirole addition (10 μM, 3 min) in brain slices pre-incubated with vehicle or 50 nM ISRIB. (D) Quantification of CIN firing rates, showing paired measurements before and after quinpirole (Veh - 13 mice, 29 cells; ISRIB - 11 mice, 30 cells). Nested t-test: t=2.612, F(1,22)=6.882; *p=0.016. (E) Log2 modulation index of data in (D), to illustrate net directionality of D2R modulation; rate decreases below the abscissa and increases above it. (F) Representative recordings of spontaneous CIN firing before and after quinpirole (10 μM, 3 min) in brain slices pre-incubated with vehicle or 100 nM AMG PERK 44. (G) Quantification showing paired measurements before and after quinpirole (Veh - 3 mice, 8 cells; AMG PERK 44 – 3 mice, 10 cells). Nested t-test: t=3.563, F(1,16)=12.70; *p=0.034. (H) Log2 modulation index of data in panel (G). (I) Strategy for Cre-dependent expression of the p-eIF2α phosphatase CReP in CINs (AAV9-DIO CReP x ChAT-Cre mice). (J) Example images of ChAT and p-eIF2α immunohistochemistry in CINs (ChAT+ cells). Scale bar 25 microns. (K) Quantification of mean somatic p-eIF2α CTCF from (J). (Cre(−) - 3 mice, 109 cells; Cre(+) - 3 mice, 94 cells). Nested t-test: t=3.664, F(1,4)=13.42, *p=0.022. (L) Representative recordings of spontaneous CIN firing before and after quinpirole (10 μM, 3 min) in CINs over-expressing CReP. (M) Quantification of paired measurements before and after quinpirole (Cre(−) - 10 mice, 24 cells; Cre(+) - 9 mice, 19 cells). Nested t-test: t=2.392 F(1,41)=5.720; *p=0.021. (N) Log2 modulation index of data in (M). #P-values of all Log2 graphs are < 0.05. Since some of these data include imputed values to avoid NaN (See Materials and Methods), the reader is referred to p-value for the primary data in prior panel.
Figure 4.
Figure 4.. CIN ISR inhibition inverts the effect of D2R modulation on evoked dopamine transients.
(A) Schematic illustrating viral expression of dLight1.2 reporter ± Cre-dependent overexpression of CReP in dorsal striatum of ChAT-Cre mice, followed by recording of evoked transients in acute brain slices. FOV indicates recording field of view. (B) Representative traces of whole-FOV striatal responses to electrically evoked dopamine release using a single pulse or five pulses at 2, 5, or 100Hz. Example traces are the mean of three responses, and are represented as % dF/F0 (percent change in baseline fluorescence). Control (top) and CReP-OE (bottom) conditions in ACSF (black) and 5 µM Sulpiride (red). (C) Mean effect of D2R modulation on the peak amplitude of evoked dLight1.2 responses, represented as 100 - Amplitude[Sulpiride]/Amplitude[ACSF] (%). Values are mean ± SEM. (Control - 4 mice, 13 slices; CReP-OE - 3 mice, 10 slices). Two-way ANOVA – significant effects of viral manipulation [F(1,21) = 16.15, p<0.001] and pulse number [F(1.302, 27.34) = 5.117, p<0.05], and a significant interaction [F(3,63) = 4.237, p<0.01]. (D) Mean effect of D2R modulation on the area under the curve (AUC) of evoked dLight1.2 responses. Values are mean ± SEM. (Control - 4 mice, 13 slices; CReP-OE - 3 mice, 10 slices). Two-way ANOVA – significant effects of viral manipulation [F(1,21) = 10.87, p<0.01] and pulse number [F(2.173, 45.64) = 4.730, p<0.05], but no interaction [F(3,63) = 1.37, p=0.26].
Figure 5.
Figure 5.. CIN ISR inhibition enhances performance vigor of learned tasks.
(A) Schematic illustrating viral expression of mCherry tracer ± Cre-dependent CReP overexpression in dorsal striatum of ChAT-Cre mice (left), followed three weeks later by testing in the Morris water maze (center), operant chamber lever press task (right), and open field (not shown). (B) Results of Morris water maze training. Male ChAT-Cre heterozygous mice with CReP OE in dorsal striatal CINs (blue) reached the hidden platform faster than controls (black; mCherry virus alone) over the course of training in a modified Morris water maze protocol as used in 2,29. (4 mice per group). *p=0.0106 by two-way rmANOVA with Bonferonni’s post-hoc test F(7,42)=3.068. (C) Results of lever press training. Cre-dependent CReP OE mice (blue) achieved higher lever press rates than control mice (black; mCherry virus alone) in a randomized interval (RI) training protocol using increasing mean time delays before reward delivery. (10 mice per group). Two-way ANOVA with Sidak’s multiple comparisons test: F(15,270)=3.776, *p< 0.0001. CRF – continuous reinforcement; RI-30 – random interval, 30s average delay; RI-60 – random interval, 60s average delay. (D) Normalized devalued lever press rate (NDLPr), a measure of habit learning, was not affected by CIN CReP overexpression. (10 mice per group; p=0.69). (E) Cumulative probability distribution showing CReP OE mice (blue) pressed with shorter intervals between presses than controls (black) on the final day of lever press training. (Control - 7 mice, 5,797 events; CReP OE - 7 mice, 10,841 events; data for 3 mice in each cohort was lost due to instrument failure). *p<0.0001 by two sample Kolmogorov-Smirnov test. (F) Mean swimming velocity of mice with CReP OE (blue) exceeded that of mCherry controls (black) during the Morris water maze task. (4 mice per group). Two-way rmANOVA: F(6,42)=4.981, **p=0.0006. (G) CReP OE mice show no differences in locomotor speed during exploration of a novel open field chamber. (10 mice per group). Two-way ANOVA: F(5,90)=1.645, p=0.1563. All data are presented as mean ± SEM.

Comment in

References

    1. Pakos-Zebrucka K et al., The integrated stress response. EMBO Rep. 17, 1374–1395 (2016). - PMC - PubMed
    1. Harding HP et al., An integrated stress response regulates amino acid metabolism and resistance to oxidative stress. Mol. Cell 11, 619–633 (2003). - PubMed
    1. Trinh MA, Klann E, Translational control by eIF2α kinases in long-lasting synaptic plasticity and long-term memory. Neurobiol. Learn. Mem 105, 93–99 (2013). - PMC - PubMed
    1. Costa-Mattioli M, Sossin WS, Klann E, Sonenberg N, Translational control of long-lasting synaptic plasticity and memory. Neuron. 61, 10–26 (2009). - PMC - PubMed
    1. Costa-Mattioli M, Walter P, The integrated stress response: From mechanism to disease. Science. 368, eaat5314 (2020). - PMC - PubMed

Publication types