. 2021 Apr 23;372(6540):371-378.
doi: 10.1126/science.aba5545. Epub 2021 Apr 22.

Replication timing maintains the global epigenetic state in human cells

Affiliations

Replication timing maintains the global epigenetic state in human cells

Kyle N Klein et al. Science. .

Abstract

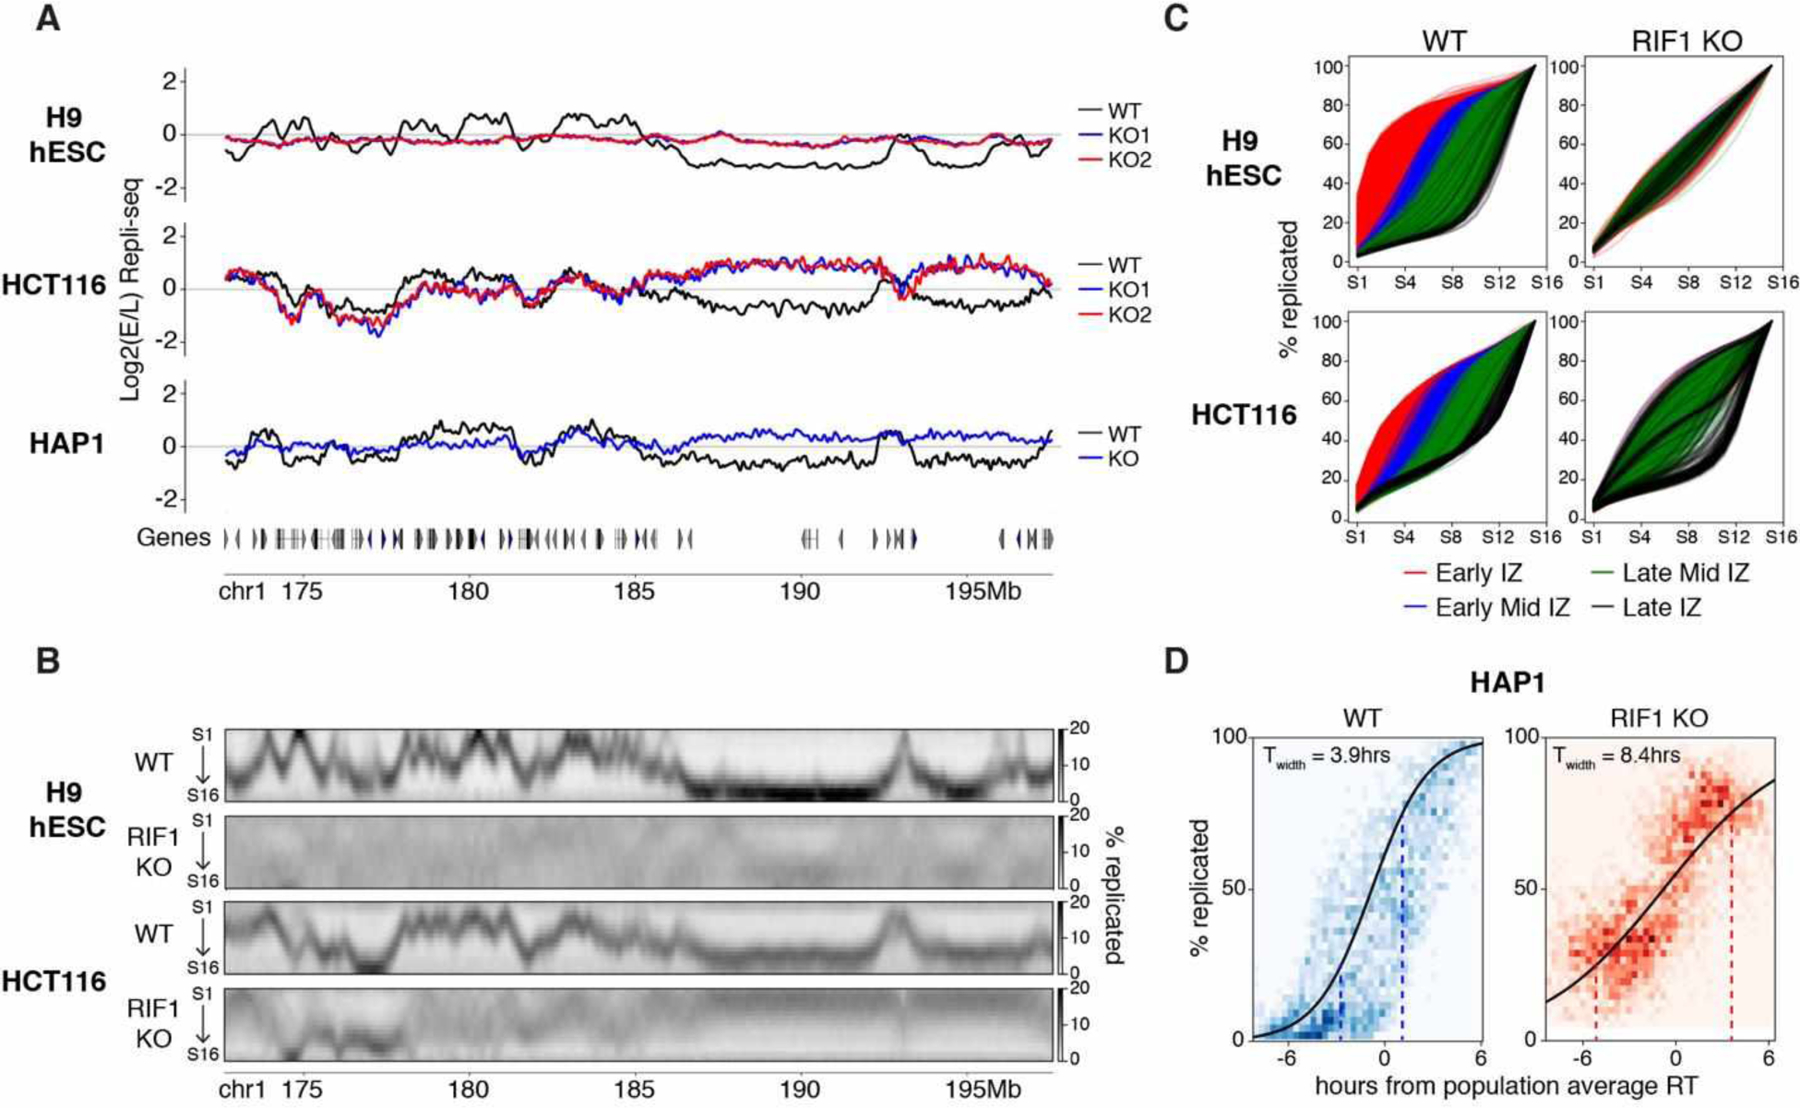
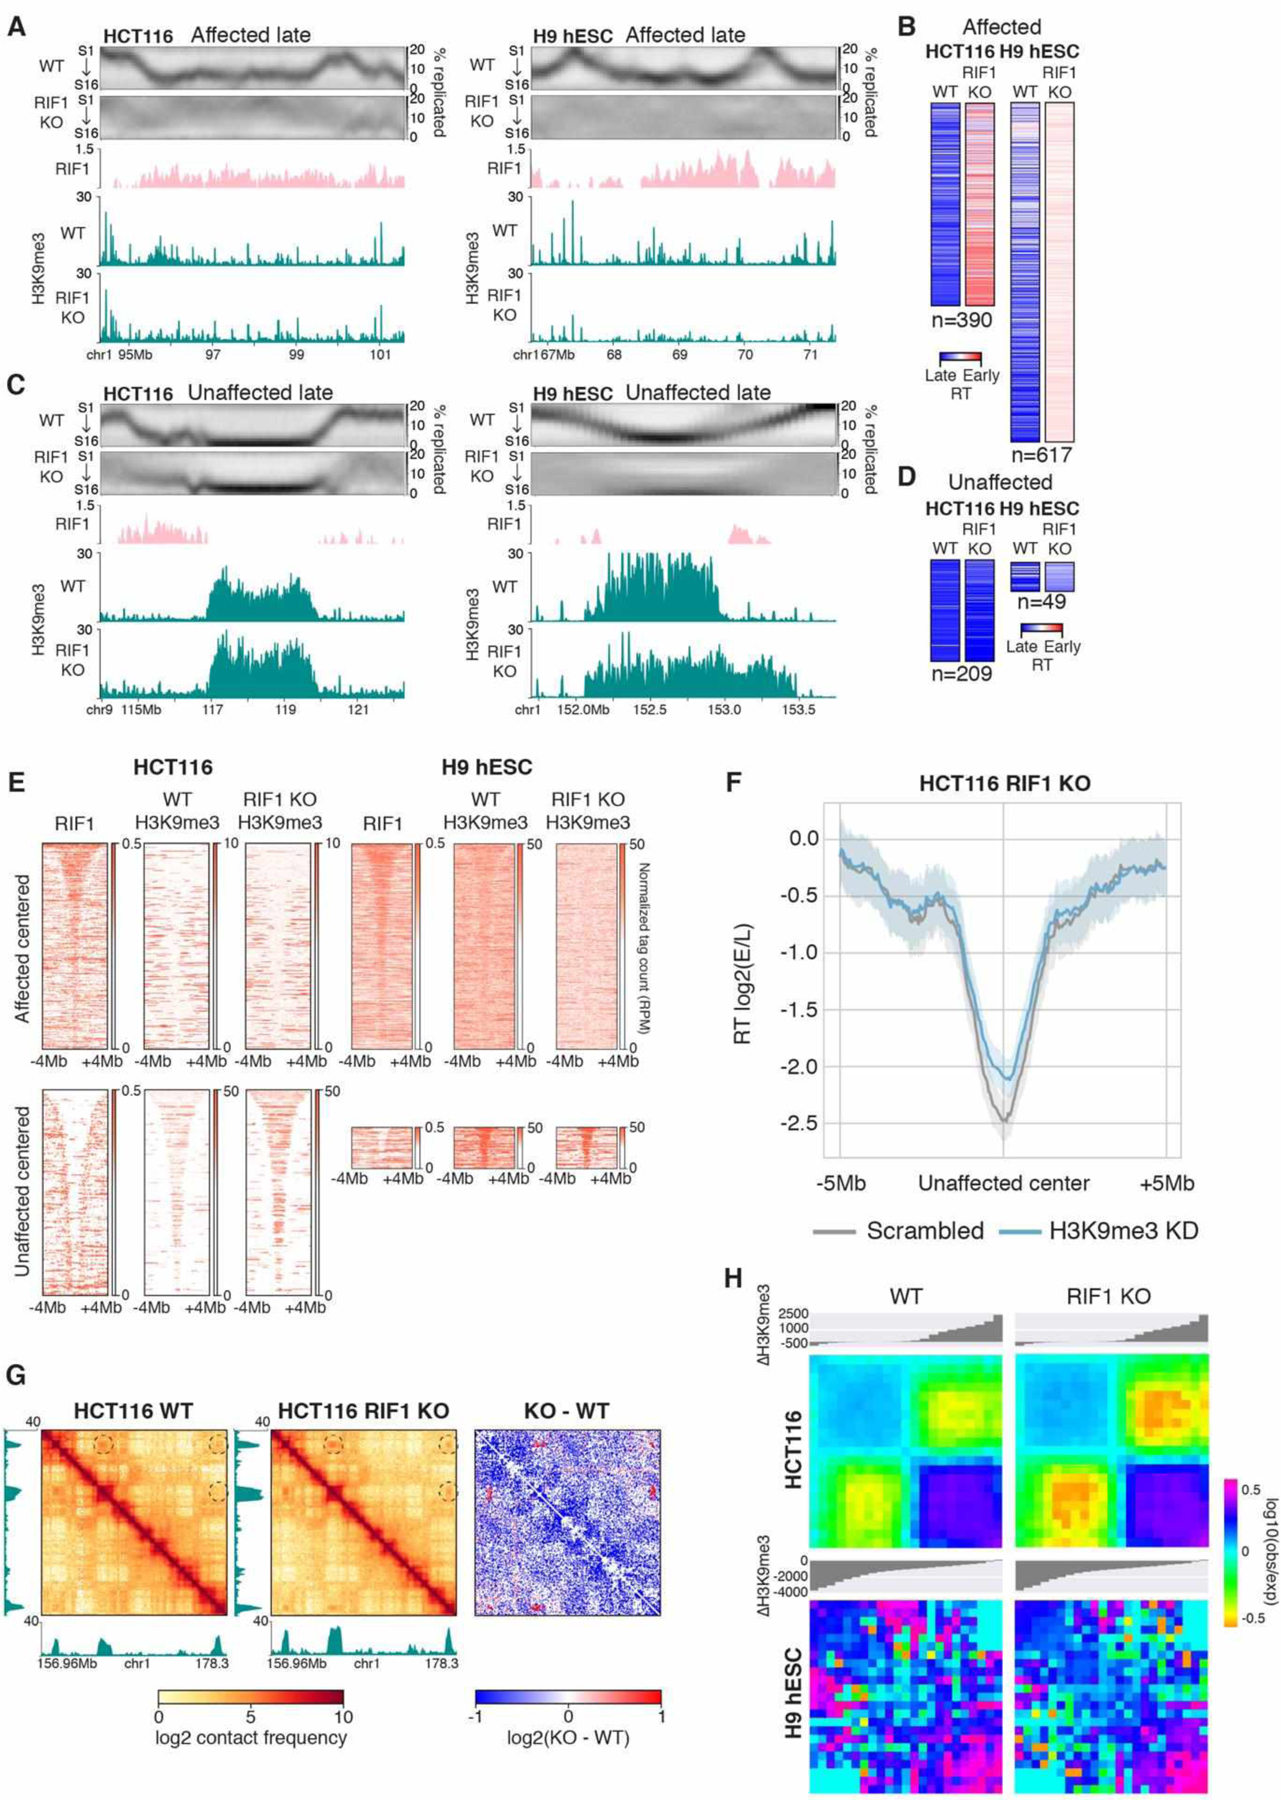
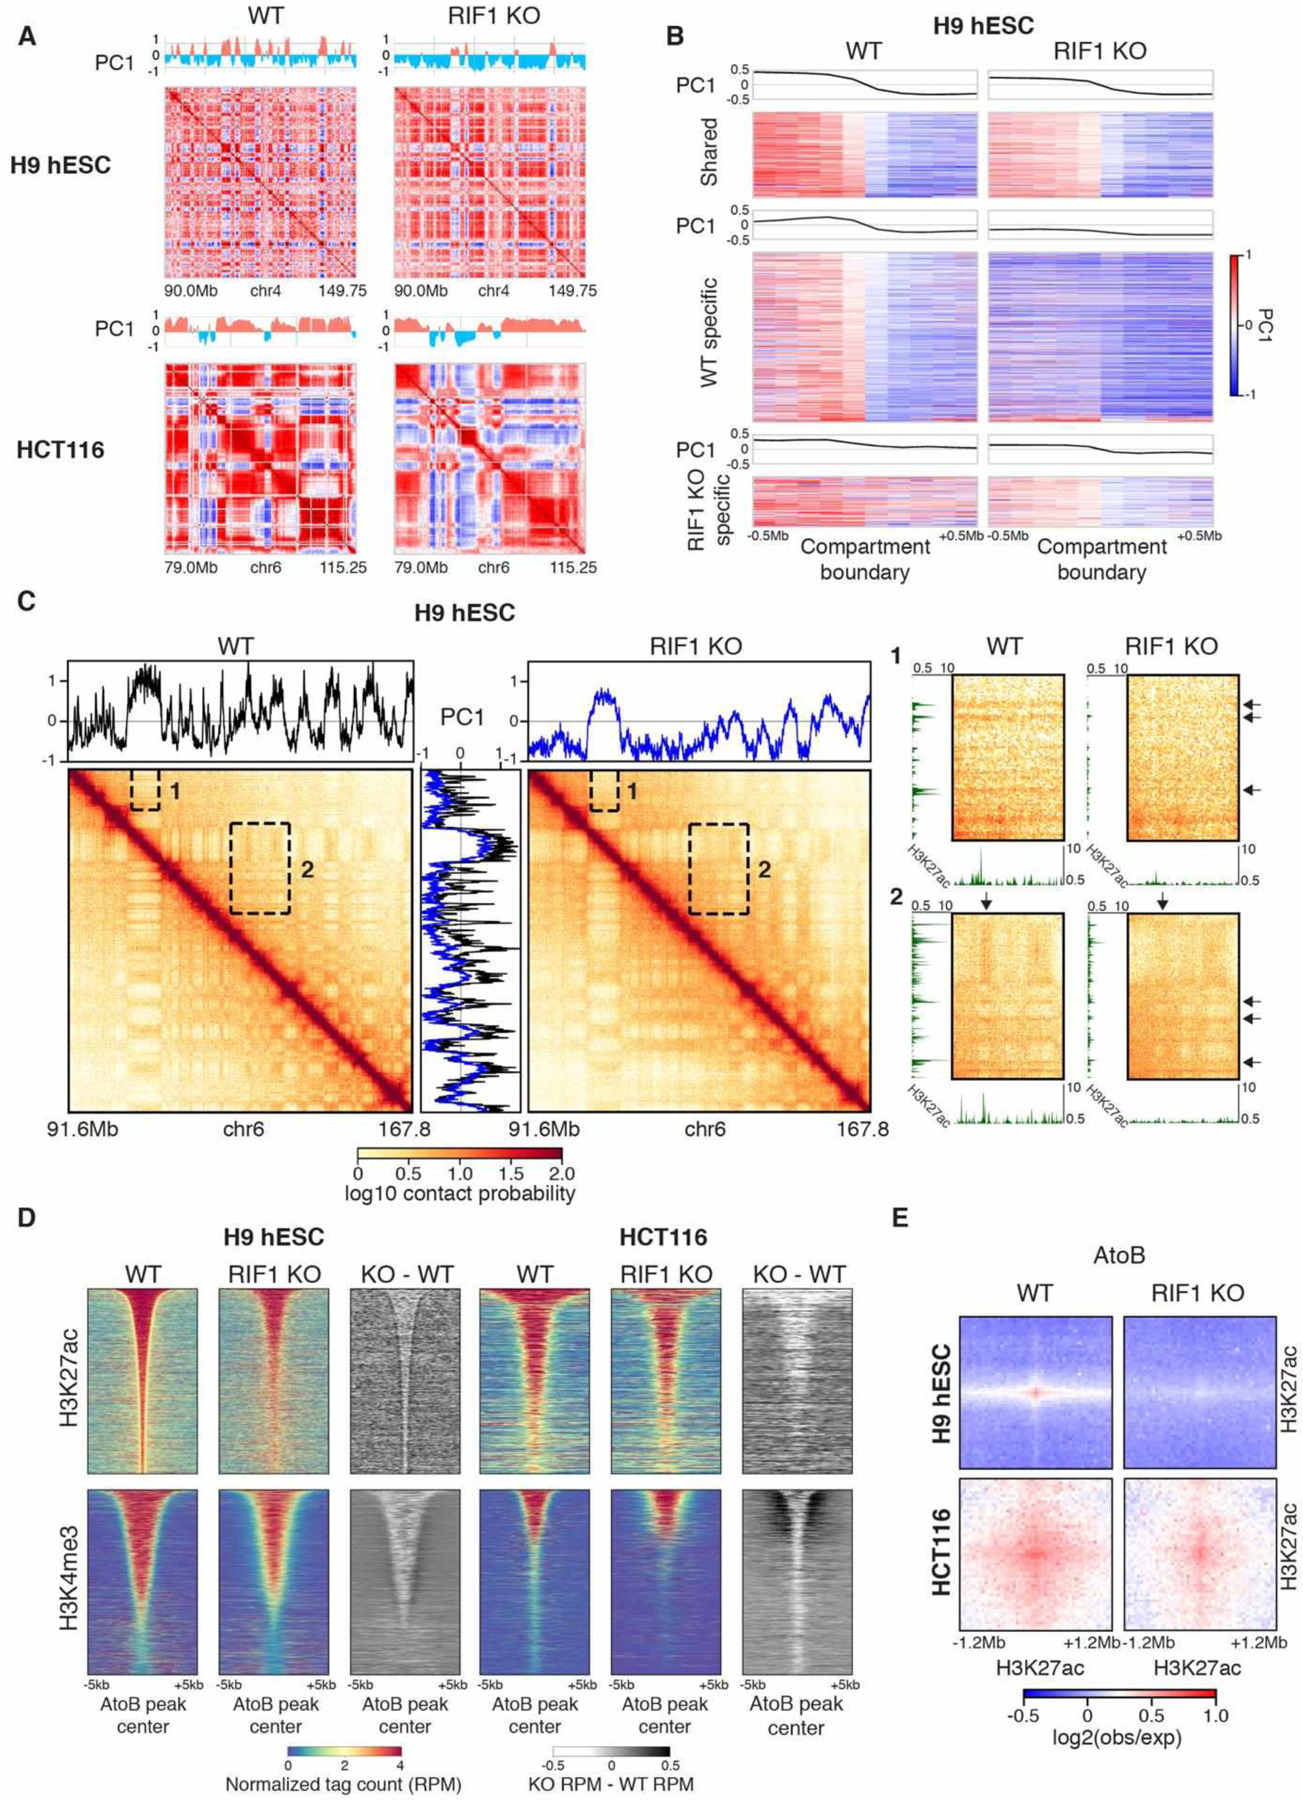
The temporal order of DNA replication [replication timing (RT)] is correlated with chromatin modifications and three-dimensional genome architecture; however, causal links have not been established, largely because of an inability to manipulate the global RT program. We show that loss of RIF1 causes near-complete elimination of the RT program by increasing heterogeneity between individual cells. RT changes are coupled with widespread alterations in chromatin modifications and genome compartmentalization. Conditional depletion of RIF1 causes replication-dependent disruption of histone modifications and alterations in genome architecture. These effects were magnified with successive cycles of altered RT. These results support models in which the timing of chromatin replication and thus assembly plays a key role in maintaining the global epigenetic state.


Conflict of interest statement

Competing interests: Authors declare no competing interests.

Figures

Fig. 1.
Fig. 1.. RIF1 controls RT by reducing cell to cell variation in replication timing.
(A) Log2(E/L) Repli-seq plots of Chr1 172.6–197.6 Mb in WT (black) and two RIF1 KO clones (blue and red) in H9 hESCs (top) and HCT116 (middle) and HAP1 (bottom) cell lines. (B) High resolution Repli-seq plots of Chr1 172.6–197.6 Mb in WT and RIF1 KO in H9 hESCs (top two) and HCT116 (bottom two); same locus as (A). (C) Cumulative percent-replicated plots for each IZ called in WT cells versus S phase fraction of 16 fraction Repli-seq color coded by their timing (red: early, blue: early mid, green: late mid, black: late). (D) Sigmoidal fitting of the percentage replicated (y-axis) against time in hours from population average RT (x-axis) for HAP1 WT (left) and RIF1 KO (right). The heatmaps (blue: WT and red: KO) represent the data spread for all 50kb bins genome wide in all cells. Dotted lines at 25% of cells replicated and 75% of cells replicated indicate the span of Twidth.
Fig. 2.
Fig. 2.. RT affected and unaffected late regions are distinct classes of chromatin.
(A) Affected late region at Chr1 94.3–101.6 Mb in HCT116 (left) and Chr1 66.75–71.4 Mb in H9 hESCs (right) showing from top to bottom: high resolution Repli-seq in WT and RIF1 KO cells, RIF1 fold enrichment in WT cells, and H3K9me3 ChIP-seq tag counts in WT and RIF1 KO cells. (B) Heat maps of RT indices for affected late regions in WT and RIF1 KO of HCT116 and H9 hESCs. (C) Unaffected late region at Chr9 113.95–122.3 Mb in HCT116 (left) and Chr1 151.7–153.75 Mb in H9 hESCs (right) showing the same panels as (A). (D) Heat maps of RT indices for unaffected late regions in WT and RIF1 KO of HCT116 and H9 hESCs. (E) RIF1 and H3K9me3 in HCT116 (left) and H9 hESC (right) WT or RIF1 KO cells centered on affected late regions (top) or unaffected late regions (bottom) ±4 Mb and sorted by size. (F) Mean log2(E/L) Repli-seq scores centered at all unaffected late regions ±5 Mb in HCT116 RIF1 KO scrambled control (grey) or H3K9me3 KD (blue) cells. Shadow represents 95% confidence interval. (G) H3K9me3 tag count tracks beside ICE normalized Hi-C and subtraction contact maps of HCT116 WT and RIF1 KO at Chr1 156.95–178.3Mb. Dotted circles denote regions of increased interaction. (H) Log10(obs/exp) aggregate interactions between late regions in WT and RIF1 KO HCT116 (top) and H9 hESCs (bottom). The interactions were binned into 11 equal segments, which were ranked by increasing ΔH3K9me3 where negative and positive values respectively indicate decrease and increase in H3K9me3 in RIF1 KO compared to WT.
Fig. 3.
Fig. 3.. RIF1 KO causes global alterations of compartments and epigenetic state.
(A) Correlation matrices and PC1 Eigenvector of Chr4 90.0–149.75Mb in WT and RIF1 KO H9 hESCs (top) and Chr6 79.0–115.25Mb in WT and RIF1 KO HCT116 (bottom). (B) Heatmaps of PC1 values centered on shared (top), WT specific (middle), and RIF1 KO specific (bottom) compartment boundaries ±0.5 Mb in WT and RIF1 KO H9 hESCs. (C) ICE normalized Hi-C contact map of Chr6 91.6–167.8 Mb in H9 hESC WT and RIF1 KO cells with accompanying PC1 Eigenvector plots (black: WT, blue: KO). To the right are expanded views of insets 1 and 2 with accompanying H3K27ac ChIP-seq plots. Arrows indicate compartments and ChIP-seq peaks that are lost upon RIF1 KO. (D) Normalized tag counts (RPM) signal and subtraction plots for H3K27ac and H3K4me3 centered on peaks within AtoB compartment switching regions ± 5kb in WT and RIF1 KO cells sorted by peak size. (E) Aggregate Hi-C log2(obs/exp) interactions between H3K27ac peaks within AtoB compartment switching regions ±1.2 Mb in WT and RIF1 KO cells.
Fig. 4.
Fig. 4.. Epigenome affects require DNA replication and occur during the first S phase after RIF1 degradation.
(A) Average log2(observed/expected) within top 10% A- (top panel) and B- (bottom panel) compartment in control (black line) and RIF1 KD (gray line) cells at G1, early S, middle S, and late S/G2 time points. (B) Interaction frequency differences between control and RIF1 KD at top 10% EtL and LtE regions at G1, early S, middle S and late S/G2 timepoints whose RT is indicated by average high resolution Repli-Seq heatmaps. (C) H3K27ac ChIP-seq of Chr7 128–131.9 Mb in control (top), RIF1 KD (middle), and domainogram (bottom) indicating -log2 (Benjamini-Hochberg adjusted p-values) calculated for the differences of control subtracted from KD tracks (Methods) at G1, early S, middle S, and late S/G2 time points. (D) Heatmap showing log2(KD/control) of H3K27ac peaks at G1, early S, middle S, and late S/G2 time points. (E) H3K9me3 ChIP-seq of Chr10 64.05–67.6Mb in control (top), RIF1 KD (middle), and domainogram (bottom) at G1, early S, middle S, and late S/G2 time points. (F) Heatmap showing log2(KD/control) of H3K9me3 peaks at affected regions at G1, early S, middle S, and late S/G2 time points. (G) H3K9me3 ChIP-seq of Chr1 4.05–5.0 Mb in control (top), RIF1 KD (middle), and domainogram (bottom) at G1, early S, middle S, and late S/G2 time points. (H) Heatmap showing log2(KD/control) of H3K9me3 domains at unaffected regions at G1, early S, middle S, and late S/G2 time points.
Fig. 5.
Fig. 5.. Epigenome affects are exacerbated as cell cycle without RT control.
(A) H3K27ac ChIP-seq of Chr7 128–131.9 Mb in control (top), RIF1 KD (middle), and domainograms (bottom) in control, 24hr, 48hr, 96hr degradation, and RIF1 KO. (B) Heatmap showing log2(KD/control) of H3K27ac tags at 24hr, 48hr, 96hr degradation, and RIF1 KO. (C) H3K9me3 ChIP-seq of Chr10 64.05–67.6Mb in control (top), RIF1 KD (middle), and domainograms (bottom) in control, 24hr, 48hr, 96hr degradation, and RIF1 KO. (D) Heatmap showing log2(KD/control) of H3K9me3 tags at affected regions in 24hr, 48hr, 96hr degradation, and RIF1 KO. (E) H3K9me3 ChIP-seq of Chr1 4.05–5.0 Mb in control (top), RIF1 KD (middle), and domainograms (bottom) in control, 24hr, 48hr, 96hr degradation, and RIF1 KO. (F) Heatmap showing log2(KD/control) of H3K9me3 tags at unaffected regions in 24hr, 48hr, 96hr degradation, and RIF1 KO. (G) Subtraction saddle plots of cis log2(observed/expected) contacts of control sample from 24hr, 48hr, 96hr degradation, and RIF1 KO sorted by ΔRT (KD RT - Control RT). (H) Model figure illustrating the role of RT in epigenome maintenance. In WT cells RIF1 prevents replication initiation factors from activating replication within repressive chromatin, allowing early replication of active chromatin which is then assembled with active histone marks (red flags) which self-interact to form the A compartment. Repressive chromatin is replicated in late S phase and is assembled with repressive histone marks (blue balls) which self-interact to form the B compartment. The B compartment is divided into regions that depend on RIF1 for late replication (affected) and those that do not (unaffected). RIF1 KO allows limiting replication initiation factors to associate heterogeneously with both active and repressive chromatin, delaying replication of the former and advancing replication of the latter. Delayed replication of active chromatin causes depletion of active histone marks and weakens interactions within the A compartment. Advanced replication of affected repressive chromatin causes depletion of repressive histone marks and weakens interactions within the affected B compartment hub. Unaffected B compartment hubs associated with repressive domains maintain their late replication in RIF1 KO and become enriched for repressive histone marks.

References

    1. Rhind N, Gilbert DM, DNA Replication Timing. Cold Spring Harb. Perspect. Biol 5, a010132 (2013). - PMC - PubMed
    1. Reverón-Gómez N, González-Aguilera C, Stewart-Morgan KR, Petryk N, Flury V, Graziano S, Johansen JV, Jakobsen JS, Alabert C, Groth A, Accurate Recycling of Parental Histones Reproduces the Histone Modification Landscape during DNA Replication. Mol. Cell (2018), doi:10.1016/j.molcel.2018.08.010. - DOI - PMC - PubMed
    1. Escobar TM, Oksuz O, Saldaña-Meyer R, Descostes N, Bonasio R, Reinberg D, Active and Repressed Chromatin Domains Exhibit Distinct Nucleosome Segregation during DNA Replication. Cell (2019), doi:10.1016/j.cell.2019.10.009. - DOI - PMC - PubMed
    1. Zhang J, Xu F, Hashimshony T, Keshet I, Cedar H, Establishment of transcriptional competence in early and late S phase. Nature (2002), doi:10.1038/nature01150. - DOI - PubMed
    1. Lande-Diner L, Zhang J, Cedar H, Shifts in Replication Timing Actively Affect Histone Acetylation during Nucleosome Reassembly. Mol. Cell 34, 767–74 (2009). - PMC - PubMed

Publication types