. 2021 Apr 23;372(6540):385-393.
doi: 10.1126/science.abe0690.

Conserved genetic signatures parcellate cardinal spinal neuron classes into local and projection subsets

Affiliations

Conserved genetic signatures parcellate cardinal spinal neuron classes into local and projection subsets

Peter J Osseward 2nd et al. Science. .

Abstract

Motor and sensory functions of the spinal cord are mediated by populations of cardinal neurons arising from separate progenitor lineages. However, each cardinal class is composed of multiple neuronal types with distinct molecular, anatomical, and physiological features, and there is not a unifying logic that systematically accounts for this diversity. We reasoned that the expansion of new neuronal types occurred in a stepwise manner analogous to animal speciation, and we explored this by defining transcriptomic relationships using a top-down approach. We uncovered orderly genetic tiers that sequentially divide groups of neurons by their motor-sensory, local-long range, and excitatory-inhibitory features. The genetic signatures defining neuronal projections were tied to neuronal birth date and conserved across cardinal classes. Thus, the intersection of cardinal class with projection markers provides a unifying taxonomic solution for systematically identifying distinct functional subsets.


Conflict of interest statement

Competing interests: The authors declare no competing interests.

Figures

Fig. 1.
Fig. 1.. scRNA-seq identifies relationships among groups of spinal neurons.
(A) Lumbar segments from P0 Vglut2:Cre; Ai14 and Vgat:Cre; Ai14 neonates (two females and one male from each litter) were microdissected. tdTomato+ cells were sorted and pooled as one sample before scRNA-seq. Using marker analyses and quality control measures, 6743 cells were identified as neurons (94.4% of total cells detected). These neurons had 1012 median genes per cell and 1606 median unique molecular identifiers (UMIs) per cell. (B) UMAP visualization of neurons identifies that glutamatergic neurons and GABAergic neurons largely segregate in UMAP space. (C) Forty-five identified clusters are color coded in UMAP space. (D) Colored dots with numbers correspond to clusters from Fig. 1C. As expected, clusters corresponded to known cardinal neuron classes, defined by their marker expression. V1 and V2b markers were found in the same clusters (12). Several clusters are not shown because they were not enriched for obvious cardinal class marker genes (table S1). (E) Schematic outlining methods to identify neuronal subtypes. (Top) Dimensionality reduction tools can be used to define the maximum number of genetically distinct clusters. Functions must be independently defined for each cluster. (Bottom) Hierarchical comparisons of neuronal populations can be used to define branch points. The functional differences at the branch points can be used to identify increasingly more specific neuronal attributes linked to function. (F) Schematic of analysis used to investigate the higher-order relationships across spinal neuron populations conducted with iterative k-means 2 divisive clustering. Data for each color-coded division are indicated for (G) to (K). (G to K) (Left) UMAP color coded according to identified division. (Right) Volcano plot depicting differentially expressed genes across each k-mean division. [(G) and (I)] Further analysis of highlighted genes are available in Fig. 2 and fig. S2. [(H), (J), and (K)] Glutamatergic- and GABAergic-related genes are highlighted. (G) Group-E: 3360 cells, Jaccard similarity [across bootstraps (supplementary materials, materials and methods)] = 0.960; group-H: 3383 cells, Jaccard similarity = 0.959. (H) Group-E (Glut): 1851 cells, Jaccard similarity = 0.960; group-E (GABA): 1509 cells, Jaccard similarity = 0.922. (I) Group-Z: 1707 cells, Jaccard similarity = 0.867; group-N: 1676 cells, Jaccard similarity = 0.809. (J) Group-N (Glut): 1040 cells, Jaccard similarity = 0.791; group-N (GABA): 636 cells, Jaccard similarity = 0.613. (K) Group-Z (Glut): 768 cells, Jaccard similarity = 0.769; group-Z (GABA): 939 cells, Jaccard similarity = 0.760.
Fig. 2.
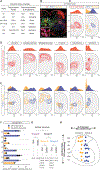
Fig. 2.. Branch points in the hierarchical comparisons define spinal neuron groups with discrete locations.
(A to D) (Top) Immunostaining against representative markers for group-E, -H, -N, and -Z neurons in lumbar segments at P0. All images are 20-μm cryosections. Scale bars, 100 μm. (Bottom) Spatial analysis of representative markers displayed on right half of lumbar spinal cord. Contours indicate density of representative markers at the 10th to 90th percentiles. y axis = 0 represents the top end of the central canal, and x axis = 0 represents the midline. (E) Matrix of pairwise mean colocalization rates between group-Z, -N, and -E markers. “N.M.” (blue boxes with X) indicates not measured because of antibody incompatibility (figs. S4 and S5). NeuN+ Nfib+ neurons were quantified to exclude Nfib+ glial cells. (F) Matrix of pairwise weighted Jaccard distance between group-Z, -N, and -E markers. 1.0, no overlap; 0, complete overlap. Hierarchical clustering dendrogram reveals closer spatial associations among marker genes within each group than between separate groups. (G) Immunostaining of Zfhx3 and NeuroD2 in lumbar spinal cord at P0 reveals low incidences of colocalization. Cryosection, 20 μm. Scale bar, 100 μm. This image is a composite of Fig. 2, C and D. (H) (Left) Transcriptomic hierarchy of lumbar spinal neurons. (Right) Schematic of spatial enrichments of group-Z, -N, and -E neurons.
Fig. 3.
Fig. 3.. The group-N and -Z division is linked to neuronal birth date.
(A) Cells along the entire spinal cord were isolated from two E12.5 embryos from two litters and were subjected to scRNA-seq as separate samples. These datasets were merged post hoc. We bioinformatically identified 2945 neurons, which were selected for further analysis (fig. S8). These neurons had 3566 median genes per cell and 12,189 median UMIs per cell. Glutamatergic and GABAergic neurons are labeled on the UMAP. (B) Cardinal classes segregate in UMAP space. Twenty-seven clusters were identified (fig. S8). On the basis of the top 20 differentially expressed genes for each cluster, cardinal classes were identified. Clusters from the same cardinal class were merged (table S3). (C) Higher-order groups of spinal neurons were identified with k-means 2 divisive clustering (Fig. 1F). Embryonic neurons are color coded according to the first k-means 2 division. Population 1: 1971 cells, Jaccard similarity = 0.978; population 2: 974 cells, Jaccard similarity = 0.955. Further divisions are provided in fig. S9. (D) The first k-means 2 division of embryonic neurons largely corresponded to group-N and group-Z identity established from P0: 79% of population 1 [(C), blue cells] neurons expressed group-Z markers, and 84% of population 2 [(C), red cells] neurons expressed group-N markers. Thus, the k-means 2 division identifies group-N and group-Z neurons at an early embryonic stage. (E) EdU was injected into multiple pregnant females (E10.5 to E14.5), and lumbar segments were collected from their pups at P0. Representative markers Zfhx3 and NeuroD2 were used to birth date group-Z and group-N neurons, respectively. The peak birth date for group-Z neurons was E10.5, whereas the peak for group-N neurons was E13.5. Each dot represents the colocalization rate for a single animal. Welch one-way analysis of variance (ANOVA) comparing every time point to every other time point, with Dunnett T3 correction for multiple comparisons. *P ≤ 0.05, **P ≤ 0.01, ***P ≤ 0.001. Cryosections, 20 μm. Scale bars, 100 μm. (F) Immunostaining of Zfhx3 and NeuroD2 in lumbar spinal cord at P70. The mediolateral location and marker expression patterns in adult P70 animals were similar to P0. Cryosection, 25 μm. Scale bar, 100 μm. (G) Summary. Group-Z neurons are born before group-N neurons. Molecular markers for both groups are expressed embryonically, postnatally, and into adulthood. Markers for group-Z and group-N neurons are not coexpressed.
Fig. 4.
Fig. 4.. Each cardinal class is a mixture of both group-N and -Z neurons.
(A) Summary of mouse lines used to label cardinal classes. Each cardinal class has a characteristic transcription factor expression, neurotransmitter, and axon laterality profile. (B) Atoh1:Cre was crossed to a tdTomato reporter to indelibly label dI1 neurons. Immunostaining for NeuroD2 (group-N) and Zfhx3 (group-Z) reveals discrete dI1 populations marked by the two genes. Asterisk in the dorsal horn indicates ectopic sensory fibers from the DRG (29). Cryosection, 20 μm. Scale bar, 100 μm. (C) (Left) Contours indicate density of dI1 neurons at the 10th to 90th percentiles. Mediolateral density displayed above a two-dimensional contour plot. (Right) Contours indicate densities of group-N and group-Z dI1 neurons at 50th to 90th percentiles. Group-N dI1 neurons were generally located medially, whereas group-Z dI1 neurons were located laterally. (D) Contours and mediolateral densities of indicated cardinal classes. Contours indicate density of cardinal class neurons at the 10th to 90th percentiles. Dorsoventral densities are provided in fig. S14. (E) Distributions of group-N and group-Z neurons within each cardinal class. Contours indicate density of interneuron subpopulations at the 50th to 90th percentiles. Each cardinal class was split into medial group-N and lateral group-Z neurons. (F) Quantification of group-Z and group-N neurons within each cardinal class. Each dot indicates one animal. The ratio of group-N to -Z neurons varies across cardinal classes. (G) Summary of the cardinal class types within the hierarchical comparisons of neurons. (H) Stylized overview of cell spatial relationships defined by coexpression of cardinal and N-Z markers. Cardinal classes have stereotyped dorsoventral settling positions. Neurons composing each cardinal class are split into medial group-N and lateral group-Z cells.
Fig. 5.
Fig. 5.. Projection and long-range neurons express group-Z markers.
(A) Neuronal morphology-related GO terms are enriched in group-Z compared with group-N neurons (table S4). (B) Heatmap of neurofilament genes expressed in spinal neurons showing enrichment in group-Z neurons (log2 scale). (C) Schematic of retrograde tracing analysis. CTB was injected into the forebrain (thalamus), cerebellum (vermis), medulla, and cervical spinal cord, respectively, to retrogradely label long-range projection neurons within the spinal cord. Injections were done in neonates, and tissue was collected 4 to 5 days later. (D to G) Immunostaining against group-Z (Zfhx3), -E (Ebf1), and -N (NeuroD2 and Prox1) markers combined with indicated CTB labeling. White arrowheads indicate group-Z long-range neurons. Each dot on the graph indicates the colocalization rate of one animal. Cryosections, 20 μm. Scale bars, 100 μm. Welch one-way ANOVA comparing Zfhx3 to every other marker, with Dunnett T3 correction for multiple comparisons. *P ≤ 0.05, **P ≤ 0.01, ***P ≤ 0.001. (D) Spinothalamic neurons within cervical segments (region of greatest abundance) expressed group-Z markers. Spinothalamic neurons within lumbar segments are shown in fig. S17. (E) Spinocerebellar neurons within lumbar segments expressed group-Z markers. Additional markers are provided in fig. S18. (F) Spinomedullary neurons within lumbar segments expressed group-Z markers. Additional markers are provided in fig. S19. (G) Cervicolumbar neurons expressed group-Z markers. Additional markers are provided in fig. S20.
Fig. 6.
Fig. 6.. A unified taxonomic index of spinal neurons.
(A) Summary of relationships of neuronal attributes. Neuronal subtypes can be viewed as a composite of distinct properties that fall into a range of categories (circles). Neuronal subtypes arise by joining different combinations of these attributes. Cardinal class and N-Z markers simplify the task of defining neuronal subtypes because both correspond to multiple neuronal features (magenta and green lines). (B) Summary of neuronal subsets defined by coexpression of cardinal class markers and N-Z labels. This matrix provides a simple labeling index to define neuronal subsets. The postsynaptic targets of group-Z neurons within each cardinal population are predicted from projection neuron–tracing studies (26, 29, 31, 37, 38). Local connections and collaterals are not shown (26, 27).

References

    1. Lu DC, Niu T, Alaynick WA, Front. Mol. Neurosci 8, 25 (2015). - PMC - PubMed
    1. Lai HC, Seal RP, Johnson JE, Development 143, 3434–3448 (2016). - PMC - PubMed
    1. Kiehn O, Nat. Rev. Neurosci 17, 224–238 (2016). - PMC - PubMed
    1. Koch SC, Acton D, Goulding M, Annu. Rev. Physiol 80, 189–217 (2018). - PMC - PubMed
    1. Todd AJ, Nat. Rev. Neurosci 11, 823–836 (2010). - PMC - PubMed

Publication types

Substances