. 2021 Apr 22;12(1):2388.
doi: 10.1038/s41467-021-22571-9.

Circadian clock dysfunction in human omental fat links obesity to metabolic inflammation

Affiliations

Circadian clock dysfunction in human omental fat links obesity to metabolic inflammation

Eleonore Maury et al. Nat Commun. .

Abstract

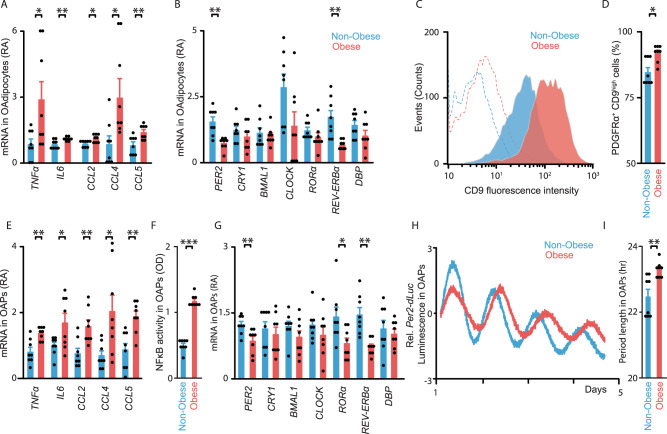
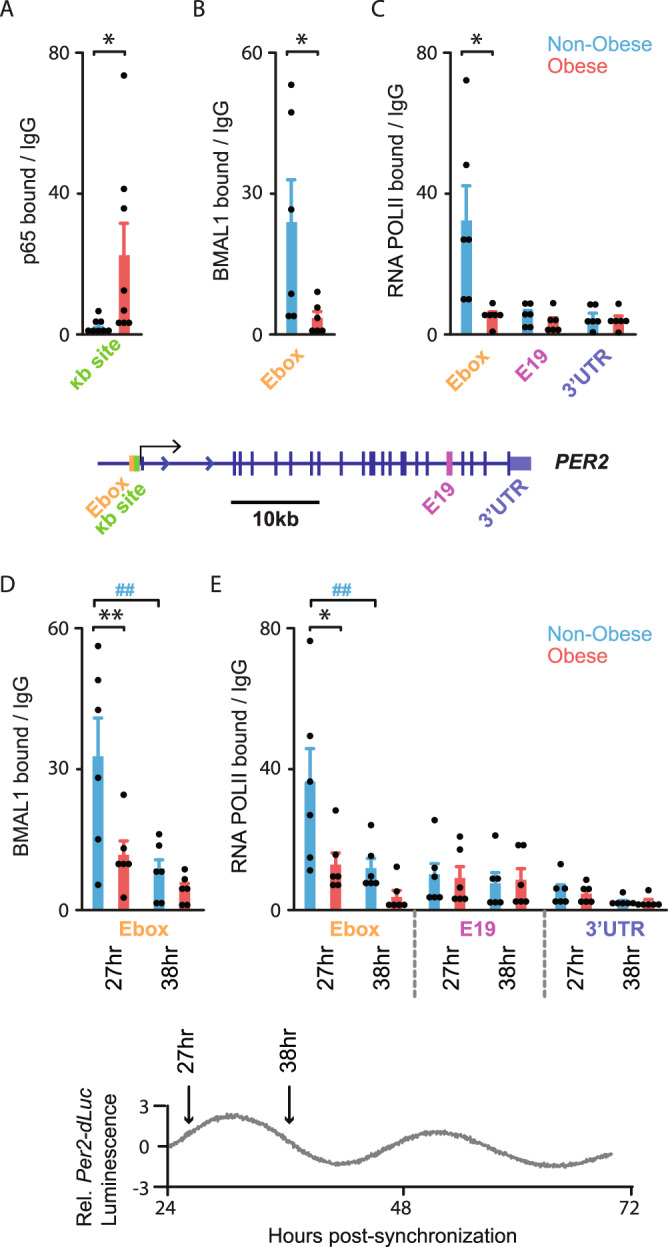
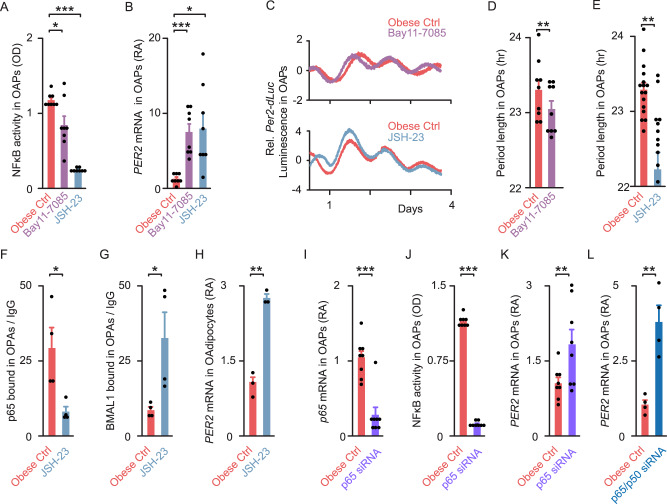
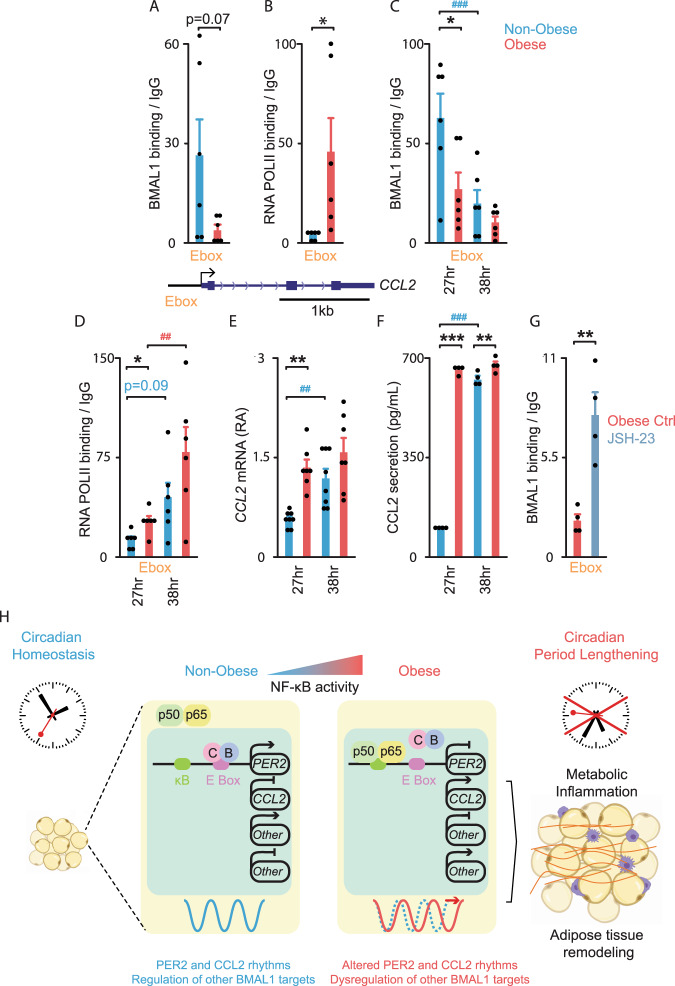
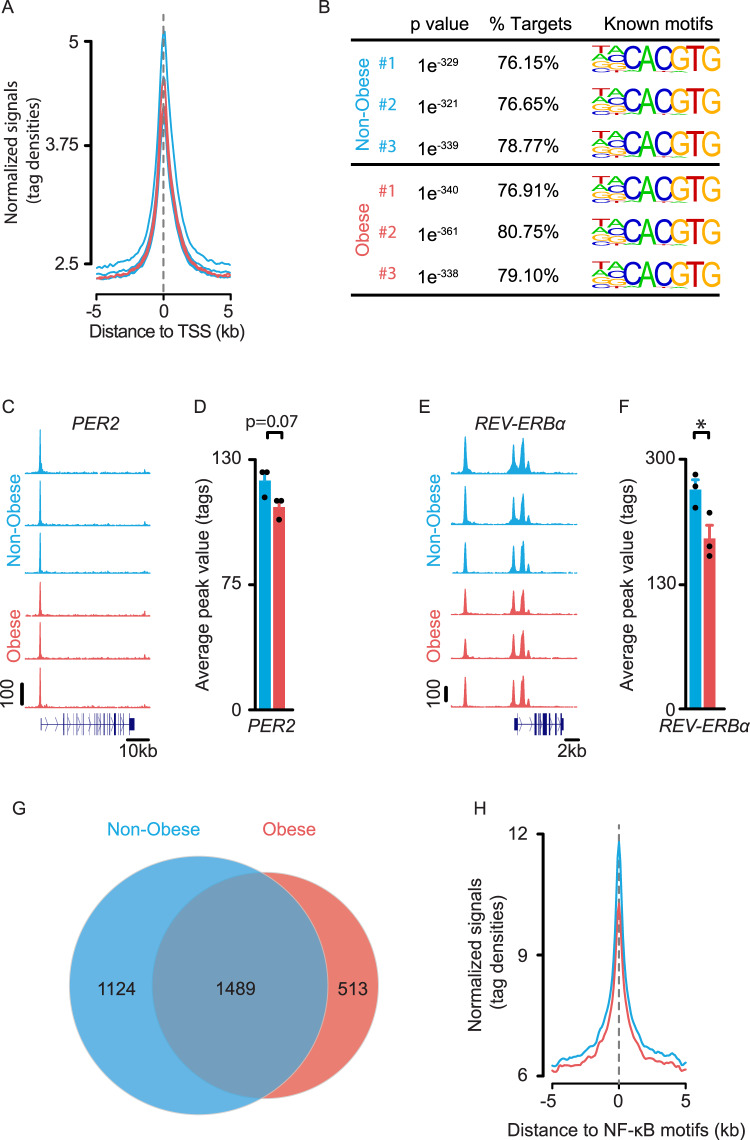
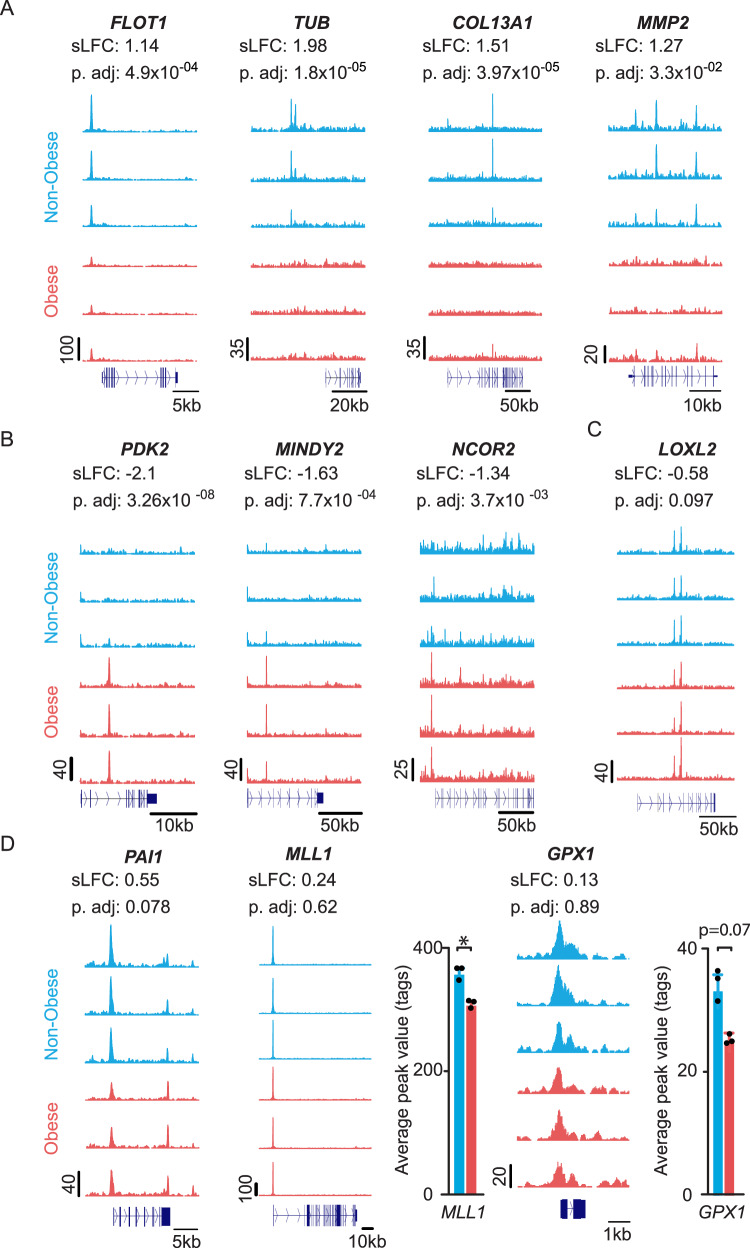
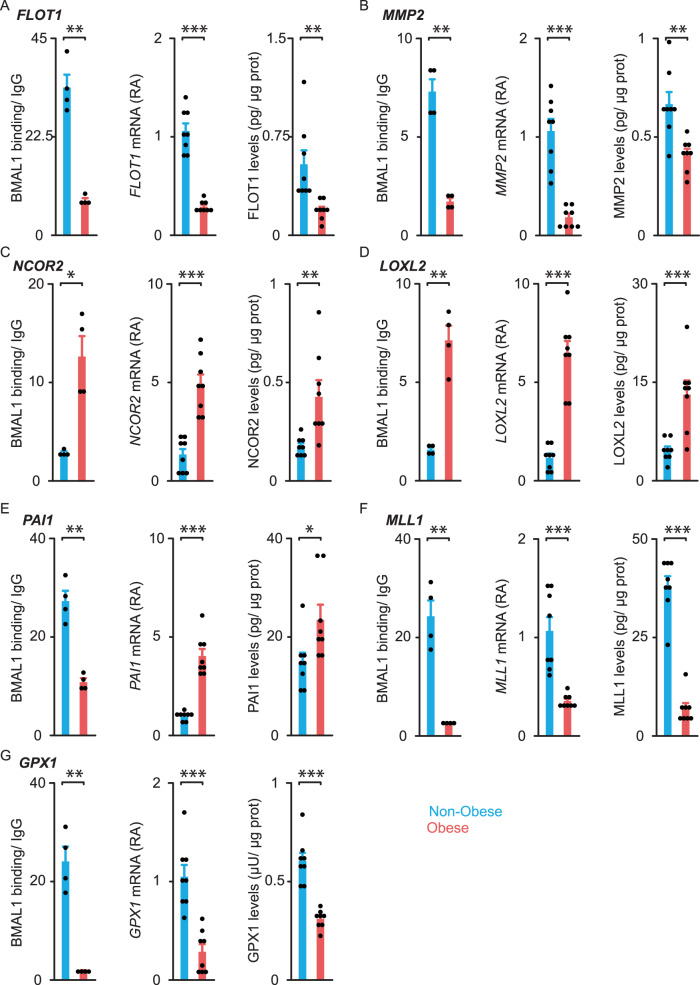
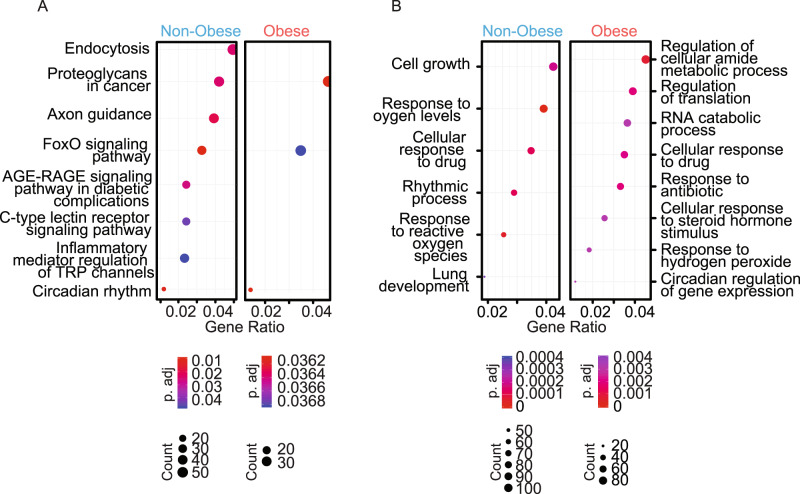
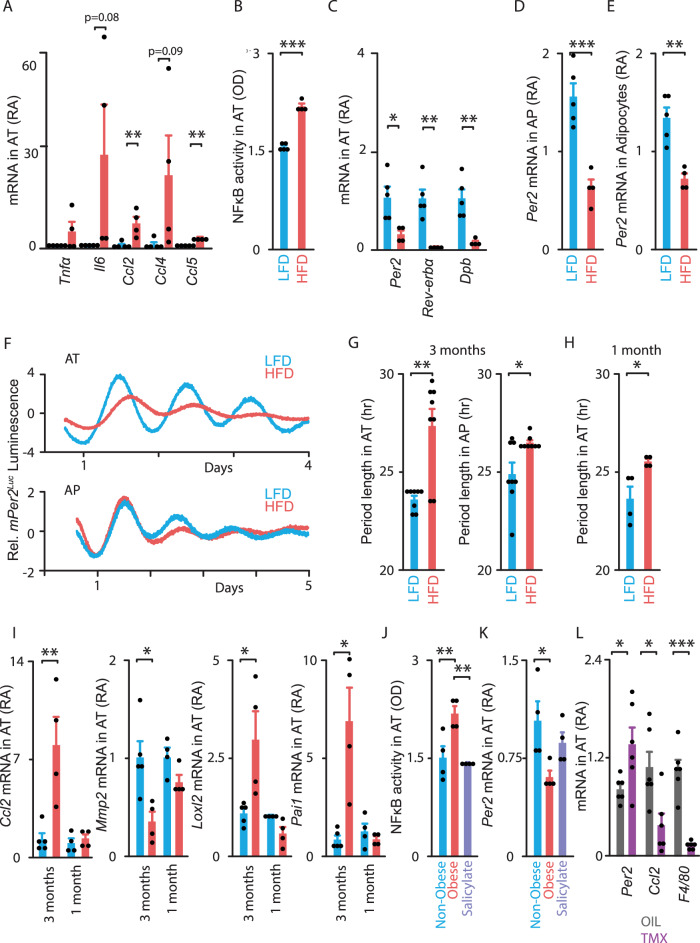
To unravel the pathogenesis of obesity and its complications, we investigate the interplay between circadian clocks and NF-κB pathway in human adipose tissue. The circadian clock function is impaired in omental fat from obese patients. ChIP-seq analyses reveal that the core clock activator, BMAL1 binds to several thousand target genes. NF-κB competes with BMAL1 for transcriptional control of some targets and overall, BMAL1 chromatin binding occurs in close proximity to NF-κB consensus motifs. Obesity relocalizes BMAL1 occupancy genome-wide in human omental fat, thereby altering the transcription of numerous target genes involved in metabolic inflammation and adipose tissue remodeling. Eventually, clock dysfunction appears at early stages of obesity in mice and is corrected, together with impaired metabolism, by NF-κB inhibition. Collectively, our results reveal a relationship between NF-κB and the molecular clock in adipose tissue, which may contribute to obesity-related complications.


Conflict of interest statement

The authors declare no competing interests.

Figures

Fig. 1
Fig. 1. Expression of pro-inflammatory factors and circadian clock function are altered in human omental adipocytes and precursor cells.
A, B Expression of pro-inflammatory (cytokines and chemokines) (A) and core clock (B) genes in non-synchronized Omental Adipocytes (OAdipocytes) from non-obese (blue) or obese (red) patients. Values are displayed as mRNA Relative Abundance (RA). C, D Detection of the cell-surface glycoprotein CD9 in PDGFRα+ CD34+ CD31 CD45 adipocyte precursors (OAPs) from non-obese (blue) and obese (red) patients by flow cytometry. Phycoerythrin fluorescence (CD9) and Alexa Fluor red (CD140a) have been detected simultaneously, to determine the frequency of PDGFRα+ CD9high cells. C One representative trace (i.e., OAPs from one patient) per condition is shown. Dashed lines are the negative controls. D Percentage of CD9high OAPs in non-obese vs. obese patients. E Expression of pro-inflammatory genes in non-obese or obese OAPs. F NF-κB activity in non-obese or obese OAPs (phosphorylated p65, in Optical density, OD). G Expression of core-clock genes in non-obese or obese OAPs. H Normalized bioluminescence of Per2-dLuc reporter oscillations in synchronized OAPs obtained from non-obese (blue line) or obese (red line) patients. One representative trace per group is shown. I Period length of Per2-dLuc bioluminescence in hours (hr). All data are represented as mean ± SEM with n = 8 patients/ group. *p < 0.05, **p < 0.01, ***p < 0.01, unpaired two-tailed t test. See also Supplementary Fig. 1.
Fig. 2
Fig. 2. NF-κB p65 activation in human obesity results in decreased BMAL1-mediated transcription of PER2.
ChIP analyses of NF-κB p65, BMAL1, and RNA POLII on PER2 sites in OAPs, as indicated. Cells were either non-synchronized (AC) or harvested 27 h and 38 h post-synchronization (D, E). A p65 bound to PER2 κB site in the promoter (~200 bp upstream to TSS, represented by a single arrow on PER2 gene), B, D BMAL1 to PER2 E-box (~400 bp upstream to TSS), C, E RNA POLII Ser-5P CTD repeat (RNA POLII) to PER2 E-box vs. exon 19 (E19) and untranslated region (UTR) in OAPs from non-obese (blue) or obese patients (red). Collection times are depicted by 2 arrows on the inserted Per2-dLuc reporter trace (bottom panel). Results are expressed in fold enrichment over IgG. Data are represented as mean ± SEM; n = 8 (A) or n = 6 (BE) independent cultures (i.e., run at different times and for each time, from a new vial of cryopreserved OAPs) from 4 (A) or 3 (BE) subjects in each non-obese and obese group. AC *p < 0.05, **p < 0.01, unpaired two-tailed t-test (non-obese vs. obese comparisons); D, E the effect of BMI (non-obese/obese) and time was tested by two-way ANOVA followed by post hoc Sidak’s test, *p < 0.05, **p < 0.01, unpaired measures (non-obese vs. obese), ##p < 0.01, paired measures (27 h vs. 38 h). See also Supplementary Fig. 2.
Fig. 3
Fig. 3. NF-κB inhibition restores circadian period and BMAL1 binding in adipocyte precursors from obese patients.
A NF-κB activity in non-synchronized obese OAPs treated with either DMSO (vehicle, Ctrl, red), 10 μM NF-κB inhibitor Bay11-7085 (purple) or JSH-23 (gray); n = 8 patients. B PER2 gene expression in non-synchronized obese OAPs treated with either DMSO (Ctrl), 10 μM NF-κB inhibitor Bay11-7085 or JSH-23. Values are displayed as mRNA RA compared to values of untreated obese Ctrl OAPs; n = 8 patients. CE Normalized bioluminescence of Per2-dLuc reporter oscillations in synchronized obese OAPs following in vitro treatment with 10 μM NF-κB inhibitors Bay11-7085 or JSH-23, vs. DMSO (Ctrl). C One representative trace per condition is shown. D, E Period length of Per2-dLuc bioluminescence in hour; n = 9 (D) or n = 16 (E) independent cultures per treatment from 5 (D) or 8 (E) patients. F, G ChIP analysis of NF-κB p65 and BMAL1 on PER2 sites. F p65 bound to PER2 κB site and G BMAL1 bound to PER2 E-box in non-synchronized obese OAPs, either treated with 10 μM JSH-23 or untreated (DMSO, Ctrl). Results are expressed in fold enrichment over IgG; n = 4 independent cultures from two obese patients. H PER2 gene expression in non-synchronized obese OAdipocytes treated with DMSO (Ctrl) or JSH-23; n = 3 patients. I Expression of p65 in non-synchronized obese OAPs, transfected with siRNA against human p65 (RELA, violet) or non-targeting siRNA (Ctrl, red); n = 8 independent cultures from four patients. J NF-κB activity in obese OAPs transfected with either siRNA against human p65 or non-targeting siRNA; n = 8 patients. KL PER2 gene expression in non-synchronized obese OAPs transfected with either siRNA against human p65 (RELA, violet), siRNA against p65/p50 (RELA/NFKB1, dark blue) or non-targeting siRNA (Ctrl, red); n = 4 independent cultures from two patients (L), or n = 8 independent cultures from four patients (K). Data are represented as mean ± SEM. *p < 0.05, **p < 0.01, ***p < 0.001, by one-way repeated ANOVA followed by post hoc Dunnett’s test (A, B) or paired two-tailed t-test (DL). See also Supplementary Fig. 3.
Fig. 4
Fig. 4. BMAL1-mediated transcription of CCL2 is altered in adipocyte precursors from obese patients.
AD ChIP analyses of BMAL1 and RNA POLII on CCL2 promoter in non-obese (blue) or obese (red) OAPs, either non-synchronized or harvested 27 h and 38 h post-synchronization. Mean ± SEM in fold enrichment over IgG; n = 6 independent cultures/group from three patients in each non-obese and obese group. E CCL2 gene expression in synchronized non-obese vs. obese OAPs. Mean ± SEM in mRNA RA, n = 8 (non-obese) and n = 7 (obese) independent cultures from four patients in each group. F Measurement of CCL2 secretion in synchronized non-obese vs. obese OAPs, between 27–33 h and 38–44 h post-synchronization. Mean ± SEM in  pg/ml; n = 4 patients/group. G ChIP analyses of BMAL1 in non-synchronized obese OAPs exposed to 10 μM JSH-23 (gray) vs. untreated (DMSO, Ctrl, red). Mean ± SEM in fold enrichment over IgG; n = 4 independent cultures from two patients. *p < 0.05, unpaired two-tailed t-test (A, B); **p < 0.01, paired two-tailed t-test (G); The effect of condition and time was tested by two-way ANOVA followed by post hoc Sidak’s test (CF), *p < 0.05, **p < 0.01, ***p < 0.001 for unpaired measures (non-obese/obese), #p < 0.05, ##p < 0.01, ###p < 0.001 for paired measures (27 h vs. 38 h or 27–33 h and 38–44 h). H Proposed model of obesity linking circadian clock dysfunction in human omental fat and metabolic inflammation. The molecular clock is encoded by transcription–translation feedback loops composed of activators BMAL1 (B) and CLOCK (C) that induce the transcription of repressors, the most important being PER2. PER2 feeds back to inhibit the forward limb. This process generates a rhythm of ~24 h. In obesity, NF-κB activity is increased: increased NF-κB p65 binding prevents BMAL1 binding to PER2 E-box, thereby reducing BMAL1-mediated transcription of PER2 and inducing lengthening of the circadian period. The concomitant decreased BMAL1 binding to CCL2 leads to actively transcribed CCL2 and subsequent upregulated CCL2 secretion. In obesity, increased or decreased BMAL1 binding at other loci was associated with an altered production of the targets (“Other”; BMAL1 exerting a transactivator/ repressor role, see infra), contributing to metabolic inflammation and adipose remodeling (macrophages, purple; fibrosis, red). See also Supplementary Fig. 3.
Fig. 5
Fig. 5. Obesity repositions BMAL1 binding genome-wide in human adipocyte precursors.
A Average plot of BMAL1 ChIP-seq reads on the target gene promoters near TSS in OAPs from non-obese (n = 3; blue) and obese (Class III) patients (n = 3; red). B Top known HOMER motifs enriched at BMAL1-binding sites from ChIP-seq analysis in OAPs from non-obese and obese patients. The highest ranking motif for each patient is shown and corresponds to the canonical E-box motifs. Significant motif enrichment was determined using a cumulative binomial statistical test. CF University of California at Santa Cruz (UCSC) genome browser images of BMAL1 ChIP-seq tracks at clock repressors and related histograms. UCSC genome browser images of BMAL1 ChIP-seq tracks at PER2 (C) and REV-ERBα (E). Normalized tag counts are indicated on the Y-axis and maximum track height is the same for all samples (n = 3 subjects/group). The orientation for each gene is indicated below each browser track. D, F Respective histograms depicting the average peak value per condition are also represented. Data are means ± SEM, *p < 0.05, by unpaired two-tailed t-test. G VENN diagram depicting the number of BMAL1 peaks and overlap in non-obese and obese OAPs (Raw data in OAPs from 3 patients/ group are provided in Source Data). H Average plot of BMAL1 ChIP-seq reads depicting their distance to NF-κB consensus motifs on target genes. NF-κB sites were obtained from UCSC Genome Browser’s Factorbook data, which were lifted over from hg38. The normalized signal files for each group (average n = 3 subjects/group) were merged to show that BMAL1 binds in close proximity to NF-κB consensus motifs. See also Supplementary Fig. 4.
Fig. 6
Fig. 6. Examples of targets differentially bound by endogenous BMAL1 in OAPs from non-obese and obese patients.
AD UCSC genome browser images of BMAL1 ChIP-seq tracks at clock repressors in OAPs (n = 3 subjects/group). Normalized tag counts are indicated on the Y-axis. The differential regions were identified using DESeq2, with shrunken Log2 Fold Change (sLFC) non-obese/obese and false discovery rate- adjusted p-value (p.adj), indicated above each browser track. The orientation for each gene is indicated below each browser track. A Targets with specifically high BMAL1 occupancy in non-obese OAPs. B Targets with specifically high enrichment in obese OAPs. C, D Additional differential BMAL1 targets with p.adj < 0.1 or average peak value <0.1. Respective histograms depicting the average peak value per condition are represented for MLL1 and GPX1, with data expressed as means ± SEM, *p < 0.05, by unpaired two-tailed t-test. FLOT1 Flotillin1, TUB Tubby bipartite, COL13A1 Collagen type XIII Alpha chain 1, MMP2 Matrix Metalloproteinase 2, PDK2 Pyruvate dehydrogenase kinase isoform 2, MINDY2 MINDY Lysine 48 Deubiquitinase 2, NCOR2 Nuclear Repressor Corepressor 2, LOXL2 Lysyl Oxidase Homolog 2, PAI1 Plasminogen Activator Inhibitor-1, Histone-lysine N-methyltransferase 2A, MLL1 glutathione peroxidase 1, GPX1. See also Supplementary Fig. 4.
Fig. 7
Fig. 7. BMAL1 chromatin binding to selected targets, their transcript, and protein levels in human omental adipocyte precursors from non-obese and obese subjects.
We selected from Fig. 6 some BMAL1 targets for their relevance in the pathogenesis of obesity and performed, for each of them, conventional ChIP analyses, and measurements of mRNA and protein levels in OAPs. A FLOT1 Flotillin1, B MMP2 Matrix Metalloproteinase 2, C NCOR2 Nuclear Repressor Corepressor 2, D LOXL2 Lysyl Oxidase Homolog 2, E PAI1 Plasminogen Activator Inhibitor-1, F MLL1 Histone-lysine N-methyltransferase 2A, G GPX1 glutathione peroxidase 1. ChIP data are expressed as fold enrichment over IgG, mRNAs as relative abundance (RA), and protein levels in pg or μU/μg total proteins. Histograms represent the mean ± SEM for 4 (ChIP) or 8 (mRNA and protein) patients per group. p < 0.05, **p < 0.01, ***p < 0.001 by unpaired two-tailed t-test. See also Supplementary Fig. 4.
Fig. 8
Fig. 8. Targets bound by endogenous BMAL1 in human omental adipocyte precursors: functional pathways and biological processes revealed by ChIP-seq analysis.
A Functional pathway analysis of the sites bound by BMAL1 in OAPs from obese and non-obese patients. Genes that were within 10,000 bases of the center of each peak were selected for downstream analysis. Functional gene pathway analysis was performed using the KEGG pathway database. The dot plot shows significantly enriched pathways in each group and statistics for each pathway. “Count” indicates the number of genes enriched in a specific pathway and “Gene ratio” the percentage of genes differentially bound in the given pathway. B Gene ontology (GO) analysis (“biological process” sub-ontology) revealed that bound targets of BMAL1 in either non-obese or obese OAPs are enriched for genes involved in canonical circadian functions, but are also enriched for many other genes involved in different functions. A, B p-value was determined using a hypergeometric statistical test and adjusted with the Benjamini–Hochberg procedure. See also Supplementary Fig. 4.
Fig. 9
Fig. 9. In vivo NF-κB inhibition prevents or rescues high-fat diet-induced adipose clock dysfunction in mice.
AK Mice expressing the Per2::Luciferase (mPer2Luc) transcriptional reporter were fed a low-fat diet (LFD, blue) or a high-fat diet (HFD, red) for either 3 months (AG, I) or 1 month (HK) while receiving salicylate (light purple) (JK). Tissues were collected at ZT 8. A Expression of pro-inflammatory genes, B NF-κB activity and C core-clock genes in whole (undigested) epididymal adipose explants (Adipose tissue, AT). D, E Per2 gene expression in epididymal adipocyte precursors (APs) and mature adipocytes. FH AT or APs were cultured to measure ex vivo PER2::LUCIFERASE fusion reporter protein from the endogenous Per2 locus for 4-5 days. F Normalized bioluminescence of reporter oscillations in AT (top) or APs (bottom) ex vivo. One representative trace per condition is shown (from n = 8 traces/group). G Period length of bioluminescence in AT (left) or APs (right), in hour. (H) Period length of bioluminescence in AT (in hour). I Ccl2, Mmp2, Loxl2, Pai1 gene expression as well as J NF-κB activity and K Per2 gene expression in AT. All histograms above are the mean ± SEM with n = 5 LDF and n = 4 HFD-fed mice for AE, n = 8 independent cultures/ group from 4 mice in each group for G, n = 4 mice/ group for H, J, K, and n = 5/4/4/4 mice for I. L Adipocyte Ikkβ-KO mice were fed a HFD for 3 months before tamoxifen treatment (dark purple) vs. oil (Ctrl, gray). Tissues were collected at ZT 8. Expression of Per2, Ccl2 and F4/80 genes in AT. Data are represented as mean ± SEM, with n = 6 mice/ group. Gene expression is displayed as mRNA Relative Abundance (RA) and NF-κB activity (phosphorylated p65) as Optical density (OD). *p < 0.05, **p < 0.01, ***p < 0.001, by unpaired two-tailed t-test (AI, L) or by one-way ANOVA followed by post hoc Tukey’ s test (J, K). See also Supplementary Figs. 5–7.

References

    1. Takahashi JS. Transcriptional architecture of the mammalian circadian clock. Nat. Rev. Genet. 2017;18:164–179. doi: 10.1038/nrg.2016.150. - DOI - PMC - PubMed
    1. Hong HK, et al. Requirement for NF-kappaB in maintenance of molecular and behavioral circadian rhythms in mice. Genes Dev. 2018;32:1367–1379. doi: 10.1101/gad.319228.118. - DOI - PMC - PubMed
    1. Bass J, Lazar MA. Circadian time signatures of fitness and disease. Science. 2016;354:994–999. doi: 10.1126/science.aah4965. - DOI - PubMed
    1. Kriebs A, et al. Circadian repressors CRY1 and CRY2 broadly interact with nuclear receptors and modulate transcriptional activity. Proc. Natl Acad. Sci. USA. 2017;114:8776–8781. doi: 10.1073/pnas.1704955114. - DOI - PMC - PubMed
    1. Schmutz I, Ripperger JA, Baeriswyl-Aebischer S, Albrecht U. The mammalian clock component PERIOD2 coordinates circadian output by interaction with nuclear receptors. Genes Dev. 2010;24:345–357. doi: 10.1101/gad.564110. - DOI - PMC - PubMed

Publication types

MeSH terms