. 2021 Apr 22;12(1):2383.
doi: 10.1038/s41467-021-22619-w.

Disruption of the HER3-PI3K-mTOR oncogenic signaling axis and PD-1 blockade as a multimodal precision immunotherapy in head and neck cancer

Affiliations

Disruption of the HER3-PI3K-mTOR oncogenic signaling axis and PD-1 blockade as a multimodal precision immunotherapy in head and neck cancer

Zhiyong Wang et al. Nat Commun. .

Abstract

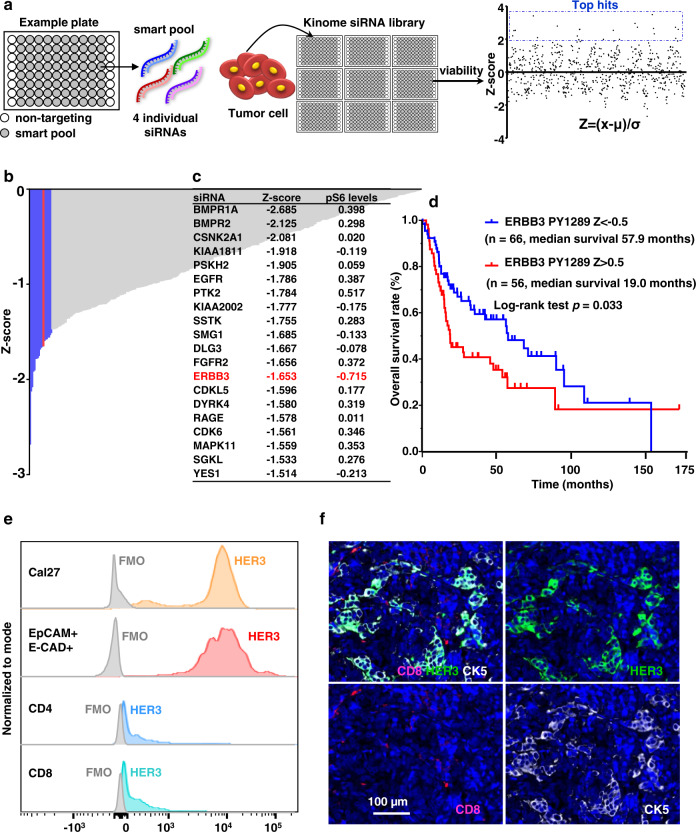
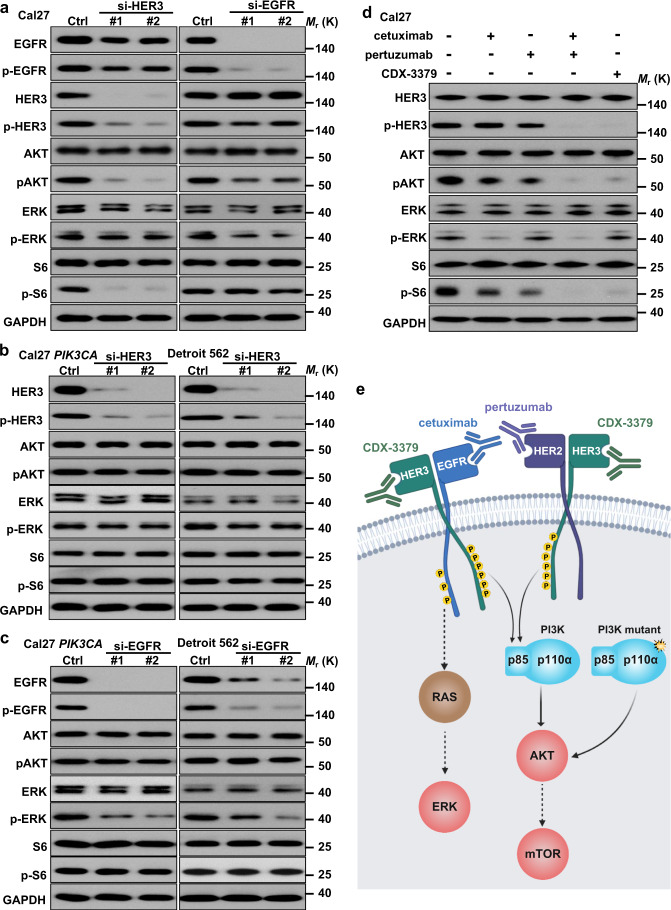
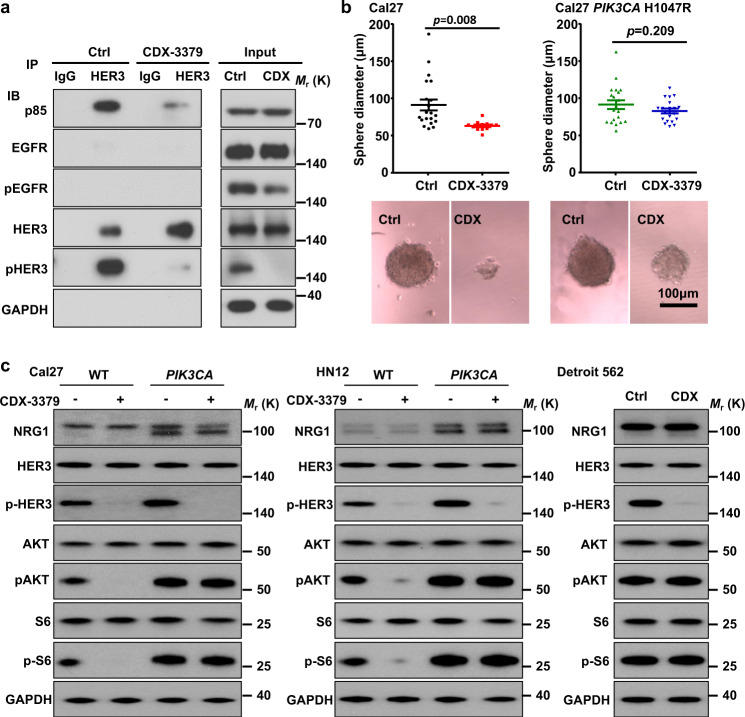
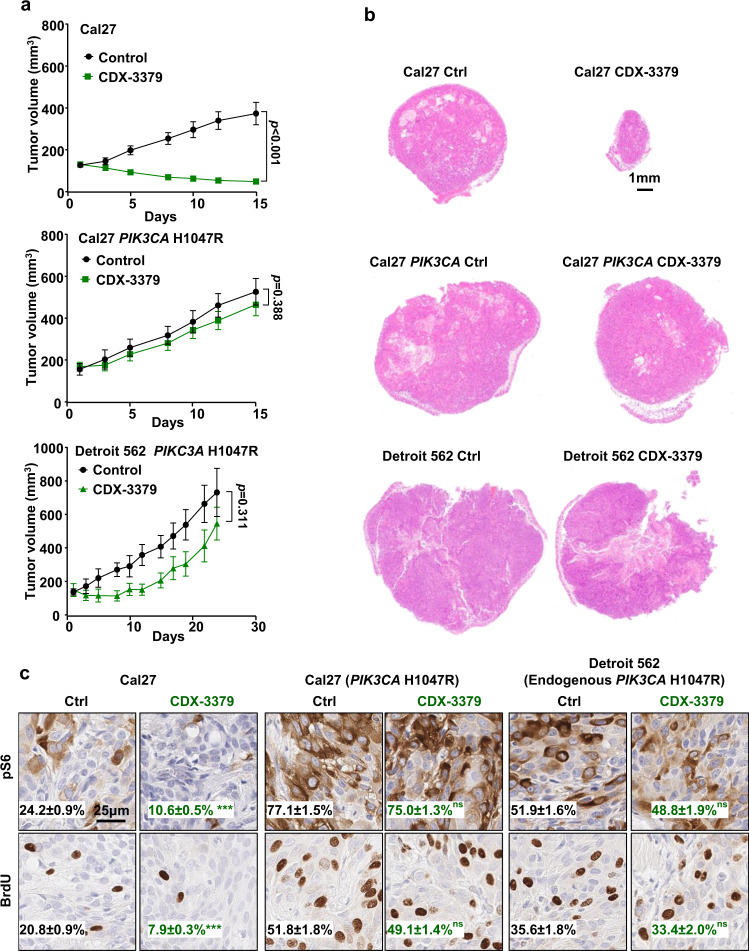
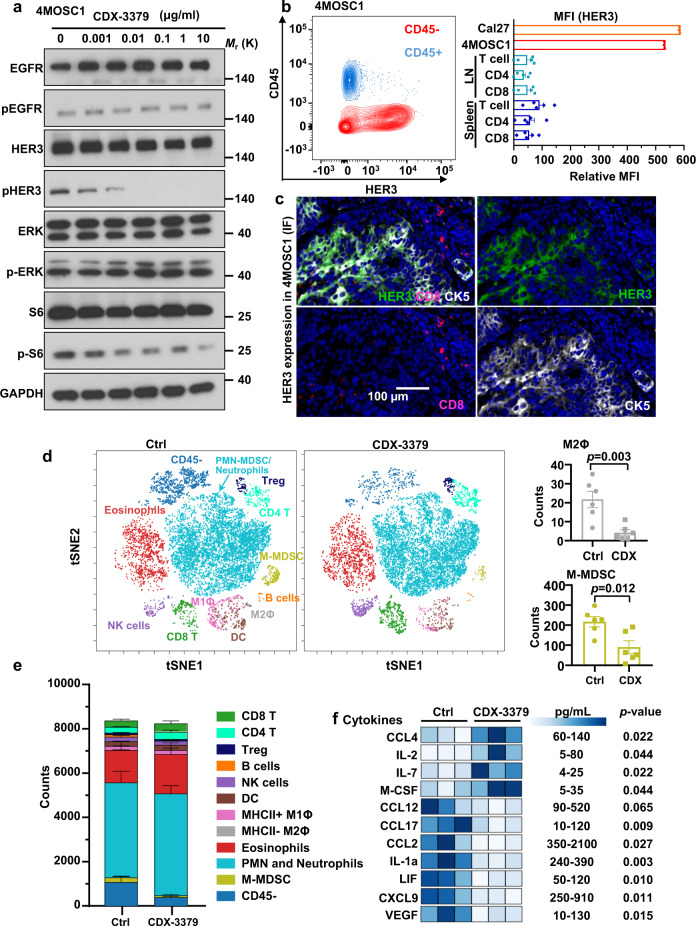
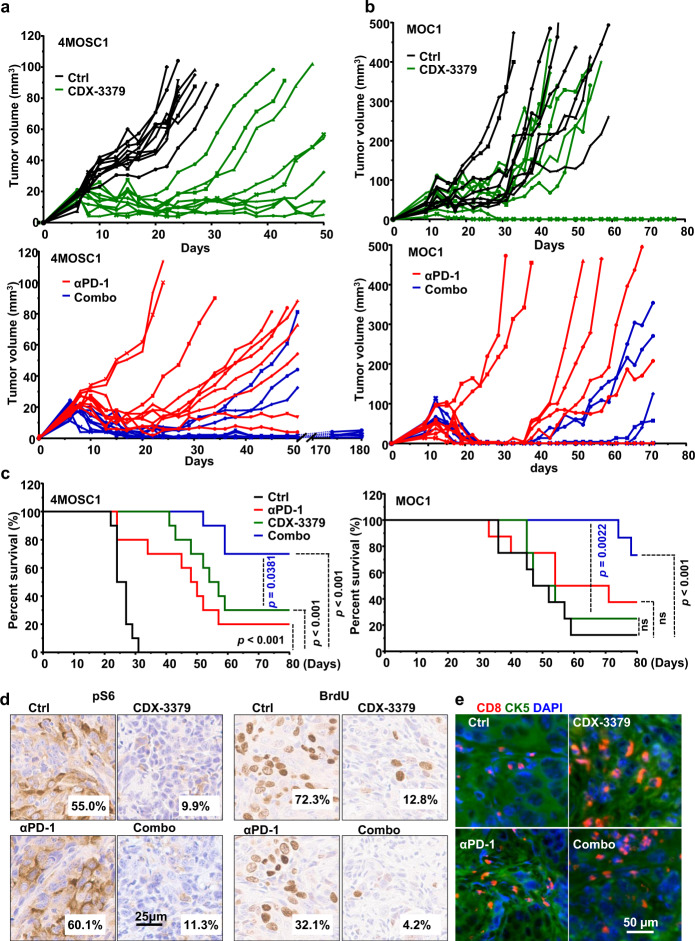
Immune checkpoint blockade (ICB) therapy has revolutionized head and neck squamous cell carcinoma (HNSCC) treatment, but <20% of patients achieve durable responses. Persistent activation of the PI3K/AKT/mTOR signaling circuitry represents a key oncogenic driver in HNSCC; however, the potential immunosuppressive effects of PI3K/AKT/mTOR inhibitors may limit the benefit of their combination with ICB. Here we employ an unbiased kinome-wide siRNA screen to reveal that HER3, is essential for the proliferation of most HNSCC cells that do not harbor PIK3CA mutations. Indeed, we find that persistent tyrosine phosphorylation of HER3 and PI3K recruitment underlies aberrant PI3K/AKT/mTOR signaling in PIK3CA wild type HNSCCs. Remarkably, antibody-mediated HER3 blockade exerts a potent anti-tumor effect by suppressing HER3-PI3K-AKT-mTOR oncogenic signaling and concomitantly reversing the immune suppressive tumor microenvironment. Ultimately, we show that HER3 inhibition and PD-1 blockade may provide a multimodal precision immunotherapeutic approach for PIK3CA wild type HNSCC, aimed at achieving durable cancer remission.


Conflict of interest statement

J.S.G. has received other commercial research support from Kura Oncology and Mavupharma, and is a consultant/advisory board member for Oncoceutics Inc., Vividion Therapeutics, and Domain Therapeutics; The remaining authors declare no competing interests.

Figures

Fig. 1
Fig. 1. HER3 is a candidate driver of the PI3K/mTOR oncogenic signaling circuitry in HNSCC.
a Experimental scheme of the kinome siRNA library screen. A “smart pool” of four individual siRNAs targeting each protein kinase gene of the human kinome is distributed in each well of the experimental plates. Cal27 cells were incubated for 72 h and assayed for cell viability, and the Z-score for viability was calculated (Z = (x − µ)/σ) (x stands for each value of cell viability; µ stands for average value; σ stands for standard deviation). b siRNA library targeting human kinases using the kinome siRNA library with Cal27 cells was conducted to search for genes that affect proliferation of HNSCC. Shown are the genes whose knockdown decrease cell viability (Z-score). The blue are the top 20 genes and HER3 is shown in red. (See Supplementary Data 1 for complete list). c Cal27 cells were transfected with the corresponding siRNAs (top 20 hits) for 72 h and cell lysates were analyzed for pS6 by western blotting. Densitometry analysis of western blots was performed using ImageJ. Shown are the top 20 hits of the kinome siRNA screen and their Z-scores, together with changes in pS6 levels after each gene was knocked down, as compared to the non-targeting siRNA group. Similar levels of S6 and GAPDH as loading control were confirmed (Supplementary Fig. 1). d The TCGA (The Cancer Genome Atlas) database was used to determine the relationship between HER3 phosphorylated on tyrosine 1289 (PY1289) and overall survival (OS) (n = 122 HNSCC patients, two sided log-rank test; p = 0.033). e Histogram demonstrating HER3 expression in EpCAM+ E-CAD+ tumor cells (red) and tumor-infiltrating CD4+ and CD8+ T cells (blue) in a fresh surgical specimen from a Stage II T2N0M0 primary tongue squamous cell carcinoma, compared to Cal27 cells (orange) as control. FMO (fluorescence minus one) samples were used to create HER3 + staining gates. f Immunofluorescent staining of CK5, CD8, and HER3 in the same specimen in panel (e), showing HER3 co-expressed with cancer cells (CK5 positive), but not with CD8+ T cells (n = 1 patient). Source data are provided as a Source Data file.
Fig. 2
Fig. 2. HER3 as a signaling hub stimulating the PI3K signaling circuitry in HNSCC.
a Western blot analysis of signaling events in HNSCC cells after knock down (KD) of ERBB3 or EGFR. Cal27 cells were transfected with the ERBB3 or EGFR siRNAs for 72 h and cell lysates were analyzed as indicated. b Western blot analysis of signaling events in HNSCC cells expressing PIK3CA H1047R mutation after KD of ERBB3. Cal27 cells expressing PIK3CA H1047R ectopically or Detroit 562 endogenously were transfected with the ERBB3 siRNAs for 72 h and cell lysates were analyzed by western blotting. c Western blot analysis of signaling events in HNSCC expressing PIK3CA H1047R mutation after KD of EGFR. Cal27 cells expressing PIK3CA H1047R or Detroit 562 were transfected with the EGFR siRNAs for 72 h and cell lysates were analyzed as indicated. d Western blot analysis of signaling events in HNSCC cells treated with cetuximab, pertuzumab, and CDX-3379. Cal27 cells were serum starved overnight and treated by cetuximab, pertuzumab, cetuximab + pertuzumab, and CDX-3379 at 100 ng/ml for 2 h. Cell lysates were analyzed as indicated. e Scheme depicting EGFR-HER3 dimer resulting in HER3 tyrosine phosphorylation and PI3K signaling stimulation by HER3-p85 interaction. Created with BioRender.com. Data shown were representative blots of results from three independent experiments with similar results. Source data are provided as a Source Data file.
Fig. 3
Fig. 3. Anti-tumor effect of HER3 kinase inhibition with CDX-3379 antibody: Disruption of HER3-p85 interaction.
a HER3 co-IP analysis of signaling events in HNSCC cells treated by CDX-3379, a HER3 blocking antibody. Cal27 cells were treated by CDX-3379 (1 µg/ml) for 1 h and cell lysates were analyzed as indicated. b Cal27 cells and cells expressing PIK3CA H1047R were plated in 96-well ultra-low attachment culture plates at 100 cells per well (n = 20), and treated with PBS or CDX-3379 (1 μg/ml). The diameters of sphere colonies on each well were monitored using light microscopy. Shown are diameters (top) and representative photographs (bottom) of sphere colonies of each group. (Cal27 control, n = 20; Cal27 CDX-3379, n = 12; Cal27 PIK3CA H1047R control, n = 20; Cal27 PIK3CA H1047R CDX3379, n = 20;). Data were reported as mean ± SEM; two-sided Student’s t-test. c Western blot analysis of signaling events in HNSCC cells treated by CDX-3379. Wild-type and cells infected with PIK3CA H1047R (PIK3CA) of (left) Cal27, (middle) HN12, together with (right) Detroit 562 cells (harboring PIK3CA H1047R mutations) were serum starved overnight and treated by CDX-3379 at 100 ng/ml for 2 h. Cell lysates were analyzed as indicated. For both Fig. a and c, data shown are representative blots of results from three independent experiments with similar results. Source data are provided as a Source Data file.
Fig. 4
Fig. 4. Anti-tumor effect of HER3 kinase inhibition with CDX-3379 antibody in vivo.
a WT Cal27 cells, Cal27 cells expressing PIK3CA H1047R or Detroit 562 were transplanted into the flanks of athymic nude mice, and when they reached 150–200 mm3, mice were treated with vehicle diluent or CDX-3379 (10 mg/kg, three times/week) for the indicated days (n = 10 for Cal27; n = 10 for Cal27 PIK3CA H1047R; n = 6 for Detroit 562). Data were reported as mean ± SEM; two-sided Student’s t-test. b Representative H&E stains of mouse tumors from the experiment from panel a. c Representative immunohistochemical analysis of pS6 and BrdU in the short-term treatment (every other day for three times) groups from panel (a) (n = 4 mice per group). Brown chromogen deposition reflects the immunoreactivity; hematoxylin was used as a nuclear counterstain (blue). Scale bars represent 25 μm. Quantification from images using Qupath software and the percentage of positive staining are shown on each image. Data were reported as mean ± SEM, two-sided Student’s t-test, p > 0.05, non-significant or ns; ***p < .001 when compared with the control-treated group. Source data are provided as a Source Data file.
Fig. 5
Fig. 5. HER3 inhibition with CDX-3379 in syngeneic HNSCC model remodels the tumor immune microenvironment.
a 4MOSC1 cells were treated with different concentrations of CDX-3379 for 1 h and cell lysates were analyzed by western blot analysis as indicated. Data shown are representative blots of results from three independent experiments with similar results. b Left, single cell suspension of 4MOSC1 tumors was stained with CD45 and HER3 antibodies and analyzed by flow cytometry. Shown is a representative flow cytometry plot of the frequency of tumor cells (CD45) and immune cells (CD45+) expressing HER3 (n = 4). Right, in mice with 4MOSC1 tumors, HER3 expression was measured in CD90.2+ T cells, CD90.2+ CD4+ T, and CD90.2+ CD8+ T cells in both the cervical lymph node (LN) and splenic compartment (the relative HER3 MFI of Cal27 and 4MOSC1 cells from culture serve as a positive control). Data were reported as relative mean fluorescence intensity (MFI) as compared to FMO (n = 3 for Cal27 and 4MOSC1; n = 5 for lymph nodes and spleen); Relative MFI was calculated by subtracting MFI-HER3 from MFI-FMO. c Immunofluorescent staining of CD8, HER3, and CK5 in slides of 4MOSC1 tumors to show HER3 co-expressed with cancer cells (CK5 positive), but not with CD8+ T cells. d Left, C57Bl/6 mice with 4MOSC1 tumors were treated IP with isotype control antibody and CDX-3379 (20 mg/kg) (n = 6). Biological populations identified via CyTOF were categorized in tSNE map. FlowSom depiction of different cell lineages within in the tumor micronvironment (colored) were identified by lineage-specific markers. Right, count of M2 macrophages (M2Φ) and M-MDSC cells. Data were reported as mean ± SEM; two-sided Student’s t-test. e Total count of major immune cell population within live cells from panel (d). f Chemokine and cytokine protein expression profile in 4MOSC1 tumors. Tongue tumors were established and treated as in panel d. Tumor lysates (total protein concentration 2 mg/ml) were used for mouse cytokine array/chemokine array analysis. Significantly altered molecules and the pg/mL range with HER3i are shown (n = 3). Data were reported as mean ± SEM; two-sided Student’s t-test. Source data are provided as a Source Data file.
Fig. 6
Fig. 6. Anti-tumor effect of HER3 inhibition in syngeneic HNSCC models and increased durable responses to PD-1 blockade.
a C57Bl/6 mice were implanted with 1 × 106 of 4MOSC1 cells into the tongue. After tumors reached ~30 mm3, mice were treated IP with of isotype control, CDX-3379 (20 mg/kg), anti-PD-1 (10 mg/kg), or a combination of CDX-3379 and PD-1 three times per week for 3 weeks. Individual growth curves of 4MOSC1 tumor-bearing mice are shown (n = 10 per group). b C57Bl/6 mice were implanted with 2 × 106 MOC1 cells into the flanks. After tumors reached approximate 50 mm3, mice were treated same as panel (a). Individual growth curves of MOC1 tumor-bearing mice are shown (n = 8 per group). c A Kaplan–Meier curve showing the survival of mice from panels (a) and (b). The death of animals occurred either naturally, when tumor compromised the animal welfare, when tongue tumor volume (panel a) reached 100 mm3 (n = 10 mice per group), or when flank tumor volume (panel b) reached 500 mm3 (n = 8 mice per group). Two sided log-rank/Mantel–Cox test. d Representative immunohistochemical analysis of pS6 and BrdU in the short-term treatment groups (every other day for three treatments) from panel (a). Brown chromogen deposition reflects the immunoreactivity; hematoxylin was used as a nuclear counterstain (blue). Scale bars represent 25 μm. Quantification from images on the left using Qupath software and the percentage of positive staining are shown on each image. e Immunofluorescent staining of CD8 and CK5 in the short-term treatment from panel (a). Source data are provided as a Source Data file.

References

    1. Siegel RL, Miller KD, Jemal A. Cancer statistics, 2020. CA Cancer J. Clin. 2020;70:7–30. doi: 10.3322/caac.21590. - DOI - PubMed
    1. Mao L, Hong WK, Papadimitrakopoulou VA. Focus on head and neck cancer. Cancer Cell. 2004;5:311–316. doi: 10.1016/S1535-6108(04)00090-X. - DOI - PubMed
    1. Cohen EE, et al. American Cancer Society Head and Neck Cancer Survivorship Care Guideline. CA Cancer J. Clin. 2016;66:203–239. doi: 10.3322/caac.21343. - DOI - PubMed
    1. Pulte D, Brenner H. Changes in survival in head and neck cancers in the late 20th and early 21st century: a period analysis. Oncologist. 2010;15:994–1001. doi: 10.1634/theoncologist.2009-0289. - DOI - PMC - PubMed
    1. Miller KD, et al. Cancer treatment and survivorship statistics, 2016. CA Cancer J. Clin. 2016;66:271–289. doi: 10.3322/caac.21349. - DOI - PubMed

Publication types

MeSH terms