. 2021 Apr 22;11(1):8735.
doi: 10.1038/s41598-021-87698-7.

BRCA1 degradation in response to mitochondrial damage in breast cancer cells

Affiliations

BRCA1 degradation in response to mitochondrial damage in breast cancer cells

Kana Miyahara et al. Sci Rep. .

Abstract

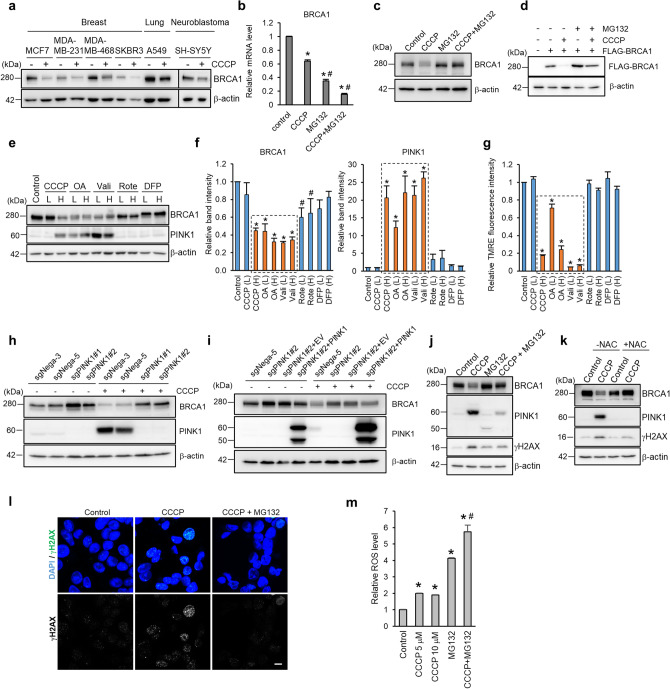
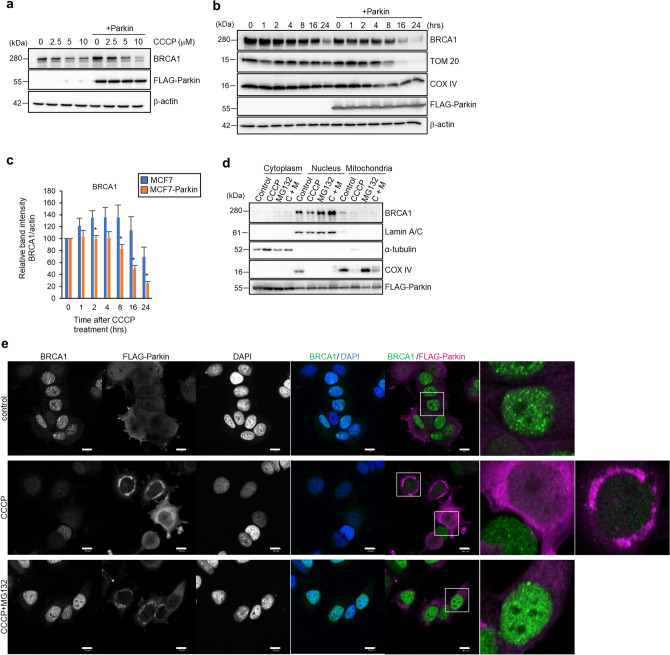
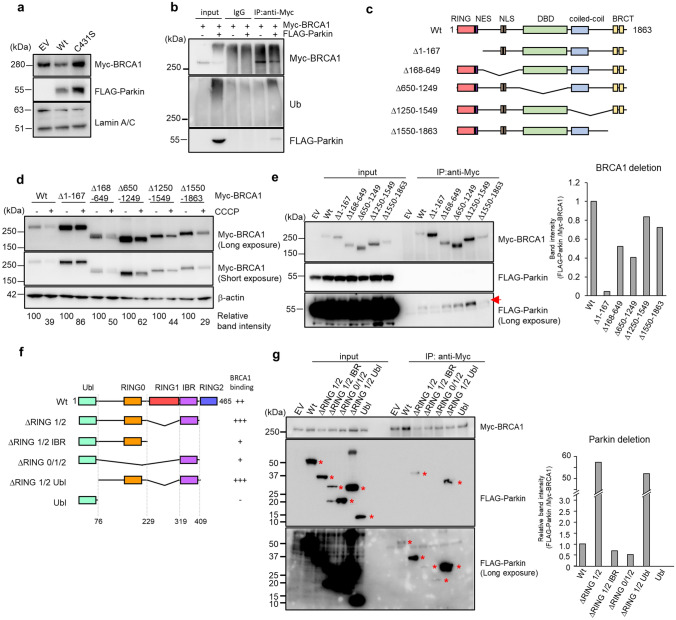
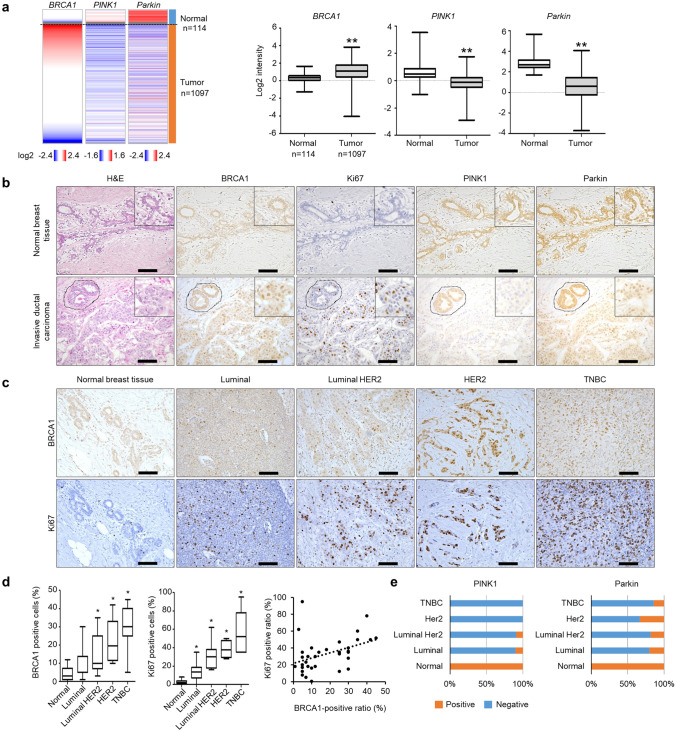
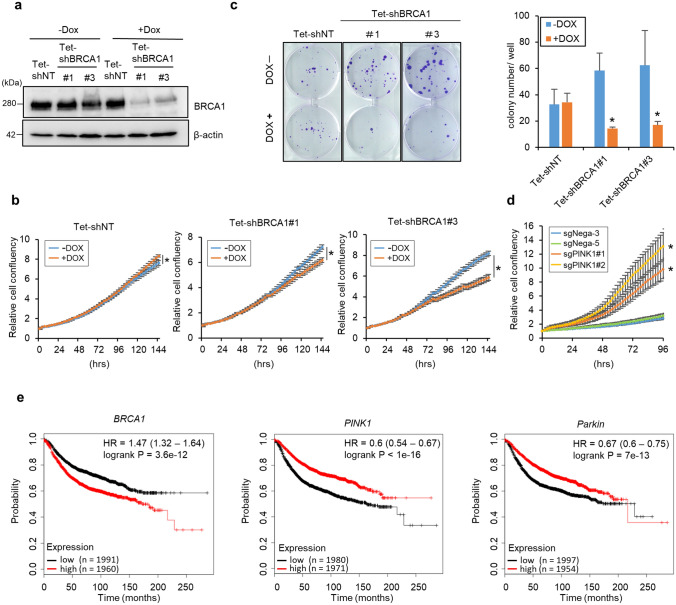
BRCA1 is a well-studied tumor suppressor involved in the homologous repair of DNA damage, whereas PINK1, a mitochondrial serine/threonine kinase, is known to be involved in mitochondrial quality control. Genetic mutations of PINK1 and Parkin cause autosomal recessive early-onset Parkinson's disease. We found that in breast cancer cells, the mitochondrial targeting reagents, which all induce mitochondrial depolarization along with PINK1 upregulation, induced proteasomal BRCA1 degradation. This BRCA1 degradation was dependent on PINK1, and BRCA1 downregulation upon mitochondrial damage caused DNA double-strand breaks. BRCA1 degradation was mediated through the direct interaction with the E3 ligase Parkin. Strikingly, BRCA1 and PINK1/Parkin expression were inversely correlated in cancerous mammary glands from breast cancer patients. BRCA1 knockdown repressed cancer cell growth, and high BRCA1 expression predicted poor relapse-free survival in breast cancer patients. These observations indicate a novel mechanism by which mitochondrial damage is transmitted to the nucleus, leading to BRCA1 degradation.


Conflict of interest statement

The authors declare no potential conflicts of interest.

Figures

Figure 1
Figure 1
Mitochondrial damage promotes PINK1-dependent BRCA1 degradation. (a) Western blotting analysis of BRCA1 in indicated cell lines treated with or without 10 μM CCCP for 24 h. (b) BRCA1 mRNA expression level was assessed after treatment with CCCP ± 10 μM MG132 for 24 h. n = 3, bar = means ± S.E., *p < 0.01 versus control, #p < 0.01 versus CCCP. (c) MCF7 cells were treated with the indicated agents for 24 h and BRCA1 protein level was assessed. (d) 293 T cells were transfected with FLAG-tagged BRCA1 and treated with the indicated agents for 24 h. (e) MCF7 cells were treated with CCCP (2 or 10 μM), oligomycin A and antimycin A (OA) (0.5 μM + 50 nM or 2.5 μM + 250 nM), valinomycin (Vali) (0.5 or 2 μM), rotenone (Rote) (0.5 or 2 μM), or DFP (0.2 or 1 mM) for 24 h. L and H respectively indicate low- and high-dose treatments. (f) The calculated band intensities of BRCA1 and PINK1 were shown. Bar = means ± S.E., n = 3. *p < 0.01, #p < 0.05 versus control. (g) Mitochondrial membrane potential was measured. Bar = means ± S.E., n = 3, *p < 0.05 versus control. (h) PINK1 knockout MCF7 cells or control cells were treated with ± 10 μM CCCP for 24 h. (i) BRCA1 expression level in sgPINK1#2 cells expressing PINK1 or empty vector (EV) was assessed after CCCP treatment for 24 h. (j) MCF7 cells were treated with the indicated agents for 24 h and assessed DNA double-strand breaks by detecting γH2AX expression. (k) MCF7 cells were treated with CCCP ± 10 mM NAC. (l) Immunostaining of γH2AX in MCF7 cells treated with the indicated agents. Nuclei were stained with DAPI. γH2AX signals and nuclei are shown as green and blue, respectively. Scale bar = 10 μm. (m) ROS levels were assessed in MCF7 cells treated with the indicated agents for 24 h. n = 3, bar = means ± S.D. *p < 0.05 versus control. #p < 0.05 versus MG132.
Figure 2
Figure 2
Parkin promotes BRCA1 degradation after mitochondrial damage via the ubiquitin–proteasome pathway and is co-localized in nucleus. (a) MCF7 and MCF7-Parkin cells were treated with CCCP at the indicated concentrations for 24 h, and then BRCA1 protein level was assessed by Western blotting. (b) Protein levels of BRCA1 as assessed by Western blotting. MCF7 and MCF7-Parkin cells were treated with 10 μM CCCP for the indicated times. Representative images from seven independent experiments are shown. TOM20 and COX IV were assessed to verify the occurrence of mitophagy. Because the overexpression of Parkin accelerates mitophagy, the degradation of TOM20 and COX IV in MCF7-Parkin cells after CCCP treatment was faster than that in MCF7 cells. (c) Densitometry analysis of BRCA1 in (b). Each band intensity was standardized against β-actin, and relative band intensities were calculated. n = 7, bar = means ± S.E., *p < 0.05 versus MCF7 at the same time point. (d) MCF7-Parkin cells were separated into the cytoplasmic, nuclear, and mitochondrial fractions after treatment with 0 or 10 µM CCCP and 0 or 10 µM MG132 for 24 h. Each fraction was subjected to Western blotting. Lamin A/C, α-tubulin, and COX IV were used as markers of the nuclear, cytoplasmic, and mitochondrial fractions, respectively. (e) Subcellular localizations of BRCA1 and FLAG-Parkin in MCF7-Parkin cells were assessed by immunofluorescence. Cells were treated with a vehicle, 10 μM CCCP, or 10 µM CCCP + 10 μM MG132 for 5 h. The treatments are indicated on the left side, and the detected proteins are indicated at the top. In the merged panels, BRCA1, FLAG-Parkin, and the nuclei are shown in green, magenta, and blue, respectively. The small boxed images are enlarged in the right panels. Scale bar = 10 μm.
Figure 3
Figure 3
Parkin directly interacts with BRCA1. (a) Western blotting analysis for Myc-BRCA1 with the nuclear extract from HEK293T cells transfected with Myc-BRCA1 and empty vector (EV), wild type FLAG-Parkin (Wt), or C431S mutant FLAG-Parkin (C431S). Lamin A/C was used as a loading control. (b) Nuclear extracts of HEK293T cells transduced with Myc-BRCA1 and FLAG-Parkin expression vectors or an empty vector, and then treated with MG132, were subjected to Co-IP assays. Immunoprecipitates were subjected to Western blotting for Myc-BRCA1, Ub, and FLAG-Parkin. (c) Schematic diagram of BRCA1 expression-constructs. The degron domain is located at a.a. 1–167. The RING domain, DBD (DNA binding domain), coiled-coil domain, BRCT (BRCA1 C-terminal) domain, NES (nuclear export sequence), and NLS (nuclear localization sequence) are boxed and labeled at the top. (d) The expression vector for the Myc-tagged full length or deletion mutant of BRCA1 shown in (C) was transfected into HEK293T cells, which were subsequently treated with or without 10 μM CCCP for 24 h. Next, protein levels were assessed by Western blotting. Relative Myc-BRCA1 band intensity is indicated at the bottom of the figure. (e) Coimmunoprecipitation of FLAG-Parkin with Myc-BRCA1 deletion mutants. The arrow shows the signal of FLAG-Parkin. The band intensities of FLAG-Parkin standardized by Myc-BRCA1 in the IP samples are summarized on the right side. (f) Schematic diagrams of Parkin expression constructs. The binding capacity of each construct for Myc-BRCA1 is summarized on the right side. The Ubl (ubiquitin-like) domain, RING0/1/2 domains, and IBR (in-between-RING) domains are boxed and labeled at the top. (g) Coimmunoprecipitation of FLAG-Parkin deletion mutants with Myc-BRCA1 was analyzed by Western blotting. Asterisks indicate FLAG-Parkin. The band intensities of FLAG-Parkin standardized against Myc-BRCA1 in the IP samples are summarized on the right side.
Figure 4
Figure 4
BRCA1 expression is inversely correlated with PINK1/Parkin expression in breast cancer tissues. (a) BRCA1, PINK1, and Parkin mRNA expression levels in human breast cancer patients were obtained from the TCGA database and summarized as a heat map (left) or box plot (right). **p < 0.01 versus normal tissues. (b) BRCA1, Ki67, Parkin, and PINK1 expressions in normal breast tissues and breast cancer tissues from patients were assessed by immunohistochemistry. The figures shown are representative images. On the images of invasive ductal carcinoma, circles with dashed lines indicate noncancerous breast epithelial tissues in the same images. Scale bar = 100 μm. (c) Immunohistochemical staining of BRCA1 and Ki67 in normal breast tissue and each subtype of breast cancer tissue. TNBC: triple negative breast cancer showing no ER, PgR, and HER2. (d) The left and middle graphs indicate the number of cells positive for BRCA1 or Ki67 [analyzed by IHC and shown in (C)] as a box plot. *p < 0.05 versus normal tissue. The right graph shows the correlation between the BRCA1-positive ratio and the Ki67-positive ratio in breast tumor tissue. Spearman’s correlation coefficient was analyzed (n = 34, r = 0.4245, p = 0.0123). (e) Summary of the Parkin- and PINK1-positive or -negative sample ratio in normal breast tissue and each subtype of breast cancer. Slides with Parkin- and PINK1-positive tissues were counted in each subtype, and the difference in the number of positive and negative slides between normal and tumor tissues was analyzed using the Chi-square test. The analysis revealed a significant difference in the PINK1 and Parkin expressions among the subtypes. p < 0.01 for Parkin and PINK1. In (d,e), the n for normal is 12, the n for luminal is 10, the n for luminal HER2 is 11, the n for HER2 is 6, and the n for TNBC is 7.
Figure 5
Figure 5
BRCA1 knockdown represses breast cancer cell growth and lower BRCA1 expression correlates with longer relapse-free survival rate. (a) MCF7 cells stably expressing Tet-shRNA vector against BRCA1 (Tet-shBRCA1) or control vector (Tet-shNT) were cultured with or without 0.1 μg/ml DOX for 48 h. BRCA1 knockdown efficiency was confirmed by Western blotting. (b) Growth of MCF7 cells expressing the Tet-shNT, Tet-shBRCA1 #1, or #3 vectors was assessed using the IncuCyte live-cell imaging system in the presence or absence of 0.1 μg/ml DOX for 4 days. n = 4, means ± S.D. *p < 0.05 versus -DOX. (c) Comparison of colony formation ability between MCF7 cells expressing Tet-shNT and Tet-shBRCA1. Cells were seeded in 6-well plates and cultured for 3 weeks in the presence or absence of 0.1 μg/ml DOX. Visualized colonies are shown in the left panel. Summarized colony numbers are shown in the right panel. Bar = means ± S.D. n = 3, *p < 0.05 versus -DOX. (d) The growth of PINK1 knockout MCF7 cells (sgPINK1#1, #2) or control cells (sgNega3, 5) was assessed using the IncuCyte live-cell imaging system. n = 5, means ± S.D. *p < 0.05 versus sgNega5. (e) Relapse-free survival rates of breast cancer patients were compared between high and low BRCA1, Parkin, or PINK1 expression in patients. Data are shown as Kaplan–Meier plots; graphs were generated using an online Kaplan–Meier plotter.

References

    1. Antoniou A, et al. Average risks of breast and ovarian cancer associated with BRCA1 or BRCA2 mutations detected in case series unselected for family history: A combined analysis of 22 studies. Am. J. Hum. Genet. 2003;72:1117–1130. doi: 10.1086/375033. - DOI - PMC - PubMed
    1. Mullan PB, Quinn JE, Harkin DP. The role of BRCA1 in transcriptional regulation and cell cycle control. Oncogene. 2006;25:5854–5863. doi: 10.1038/sj.onc.1209872. - DOI - PubMed
    1. Deng CX. Roles of BRCA1 in centrosome duplication. Oncogene. 2002;21:6222–6227. doi: 10.1038/sj.onc.1205713. - DOI - PubMed
    1. Zhang W, et al. BRCA1 regulates PIG3-mediated apoptosis in a p53-dependent manner. Oncotarget. 2015;6:7608–7618. doi: 10.18632/oncotarget.3263. - DOI - PMC - PubMed
    1. Lord CJ, Ashworth A. The DNA damage response and cancer therapy. Nature. 2012;481:287–294. doi: 10.1038/nature10760. - DOI - PubMed

Publication types