. 2021 Apr 22;4(1):492.
doi: 10.1038/s42003-021-02023-2.

Environmental connectivity controls diversity in soil microbial communities

Affiliations

Environmental connectivity controls diversity in soil microbial communities

Manupriyam Dubey et al. Commun Biol. .

Abstract

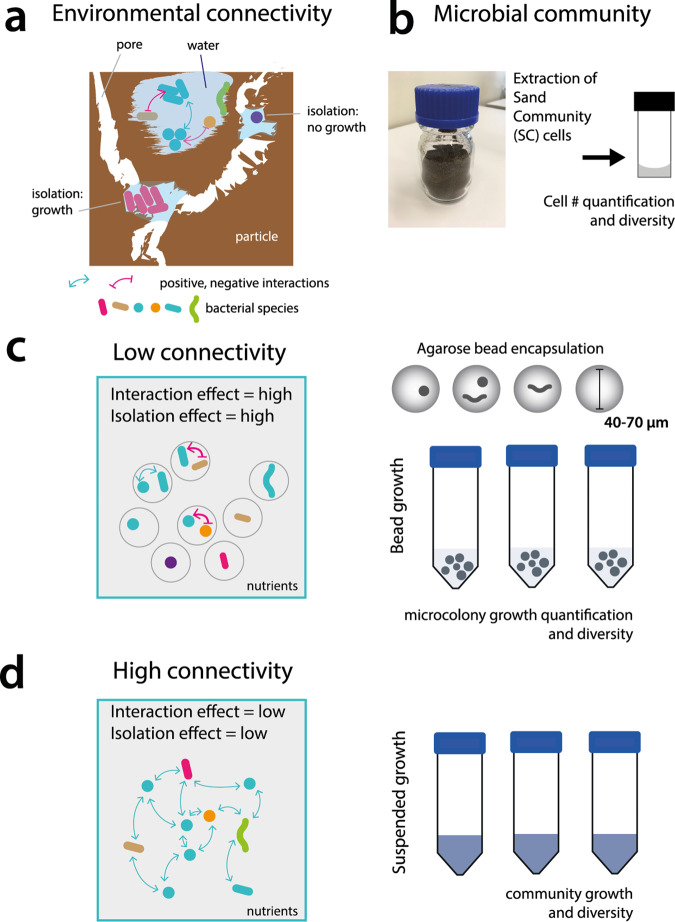
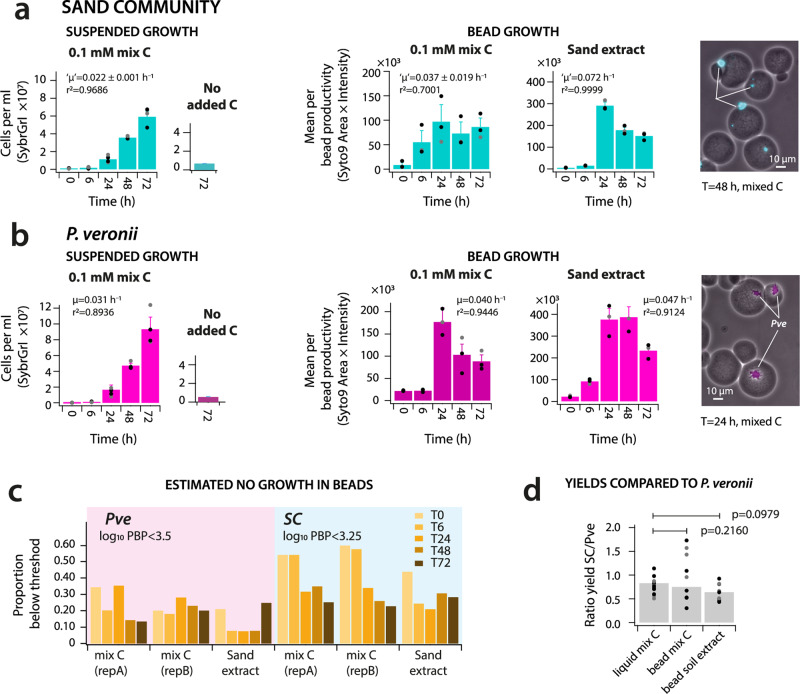
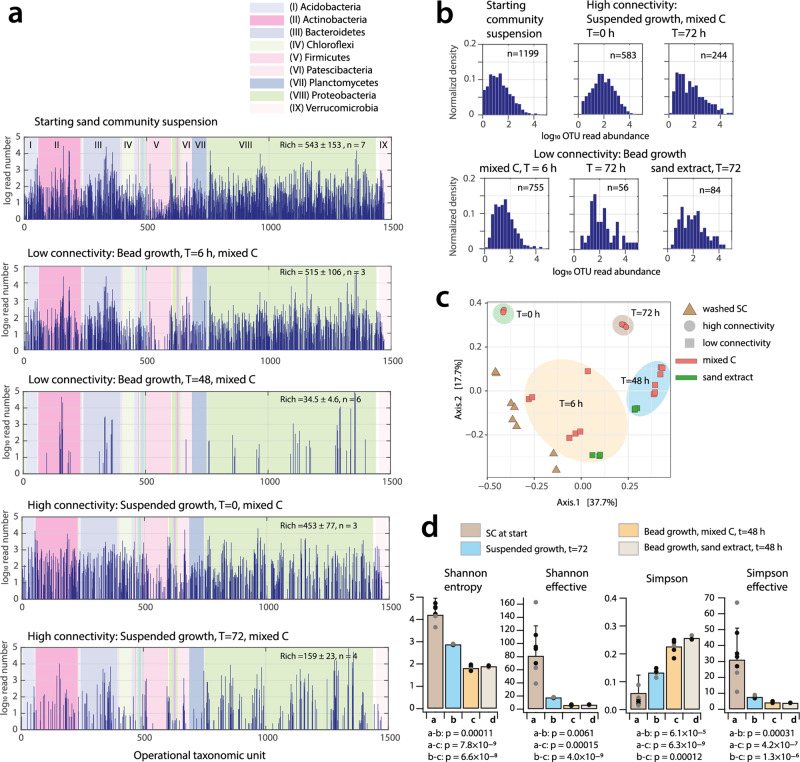
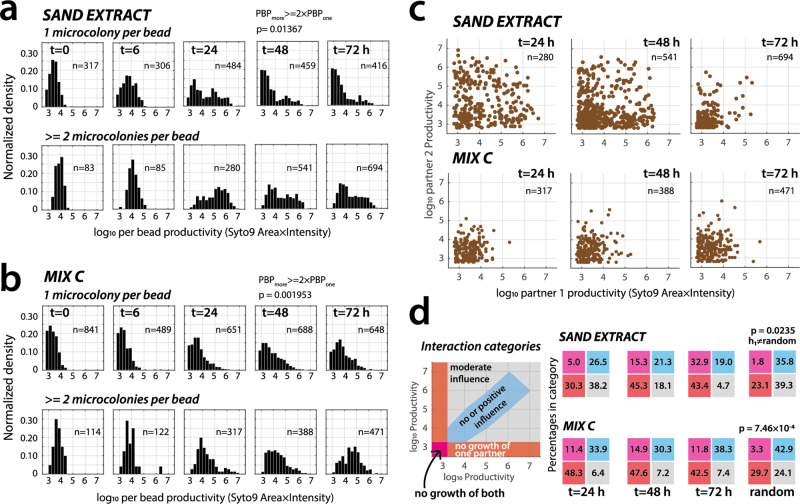
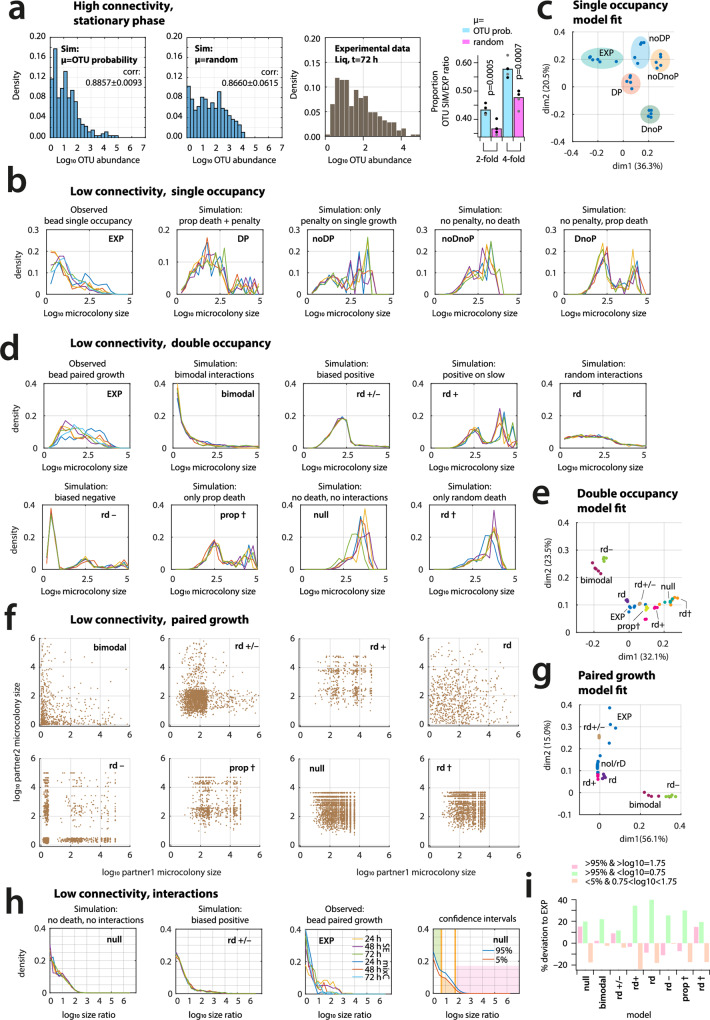
Interspecific interactions are thought to govern the stability and functioning of microbial communities, but the influence of the spatial environment and its structural connectivity on the potential of such interactions to unfold remain largely unknown. Here we studied the effects on community growth and microbial diversity as a function of environmental connectivity, where we define environmental connectivity as the degree of habitat fragmentation preventing microbial cells from living together. We quantitatively compared growth of a naturally-derived high microbial diversity community from soil in a completely mixed liquid suspension (high connectivity) to growth in a massively fragmented and poorly connected environment (low connectivity). The low connectivity environment consisted of homogenously-sized miniature agarose beads containing random single or paired founder cells. We found that overall community growth was the same in both environments, but the low connectivity environment dramatically reduced global community-level diversity compared to the high connectivity environment. Experimental observations were supported by community growth modeling. The model predicts a loss of diversity in the low connectivity environment as a result of negative interspecific interactions becoming more dominant at small founder species numbers. Counterintuitively for the low connectivity environment, growth of isolated single genotypes was less productive than that of random founder genotype cell pairs, suggesting that the community as a whole profited from emerging positive interspecific interactions. Our work demonstrates the importance of environmental connectivity for growth of natural soil microbial communities, which aids future efforts to intervene in or restore community composition to achieve engineering and biotechnological objectives.


Conflict of interest statement

The authors declare no competing interests.

Figures

Fig. 1
Fig. 1. Environmental connectivity and its experimental design.
a Soil microbial living environments are characterized by spatially fragmented and isolated pockets, such as formed by soil particles and water filled pores. Different species numbers may assemble depending on the volume of disconnected space, which is expected to directly influence the resulting growth properties and the extent of developing interspecific interactions of the (sub)communities. b A highly diverse microbial community used as inoculant is freshly extracted and dispersed from sand (SC) and quantified. c Growth under low connectivity, consisting of millions of disconnected environments formed by randomly encapsulating 1–2 founding SC cells in small substrate-permeable agarose beads, incubated in parallel. Cells under low connectivity are expected to face a strong isolation effect when being alone and strong interaction terms (red arrows, inhibition; blue arrows, neutral) when starting off in random partnerships. d Growth under high connectivity in a mixed liquid suspension of the same starting SC cell numbers and diversity as in c. High connectivity is expected to yield low isolation and low interspecific interaction effects, as a result of random mixing.
Fig. 2
Fig. 2. Aggregate community growth is unaffected by environmental connectivity.
a Growth of SC cells under high (i.e., mixed liquid suspension, in cells ml‒1) and low connectivity conditions (i.e., encapsulated in beads). Growth in beads is expressed as the mean per bead productivity (PBP). PBP is defined as the product of imaged microcolony areas times their mean SYTO-9 fluorescence intensity summed per bead, averaged across all imaged beads (n = 100–500 beads) in a replicate series. Mix C, mixture of 16 different carbon substrates (equimolar, to 1 mM final carbon concentration); sand extract, carbon and nutrient solution extracted from sand. Bars show mean community cell numbers of four (liquid) or three (beads) biological replicates, ± one SD, with individual data points. “µ” derived maximum community growth rate. Image shows detail of microcolonies (in cyan) in beads after 48 h. b as a but for a pure culture of the soil bacterium P. veronii. c Estimated proportion of non-growing P. veronii (Pve) or SC cells in bead incubations below the defined PBP thresholds. d SC community yield comparison across high and low connectivity conditions, taken as the ratio of SC yield to that of P. veronii under the same conditions. p-values from t-test (two-sided, unequal variance) of individual ratios, n = 12 (liquid) or 9 (beads). Bars show mean ratios with symbols presenting individual data points.
Fig. 3
Fig. 3. Community diversity decrease under low environmental connectivity.
a OTU losses upon growth incubation under low or high connectivity conditions. Log10 OTU read abundances of summed replicates per treatment or sample, ranked according to the SILVA-genus-level taxonomic classification (0–1500). Major bacterial phyla indicated in different background colors and Roman numbering. Rich, mean sample richness ± one SD, with n indicating the number of replicates. b Normalized distribution of log10 OTU summed read abundances, with n indicating the number of OTUs. c Multidimensional scaling analysis based on Bray–Curtis distance of SC cell suspensions at start, low (i.e., beads) and high (i.e., suspended growth) connectivity samples, as a function of incubation time and substrate. Percentages indicate explained variation among data sets and replicates. Colored zones manually added to group related samples. d Alpha diversity measures for community diversity under high or low connectivity conditions compared to SC at start. Bars show means ± 1 SD plus individual data points, calculated for the replicate sets of panel a. Values below are p-values from two-sided t-test with unequal variance for the indicated comparisons. p-Values between both bead regimes are not reported and show no statistically significant difference.
Fig. 4
Fig. 4. Paired growth is favorable over single occupancy growth but globally dominated by negative interactions.
Normalized log10 PBP distributions over time of beads with single occupancy or with two and more microcolonies (mean range: 2.1–3.8) for SC incubated with sand extract (a) or with mixed C substrates (b). p-values are the likelihood that the 75th percentile of all PBP distributions for single occupancy is equal to those of the PBP-values in multiple occupancy, corrected by their mean number of per bead microcolonies at that sampling time point (Wilcoxon rank sum test). n = number of beads. c Paired PBPs of arbitrarily ranked SC microcolonies inside single beads, presented on a log10 scale (each dot corresponding to an individual bead, n = number of paired beads). d Proportional interaction terms of paired SC microcolonies along four categories, as schematically indicated, for the three sampling time points and for a random distribution of 1000 points in the same log10 area. Magenta, fraction of beads with non-growing or single cell pairs (log10 PBP < 3.25); red, fraction of beads with one SC partner not growing; blue, more or less equal productivity of either pair (PBP ratio between 0.125 and 8); grey, remaining pairs (moderate growth influence). Numbers within colored squares on each scatter diagram correspond to the calculated percentages of inferred interaction types for the examples in (C), and p indicating the probability that the observed percentages of ‘no growth of one partner’ is equal to a random distribution (h1, alternative hypothesis; n = 10,000 repeats, two-sided t-test with unequal variance).
Fig. 5
Fig. 5. Simulations of community growth support mixed interactions prevailing low connectivity environments.
a Two scenarios for growth rate distribution among SC species, of which the one that follows the probability of OTU abundance predicts the better similarity of steady state OTU abundance distribution to observed growth in high connectivity conditions (i.e., liquid suspended growth) than random growth rate attribution. corr., mean correlation coefficient ± one SD (n = 5 simulations). Proportion of correctly predicted OTU abundances to within a two-fold or four-fold range of observed values (p-values from two-sided t-test, n = 5 simulations). b Observed (EXP, t = 72 h, n = 6) versus simulated steady state microcolony size abundances for low connectivity with single occupancy (i.e., one founder cell per bead, n = 5 simulations, each with 2 × 10⁵ cells, subsampled to 1000 beads). DP, single occupancy growth rate penalty (proportional to the initial SC OTU abundance) plus 85% probability for fast-growing OTU to be dead at start; noDP, growth rate penalty but no dead cells at start; noDnoP, no dead, no growth penalty; DnoP, dead cells but no growth penalty. c Principal component analysis (PCA) of single occupancy observations and simulations (from probability normalized binned histograms), percentages showing explained variation. d Observed (EXP, t = 24, 48 and 72 h, n = 6) versus simulated steady state per bead normalized microcolony size abundances for low connectivity with starting OTU pairs (each with 50,000 cells, n = 5 simulations, in all cases in presence of 75% single occupancy beads; subsampled to 5000 beads), for seven different imposed global interaction types in comparison to null model (i.e., no death and no interactions among paired cells; Supplementary text). e PCA of observed and simulated data sets of paired bead growth (as for c). f Simulated paired-growth at steady state as microcolony size differences (subsampled to 5000 beads, pairs with non-growing cells removed), for the global interaction types of d. g PCA of observed and simulated paired growth (normalized from extracted events in a 12 × 12 bin grid covering log10 = 0–6). h Interaction profiles (as normalized log10 size ratio of paired growths) for steady state low connectivity paired growth in case of the null and biased positive simulations (n = 5, subsampled from 5000 beads) compared to observed paired growth (EXP). i Percent deviation of observed paired growth (n = 6) to model simulations (deficit or excess compared to 5th and 95th simulated confidence intervals). Model abbreviation as in d.
Fig. 6
Fig. 6. Disfavored diversity in simulated low connectivity environments.
a Log10 probabilities of five alpha diversity measures from 16S OTU attributions being the same between comparison group and sample (bottom), expressed as p-value from two-sample t-test with unequal variance (n = 3–5 replicates). High, low: connectivity condition. b as a, but for simulated OTU distributions (n = 5 simulations, subsampled to 50,000 cells). Black symbols, loss of diversity; magenta, gain of diversity. Note how most models predict diversity loss for low compared to high connectivity environments and to starting SC diversity. c Observed and simulated richness decrease in high and low connectivity. d as b But for simulated diversity in single versus paired founder cells in low connectivity (five models predicting diversity gain for pairs). e Simulated vs. observed OTU distributions (as log10 normalized relative abundance, n = 5 sets). Spearman, mean ranked coefficient of five simulations. (Spearman = 0.2385 for random normalized numbers to mixC, t = 48 h dataset).

References

    1. Engel P, Martinson VG, Moran NA. Functional diversity within the simple gut microbiota of the honey bee. Proc. Natl Acad. Sci. USA. 2012;109:11002–11007. doi: 10.1073/pnas.1202970109. - DOI - PMC - PubMed
    1. Delgado-Baquerizo M, et al. A global atlas of the dominant bacteria found in soil. Science. 2018;359:320–325. doi: 10.1126/science.aap9516. - DOI - PubMed
    1. Mark Welch JL, Hasegawa Y, McNulty NP, Gordon JI, Borisy GG. Spatial organization of a model 15-member human gut microbiota established in gnotobiotic mice. Proc. Natl Acad. Sci. USA. 2017;114:E9105–E9114. doi: 10.1073/pnas.1711596114. - DOI - PMC - PubMed
    1. Boeuf D, et al. Biological composition and microbial dynamics of sinking particulate organic matter at abyssal depths in the oligotrophic open ocean. Proc. Natl Acad. Sci. USA. 2019;116:11824–11832. - PMC - PubMed
    1. Weissbrodt DG, Neu TR, Kuhlicke U, Rappaz Y, Holliger C. Assessment of bacterial and structural dynamics in aerobic granular biofilms. Front. Microbiol. 2013;4:175. doi: 10.3389/fmicb.2013.00175. - DOI - PMC - PubMed

Publication types

LinkOut - more resources