. 2021 Apr 6:15:657445.
doi: 10.3389/fncir.2021.657445. eCollection 2021.

Serotonergic Modulation of Persistent Inward Currents in Serotonergic Neurons of Medulla in ePet-EYFP Mice

Affiliations

Serotonergic Modulation of Persistent Inward Currents in Serotonergic Neurons of Medulla in ePet-EYFP Mice

Yi Cheng et al. Front Neural Circuits. .

Abstract

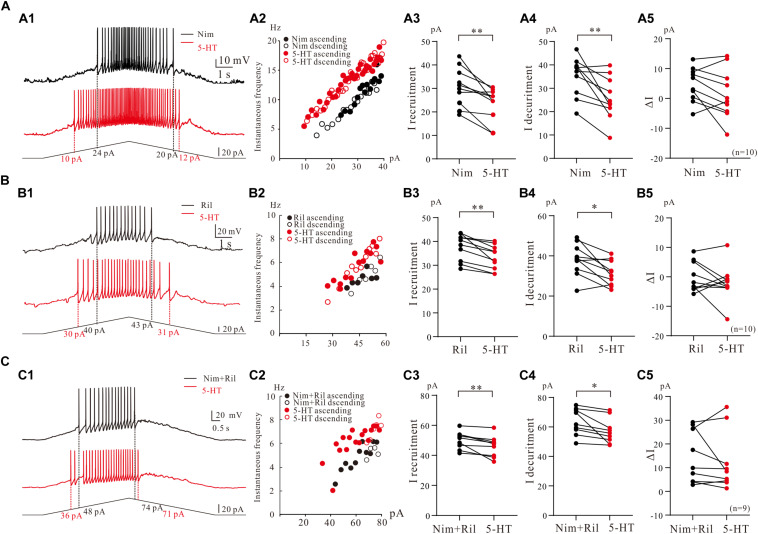
Serotonergic (5-HT) neurons in the medulla play multiple functional roles associated with many symptoms and motor activities. The descending serotonergic pathway from medulla is essential for initiating locomotion. However, the ionic properties of 5-HT neurons in the medulla remain unclear. Using whole-cell patch-clamp technique, we studied the biophysical and modulatory properties of persistent inward currents (PICs) in 5-HT neurons of medulla in ePet-EYFP transgenic mice (P3-P6). PICs were recorded by a family of voltage bi-ramps (10-s duration, 40-mV peak step), and the ascending and descending PICs were mirrored to analyze the PIC hysteresis. PICs were found in 77% of 5-HT neurons (198/258) with no significant difference between parapyramidal region (n = 107) and midline raphe nuclei (MRN) (n = 91) in either PIC onset (-47.4 ± 10 mV and -48.7 ± 7 mV; P = 0.44) or PIC amplitude (226.9 ± 138 pA and 259.2 ± 141 pA; P = 0.29). Ninety-six percentage (191/198) of the 5-HT neurons displayed counterclockwise hysteresis and four percentage (7/198) exhibited the clockwise hysteresis. The composite PICs could be differentiated as calcium component (Ca_PIC) by bath application of nimodipine (25 μM), sodium component (Na_PIC) by tetrodotoxin (TTX, 2 μM), and TTX- and dihydropyridine-resistance component (TDR_PIC) by TTX and nimodipine. Ca_PIC, Na_PIC and TDR_PIC all contributed to upregulation of excitability of 5-HT neurons. 5-HT (15 μM) enhanced the PICs, including a 26% increase in amplitude of the compound currents of Ca_PIC and TDR_PIC (P < 0.001, n = 9), 3.6 ± 5 mV hyperpolarization of Na_PIC and TDR_PIC onset (P < 0.05, n = 12), 30% increase in amplitude of TDR_PIC (P < 0.01), and 2.0 ± 3 mV hyperpolarization of TDR_PIC onset (P < 0.05, n = 18). 5-HT also facilitated repetitive firing of 5-HT neurons through modulation of composite PIC, Na_PIC and TDR_PIC, and Ca_PIC and TDR_PIC, respectively. In particular, the high voltage-activated TDR_PIC facilitated the repetitive firing in higher membrane potential, and this facilitation could be amplified by 5-HT. Morphological data analysis indicated that the dendrites of 5-HT neurons possessed dense spherical varicosities intensively crossing 5-HT neurons in medulla. We characterized the PICs in 5-HT neurons and unveiled the mechanism underlying upregulation of excitability of 5-HT neurons through serotonergic modulation of PICs. This study provided insight into channel mechanisms responsible for the serotonergic modulation of serotonergic neurons in brainstem.

Keywords: medulla; neuromodulation; neuronal excitability; persistent inward currents; serotonergic neurons.


Conflict of interest statement

The authors declare that the research was conducted in the absence of any commercial or financial relationships that could be construed as a potential conflict of interest.

Figures

FIGURE 1
FIGURE 1
Characterization of PICs in 5-HT neurons. (A) The transverse slices were collected from the medulla indicated by dash lines. (B) One slice cut from the sections shows the EYFP+ serotonin (5-HT) neurons with enhanced yellow fluorescent proteins in parapyramidal region (PPR) and midline raphe nuclei (MRN) areas. (C) Measurement of biophysical parameters of PICs by the voltage bi-ramp from −70 to 50 mV. (D) Measurement of biophysical parameters (recruitment currents, decruitment currents, and difference ΔI) from repetitive firing induced by current bi-ramp with a duration of 10 s, peak of 60–80 pA, and holding current of zero pA. (E) Distribution of 5-HT neurons with PICs in medulla (top). Proportions of PICs (solid) and Non-PICs (open) recorded from PPR and MRN 5-HT neurons (bottom). (F) Statistic results of the onset and amplitude of PICs in PPR (n = 107) and MRN (n = 91). Error bars show SD, unpaired t-test. (G) Four patterns of PICs in 5-HT neurons of medulla. (G1) a-PIC only with counterclockwise hysteresis. (G2) a-PIC > d-PIC with counterclockwise hysteresis of PICs. (G3) d-PIC only with clockwise hysteresis. (G4) d-PIC > a-PIC with clockwise hysteresis of PICs.
FIGURE 2
FIGURE 2
Multiple components of PICs. (A) Na_PIC was differentiated from PICs. (A1) Overlapped current traces recorded by voltage ramps in control (gray) and application of 2 μM TTX (black). (A2) Summary diagrams show the onset and amplitude of PICs recorded in control and presence of 1–2 μM TTX (n = 20). (A3) The half-maximal activations (Vmid) of the PICs were calculated as −27.1 mV for control (open circles, A2) and −14.3 mV for TTX. (A4) Summary diagrams show the Vmid of PICs recorded in control and presence of 1–2 μM TTX (n = 6). (B) Ca_PIC was differentiated from PICs. (B1) Overlapped current traces recorded by voltage ramps in control (gray) and application of 25 μM Nimodipine (black). (B2) Summary diagrams show the onset and amplitude of PICs recorded in control and presence of 25 μM Nimodipine (n = 26). (B3) The Vmid were calculated as −27.9 mV for control (open circles) and −25.7 mV for Nimodipine. (B4) Summary diagrams show the Vmid of PICs recorded in control and presence of 25 μM Nimodipine (n = 9). (C) TDR_PIC was differentiated from PICs. (C1) Overlapped current traces recorded by voltage ramps in control (gray) and application of 1 μM TTX and 25 μM Nimodipine (black). (C2) Summary diagrams show the onset and amplitude of PICs recorded in control and presence of 1–2 μM TTX and 25 μM Nimodipine (n = 15). (C3) Results from five neurons, the Vmid were calculated for PICs (open circles) and TDR_PIC (n = 5). (C4) TDR_PIC was not changed after the calcium was removed from recording artificial cerebrospinal fluid (ACSF), but was completely blocked after complete removal of sodium from the recording solution. Error bars show SD. ∗∗P < 0.01, ∗∗∗P < 0.001, paired t-test.
FIGURE 3
FIGURE 3
Contribution of multiple PICs to the firing properties of 5-HT neurons. (A) Contribution of Ca_PIC to the firing properties of 5-HT neurons. (A1) Overlapped voltage traces recorded by current ramp in control (gray) and application of 25 μM nimodipine (black). (A2) Instantaneous firing frequency/current relationship (iF-I relation) for both control and nimodipine condition. Depolarizing phase of the ramp represented by closed circles (control, gray closed circles; nimodipine, black closed circles) and repolarizing phase represented by open circles (control, gray open circles; nimodipine, black open circles). (A3) Graphs show the maximal frequency in control (gray circles) and in the presence of 25 μM nimodipine (black circles). (A4) Graphs show the ΔI in control (gray circles) and in the presence of 25 μM nimodipine (black circles). (B) The effects of Na_PIC on the firing properties of 5-HT neurons. (B1) Overlapped voltage traces recorded by current ramp in control and application of 2 μM Riluzole. (B2) Instantaneous firing frequency/current relationship for both control (gray circles) and Riluzole (black circles) condition. (B3) Graphs show the maximal frequency in control (gray circles) and in the presence of 2 μM Riluzole (black circles). (B4) Graphs show the ΔI in control (gray circles) and in the presence of 2 μM Riluzole (black circles). (C) Contribution of TDR_PIC to the firing properties. (C1) Overlapped voltage traces recorded by current ramp in control and application of 2 μM Riluzole and 25 μM nimodipine. (C2) Instantaneous firing frequency/current relationship for both control (gray circles) and Riluzole and Nimodipine (black circles) condition. (C3) Graphs show the maximal frequency in control (gray circles) and in the presence of 2 μM Riluzole and 25 μM nimodipine (black circles). (B4) Graphs show the ΔI in control (gray circles) and in the presence of 2 μM Riluzole and 25 μM nimodipine (black circles). Error bars show SD. P < 0.05, ∗∗P < 0.01, ∗∗∗P < 0.001, paired t-test.
FIGURE 4
FIGURE 4
Morphology of serotonergic (5-HT) neurons. (A1) Two 5-HT neurons labeled with intracellular tetramethylrhodamine and located in PPR. The dendrites of the neurons with large spherical varicosities crossing the dendrites of the neurons (arrow). (A2) Tetramethylrhodamine filled a 5-HT neuron located in PPR with large spherical varicosities. (B1,B2) Two 5-HT neurons located in MRN with large spherical varicosities.
FIGURE 5
FIGURE 5
5-HT modulation of PICs. (A) The 5-HT modulation of PICs. (A1) Overlapped current traces recorded by voltage ramps in control (black) and 20 μM 5-HT (red). (A2) Summary diagrams show the onset and amplitude of PICs recorded in control and presence of 15–20 μM 5-HT (n = 12). (A3) 5-HT significantly hyperpolarized the Vmid, n = 6, P < 0.05. (B) The 5-HT modulation of Na_PIC + TDR_PIC. (B1) Overlapped current traces recorded by voltage ramps in application of Nimodipine (25 μM, black) and 20 μM 5-HT (red). (B2) Summary diagrams show the onset and amplitude of Na_PIC + TDR_PIC recorded in control and presence of 15–20 μM 5-HT (n = 12). (B3) 5-HT significantly hyperpolarized the Vmid, P < 0.001, n = 4. (C) The 5-HT modulation of Ca_PIC + TDR_PIC. (C1) Overlapped current traces recorded by voltage ramps in control (black) and 20 μM 5-HT (red). (C2) Summary diagrams show the onset and amplitude of Ca_PIC + TDR_PIC recorded in control and presence of 15–20 μM 5-HT (n = 9). (C) 5-HT did not significantly change the Vmid, n = 8, P > 0.05. (D) The 5-HT modulation of TDR_PIC. (D1) Overlapped current traces recorded by voltage ramps in control (black) and 20 μM 5-HT (red). (D2) Summary diagrams show the onset and amplitude of TDR_PIC recorded in control and presence of 15–20 μM 5-HT (n = 18). (D3) 5-HT significantly hyperpolarized the Vmid of TDR_PIC, control: −6.7 ± 4 mV; 5-HT: −11.1 ± 5 mV, P < 0.05, n = 4. Error bars show SD. P < 0.05, ∗∗P < 0.01, ∗∗∗P < 0.001, paired t-test.
FIGURE 6
FIGURE 6
5-HT modulation of firing properties of 5-HT neurons. (A1) Repetitive firing evoked by bi-ramp current injected (10 s duration) into a 5-HT neuron (black). A 10 μM 5-HT was then applied to the recording solution (red). (A2) Instantaneous firing frequency/current relationship for both control and 5-HT conditions. (A3–A5) Values measured for recruitment current, decruitment current and ΔI in control (black) and bath application of 15 μM 5-HT (red). (B1–B6) Summary diagrams show 5-HT-induced significant changes in the membrane properties including resting membrane potential (RMP), input resistance (Rin), voltage threshold (Vth), rheobase, action potential height (AP height) and afterhyperpolarization depth (AHP depth) recorded in control and presence of 15 μM 5-HT (n = 11). Error bars show SD. P < 0.05, ∗∗P < 0.01, ∗∗∗P < 0.001, paired t-test.
FIGURE 7
FIGURE 7
The effect of 5-HT on repetitive firing properties of 5-HT neurons with regulation of Na_PIC + TDR_PIC, Ca_PIC + TDR_PIC, and TDR_PIC. (A1–C1) Repetitive firing with regulation of Na_PIC + TDR_PIC, Ca_PIC + TDR_PIC, and TDR_PIC, respectively (black). Ten micrometers 5-HT was then applied to the recording solution (red). (A2–C2) Instantaneous firing frequency/current relationship recorded for control (black) and 5-HT (red). (A3–C3) Recruitment current measured for control (black) and 5-HT (red); (A4–C4) Decruitment current measured for control (black) and 5-HT (red). (A5–C5) ΔI calculated for control (black) and 5-HT (red). Error bars were shown as SD. P < 0.05, ∗∗P < 0.01, paired t-test.

Similar articles

Cited by

References

    1. Adams-Ray J., Dahlström A., Fuxe K., Hillarp N. Å. (1964). Mast cells and monoamines. Experientia 20:80. 10.1007/BF02151252 - DOI - PubMed
    1. Bellardita C., Caggiano V., Leiras R., Caldeira V., Fuchs A., Bouvier J., et al. (2017). Spatiotemporal correlation of spinal network dynamics underlying spasms in chronic spinalized mice. eLife 6:e023011. 10.7554/eLife.23011 - DOI - PMC - PubMed
    1. Bennett D. J., Li Y., Siu M. (2001). Plateau potentials in sacrocaudal motoneurons of chronic spinal rats, recorded in vitro. J. Neurophysiol. 86 1955–1971. 10.1152/jn.2001.86.4.1955 - DOI - PubMed
    1. Brown P., Molliver M. E. (2000). Dual serotonin (5-HT) projections to the nucleus accumbens core and shell: relation of the 5-HT transporter to amphetamine-induced neurotoxicity. J. Neurosci. 20 1952–1963. 10.1523/JNEUROSCI.20-05-01952.2000 - DOI - PMC - PubMed
    1. Carlin K. P., Jones K. E., Jiang Z., Jordan L. M., Brownstone R. M. (2000). Dendritic L-type calcium currents in mouse spinal motoneurons: implications for bistability. Eur. J. Neurosci. 12 1635–1646. 10.1046/j.1460-9568.2000.00055.x - DOI - PubMed

Publication types