. 2021 Apr 6:12:597983.
doi: 10.3389/fgene.2021.597983. eCollection 2021.

Identification of the Key Regulators of Spina Bifida Through Graph-Theoretical Approach

Affiliations

Identification of the Key Regulators of Spina Bifida Through Graph-Theoretical Approach

Naaila Tamkeen et al. Front Genet. .

Abstract

Spina Bifida (SB) is a congenital spinal cord malformation. Efforts to discern the key regulators (KRs) of the SB protein-protein interaction (PPI) network are requisite for developing its successful interventions. The architecture of the SB network, constructed from 117 manually curated genes was found to self-organize into a scale-free fractal state having a weak hierarchical organization. We identified three modules/motifs consisting of ten KRs, namely, TNIP1, TNF, TRAF1, TNRC6B, KMT2C, KMT2D, NCOA3, TRDMT1, DICER1, and HDAC1. These KRs serve as the backbone of the network, they propagate signals through the different hierarchical levels of the network to conserve the network's stability while maintaining low popularity in the network. We also observed that the SB network exhibits a rich-club organization, the formation of which is attributed to our key regulators also except for TNIP1 and TRDMT1. The KRs that were found to ally with each other and emerge in the same motif, open up a new dimension of research of studying these KRs together. Owing to the multiple etiology and mechanisms of SB, a combination of several biomarkers is expected to have higher diagnostic accuracy for SB as compared to using a single biomarker. So, if all the KRs present in a single module/motif are targetted together, they can serve as biomarkers for the diagnosis of SB. Our study puts forward some novel SB-related genes that need further experimental validation to be considered as reliable future biomarkers and therapeutic targets.

Keywords: Spina bifida; key regulators; protein-protein interaction network; rich-club analysis; topological analysis.


Conflict of interest statement

The authors declare that the research was conducted in the absence of any commercial or financial relationships that could be construed as a potential conflict of interest.

Figures

FIGURE 1
FIGURE 1
(A) showing probability of degree distribution P(k), clustering coefficient C(k), neighborhood connectivity CN(k), betweenness centrality CB(k), closeness centrality CC(k), and eigenvector centrality CE(k) as a function of degree (k) for primary original network (level 0) and TNIP1 motif knockout networks at different levels of the organization (level 1–4). (B) showing changes in the values of the topological properties’ exponents of the TNIP1 motif knockout networks (colors corresponding to the ones used in the topological properties plots i.e., blue for P(k), red for C(k), yellow for CN(k), magenta for CB(k), green for CC(k) and turquoise for CE(k)) compared with the topological properties’ exponents of the corresponding original networks (black) at different levels of the organization. γ, α, β, μ, δ, and O are the exponents of the degree distribution, clustering coefficient, neighborhood connectivity, betweenness centrality, closeness centrality, and eigenvector centrality, respectively.
FIGURE 2
FIGURE 2
(A) showing probability of degree distribution P(k), clustering coefficient C(k), neighborhood connectivity CN(k), betweenness centrality CB(k), closeness centrality CC(k), and eigenvector centrality CE(k) as a function of degree (k) for primary original network (level 0) and TNRC6B motif knockout networks at different levels of the organization (level 1–3). (B) showing changes in the values of the topological properties’ exponents of the TNRC6B motif knockout networks [colors corresponding to the ones used in the topological properties plots i.e., blue for P(k), red for C(k), yellow for CN(k), magenta for CB(k), green for CC(k), and turquoise for CE(k)] compared with the topological properties’ exponents of the corresponding original networks (black) at different levels of the organization. γ, α, β, μ, δ, and O are the exponents of the degree distribution, clustering coefficient, neighborhood connectivity, betweenness centrality, closeness centrality, and eigenvector centrality, respectively.
FIGURE 3
FIGURE 3
(A) showing probability of degree distribution P(k), clustering coefficient C(k), neighborhood connectivity CN(k), betweenness centrality CB(k), closeness centrality CC(k), and eigenvector centrality CE(k) as a function of degree (k) for primary original network (level 0) and TRDMT1 motif knockout networks at different levels of the organization (level 1–3). (B) showing changes in the values of the topological properties’ exponents of the TRDMT1 motif knockout networks [colors corresponding to the ones used in the topological properties plots i.e., blue for P(k), red for C(k), yellow for CN(k), magenta for CB(k), green for CC(k) and turquoise for CE(k)] compared with the topological properties’ exponents of the corresponding original networks (black) at different levels of the organization. γ, α, β, μ, δ, and O are the exponents of the degree distribution, clustering coefficient, neighborhood connectivity, betweenness centrality, closeness centrality, and eigenvector centrality, respectively.
FIGURE 4
FIGURE 4
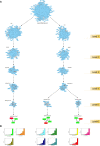
(A) illustration of the hierarchical organization of the SB network into 6 different levels that resulted after clustering. The gray-colored circle in the center represents the primary network of SB which is level 0, the primary network got divided into seven modules after clustering making it the next level of hierarchy i.e., level 1. Each subsequent circle represents the next level of the SB network’s organization and arrows indicate submodules emerging from the previous module. (B) tracing of the seed genes through different hierarchical levels of the SB network starting from the main network (SB) i.e., level 0 up to the motif level i.e., level 6.
FIGURE 5
FIGURE 5
Features of the SB network (A) modularity (Q) plotted against levels of the hierarchical organization of the SB network. (B) Hamiltonian Energy (HE) plotted against levels of the hierarchical organization of the SB network. (C) variation in the calculated average LCP-corr coefficient as a function of levels of the hierarchical organization of the SB network.
FIGURE 6
FIGURE 6
(A) modular path of the KRs starting from the main network to the motif level. The seed-gene-KRs are shown in red and their interacting-partner-KRs are shown in green. (B) KRs probability distribution as a function of levels of the hierarchical organization of the SB network.
FIGURE 7
FIGURE 7
(A) showing the seed genes in the decreasing order of their degree with TP53 having the highest degree. (B) comparison of the Hamiltonian Energy (HE) of the original (black) and the corresponding motifs knockout networks (red) at different levels of the hierarchical organization of the SB network.
FIGURE 8
FIGURE 8
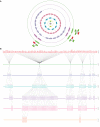
(A) raw rich-club coefficient (ϕ) of the SB network as a function of degree k. (B) normalized rich-club coefficient (ϕnorm) of the SB network as a function of degree k. (C) rich club nodes of the SB network, the KR genes which emerged as rich-club nodes are highlighted in red.

Similar articles

Cited by

  • Comprehensive mapping of the AOP-Wiki database: identifying biological and disease gaps.
    Jaylet T, Coustillet T, Smith NM, Viviani B, Lindeman B, Vergauwen L, Myhre O, Yarar N, Gostner JM, Monfort-Lanzas P, Jornod F, Holbech H, Coumoul X, Sarigiannis DA, Antczak P, Bal-Price A, Fritsche E, Kuchovska E, Stratidakis AK, Barouki R, Kim MJ, Taboureau O, Wojewodzic MW, Knapen D, Audouze K. Jaylet T, et al. Front Toxicol. 2024 Mar 8;6:1285768. doi: 10.3389/ftox.2024.1285768. eCollection 2024. Front Toxicol. 2024. PMID: 38523647 Free PMC article.

References

    1. Agopian A. J., Bhalla A. D., Boerwinkle E., Finnell R. H., Grove M. L., Hixson J. E., et al. (2013). Exon sequencing of PAX3 and T (brachyury) in cases with spina bifida. Br. Defects Res. A. Clin. Mol. Teratol. 97 597–601. 10.1002/bdra.23163 - DOI - PMC - PubMed
    1. Alawieh Z., Sabra M., Sabra L., Tomlinson S., Zaraket F. A. (2015). A rich-club organization in brain ischemia protein interaction network. Sci. Rep. 5:13513. 10.1038/srep13513 - DOI - PMC - PubMed
    1. Albert R., Barabási A.-L. (2002). Statistical mechanics of complex networks. Rev. Mod. Phys. 74 47–97. 10.1103/RevModPhys.74.47 - DOI
    1. Ali S., Malik M. D. Z., Singh S. S., Chirom K., Ishrat R., Singh R. K. B. (2018). Exploring el key regulators in breast cancer network. PLoS One 13:e0198525. 10.1371/journal.pone.0198525 - DOI - PMC - PubMed
    1. Amorosi S., D’Armiento M., Calcagno G., Russo I., Adriani M., Christiano A. M., et al. (2008). FOXN1 homozygous mutation associated with anencephaly and severe neural tube defect in human athymic Nude/SCID fetus. Clin. Genet. 73 380–384. 10.1111/j.1399-0004.2008.00977.x - DOI - PubMed

LinkOut - more resources