

Three-dimensional-arterial spin labeling perfusion correlation with diabetes-associated cognitive dysfunction and vascular endothelial growth factor in type 2 diabetes mellitus rat
- PMID: 33889293
- PMCID: PMC8040076
- DOI: 10.4239/wjd.v12.i4.499
Three-dimensional-arterial spin labeling perfusion correlation with diabetes-associated cognitive dysfunction and vascular endothelial growth factor in type 2 diabetes mellitus rat
Abstract
Background: Type 2 diabetes mellitus (T2DM) has been strongly associated with an increased risk of developing cognitive dysfunction and dementia. The mechanisms of diabetes-associated cognitive dysfunction (DACD) have not been fully elucidated to date. Some studies proved lower cerebral blood flow (CBF) in the hippocampus was associated with poor executive function and memory in T2DM. Increasing evidence showed that diabetes leads to abnormal vascular endothelial growth factor (VEGF) expression and CBF changes in humans and animal models. In this study, we hypothesized that DACD was correlated with CBF alteration as measured by three-dimensional (3D) arterial spin labeling (3D-ASL) and VEGF expression in the hippocampus.
Aim: To assess the correlation between CBF (measured by 3D-ASL and VEGF expression) and DACD in a rat model of T2DM.
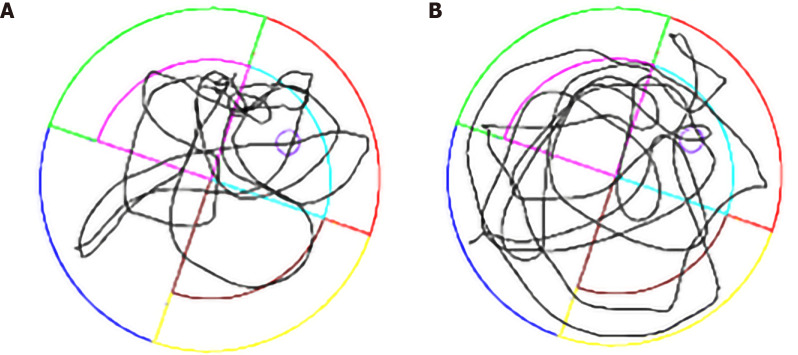
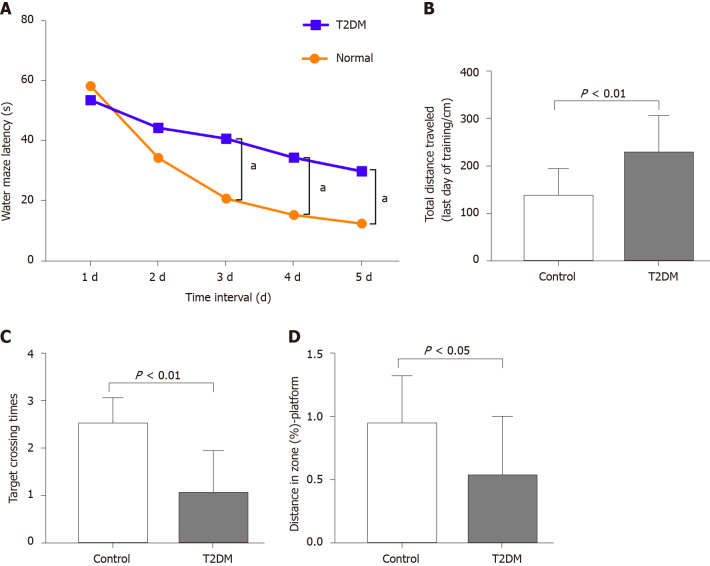
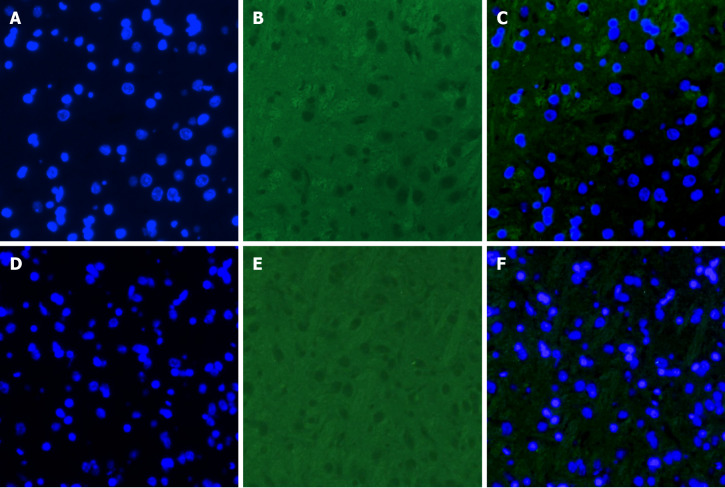
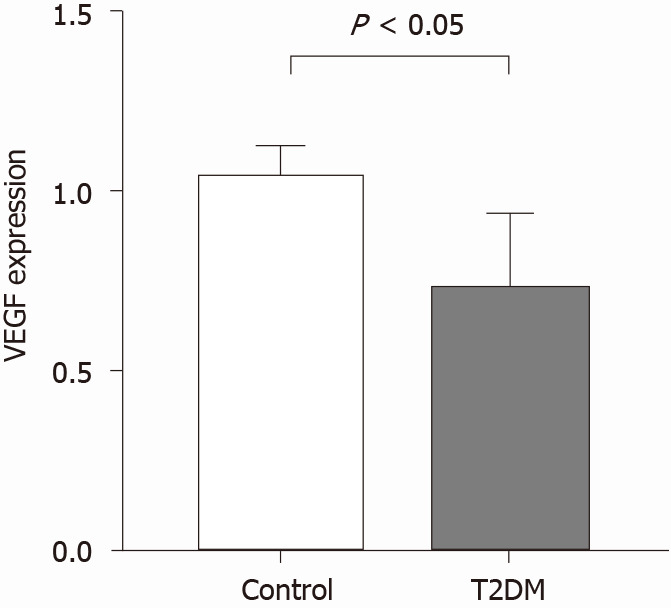
Methods: Forty Sprague-Dawley male rats were divided into control and T2DM groups. The T2DM group was established by feeding rats a high-fat diet and glucose to induce impaired glucose tolerance and then injecting them with streptozotocin to induce T2DM. Cognitive function was assessed using the Morris water maze experiment. The CBF changes were measured by 3D-ASL magnetic resonance imaging. VEGF expression was determined using immunofluorescence.
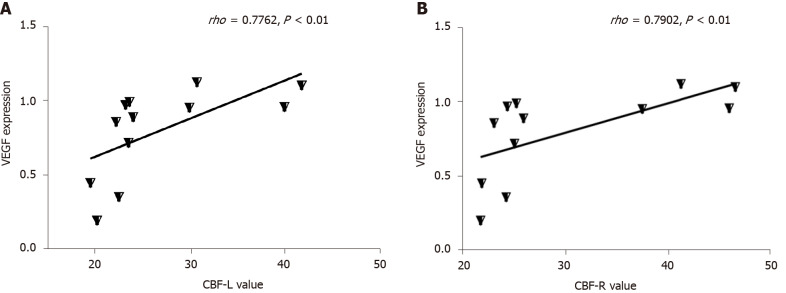
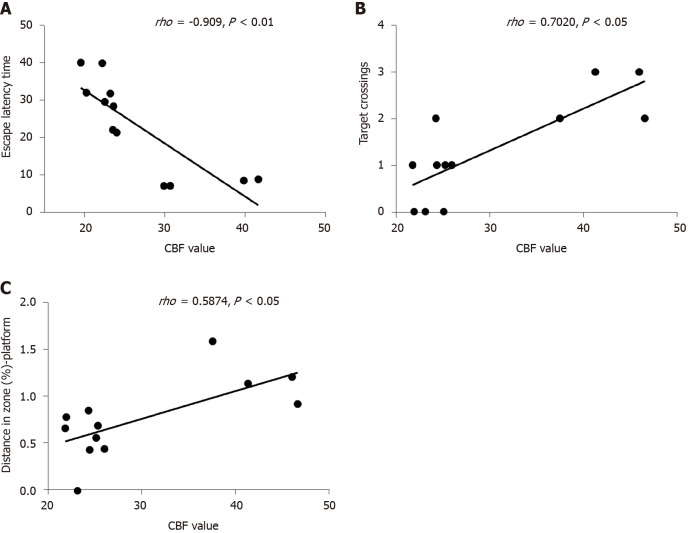
Results: The escape latency time significantly reduced 15 wk after streptozotocin injection in the T2DM group. The total distance traveled was longer in the T2DM group; also, the platform was crossed fewer times. The percentage of distance in the target zone significantly decreased. CBF decreased in the bilateral hippocampus in the T2DM group. No difference was found between the right CBF value and the left CBF value in the T2DM group. The VEGF expression level in the hippocampus was lower in the T2DM group and correlated with the CBF value. The escape latency negatively correlated with the CBF value. The number of rats crossing the platform positively correlated with the CBF value.
Conclusion: Low CBF in the hippocampus and decreased VEGF expression might be crucial in DACD. CBF measured by 3D-ASL might serve as a noninvasive imaging biomarker for cognitive impairment associated with T2DM.
Keywords: Diabetes mellitus; Diabetes-associated cognitive dysfunction; Hippocampus; Perfusion imaging; Receptors; Three-dimensional pseudo-continuous arterial spin labeling; Type 2; Vascular endothelial growth factor.
©The Author(s) 2021. Published by Baishideng Publishing Group Inc. All rights reserved.
Conflict of interest statement
Conflict-of-interest statement: No potential conflicts of interest.
Figures

References
-
- Chatterjee S, Khunti K, Davies MJ. Type 2 diabetes. Lancet. 2017;389:2239–2251. - PubMed
-
- International Diabetes Federation. International Diabetes Federation Diabetes Atlas. 9th ed. Brussels: The Institute; 2019.
-
- Cheng G, Huang C, Deng H, Wang H. Diabetes as a risk factor for dementia and mild cognitive impairment: a meta-analysis of longitudinal studies. Intern Med J. 2012;42:484–491. - PubMed
-
- McCrimmon RJ, Ryan CM, Frier BM. Diabetes and cognitive dysfunction. Lancet. 2012;379:2291–2299. - PubMed
LinkOut - more resources
Full Text Sources
Other Literature Sources
