. 2021 Apr 13;12(8):823-844.
doi: 10.18632/oncotarget.27940.

Carcinoma cells that have undergone an epithelial-mesenchymal transition differentiate into endothelial cells and contribute to tumor growth

Affiliations

Carcinoma cells that have undergone an epithelial-mesenchymal transition differentiate into endothelial cells and contribute to tumor growth

Nathalie Sphyris et al. Oncotarget. .

Abstract

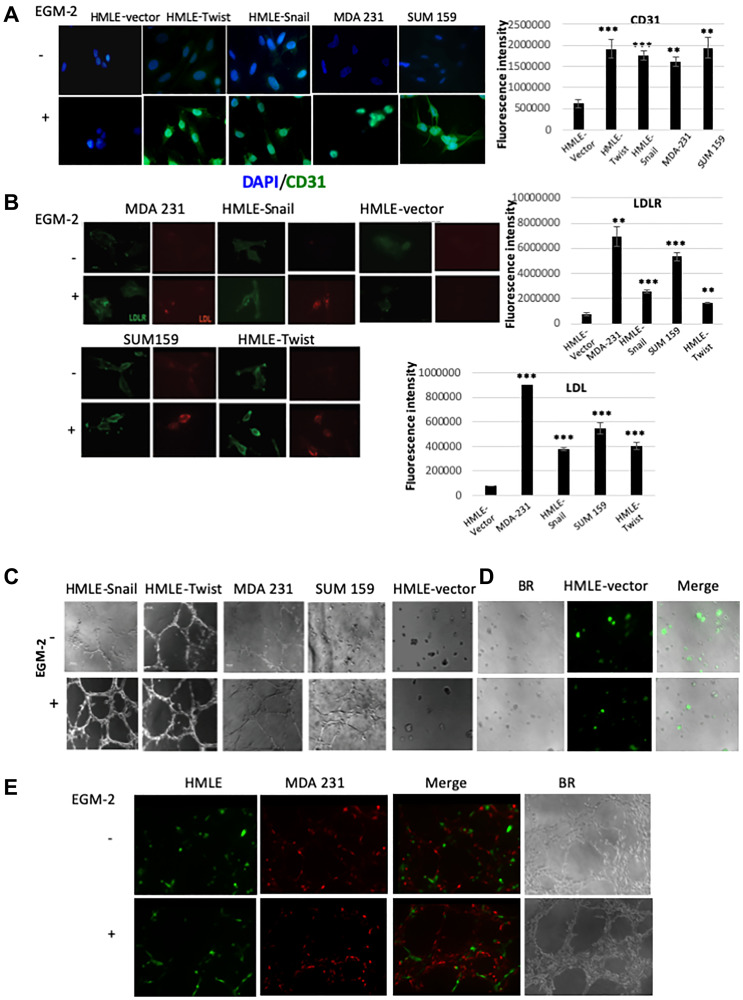
Hypoxia stimulates neoangiogenesis, promoting tumor outgrowth, and triggers the epithelial-mesenchymal transition (EMT), which bestows cells with mesenchymal traits and multi-lineage differentiation potential. Here, we investigated whether EMT can confer endothelial attributes upon carcinoma cells, augmenting tumor growth and vascularization. Following orthotopic implantation of MCF-7 human epithelial breast cancer cells into mice, tumors of different sizes were immunostained for markers of hypoxia and EMT. Larger tumors were well-vascularized with CD31-positive cells of human origin. Hypoxic regions, demarcated by HIF-1α staining, exhibited focal areas of E-cadherin loss and elevated levels of vimentin and the EMT-mediator FOXC2. Implantation of MCF-7 cells, co-mixed with human mammary epithelial (HMLE) cells overexpressing the EMT-inducer Snail, markedly potentiated tumor growth and vascularization, compared with MCF-7 cells injected alone or co-mixed with HMLE-vector cells. Intra-tumoral vessels contained CD31-positive cells derived from either donor cell type. FOXC2 knockdown abrogated the potentiating effects of HMLE-Snail cells on MCF-7 tumor growth and vascularization, and compromised endothelial transdifferentiation of mesenchymal cells cultured in endothelial growth medium. Hence, cells that have undergone EMT can promote tumor growth and neovascularization either indirectly, by promoting endothelial transdifferentiation of carcinoma cells, or directly, by acquiring an endothelial phenotype, with FOXC2 playing key roles in these processes.

Keywords: FOXC2; angiogenesis; endothelial transdifferentiation; epithelial-mesenchymal transition; vasculogenic mimicry.


Conflict of interest statement

CONFLICTS OF INTEREST The authors have no conflicts of interest to declare.

Figures

Figure 1
Figure 1. MCF-7 tumors of different sizes exhibit progressively developed vasculatures incorporating CD31-positive cells of human donor origin.
RFP/luciferase-labeled MCF-7 cells were orthotopically implanted into recipient NOD/SCID hosts. Tumors were allowed to grow to different sizes over time and harvested when their size reached approximately ≤ 2 mm, 5–7 mm, or 14–15 mm in longitudinal diameter (corresponding to 2, 6, and 10 weeks post implantation, respectively). Tumor growth was monitored weekly using caliper measurements and bioluminescent imaging. As MCF-7 cells are only weakly tumorigenic, some of the implanted tumors had developed only sub-millimeter primary tumors at necropsy that were too small to be excised and analyzed. n = 5 mice per group (2 implantations into contralateral glands per mouse). (A) Contralateral orthotopic injections of 1 × 10⁶ MCF-7 cells yielded bioluminescent signals of similar intensity as imaged on day 1 post implantation (top panels). Macroscopic images of the resulting tumors of different sizes, measuring approximately ≤ 2 mm, 5–7 mm, or 14–15 mm in longitudinal diameter, and harvested 2, 6, and 10 weeks post implantation, respectively (bottom panels). The estimated volumes of the tumors, grouped according to longitudinal diameter, are represented graphically (right). The box and whisker plots show the median tumor volume per group (horizontal bar within the box), 25% percentile (bottom of box), 25th to the 75th percentile (top of box), and whiskers which extend an additional 1.5× the interquartile range. *** P < 0.001; Student’s t-test, two-tailed. (B) Representative hematoxylin and eosin (H&E) staining of sections from the core regions of the primary tumors described in (A). The location of blood vessels is indicated by arrows. Scale bar, 100 μm. The average number of blood vessels per microscopic field of the H&E-stained tumor sections is plotted on the right. (C) Representative immunofluorescent staining of the core regions of the tumors described in (A), using an antibody recognizing human CD31 (green). Nuclei were counterstained with DAPI (blue). Right panels are merged images of individual channels. The boxed areas represent high-magnification images of encircled areas. Scale bar, 100 μm. Representative images are shown. The average number of CD31-positive structures per microscopic field according to tumor size (longitudinal diameter) is plotted on the right. Student’s t-test was performed to test significance. Data indicate mean ± SEM. n = 5. * P < 0.05, ** P < 0.01, *** P < 0.001.
Figure 2
Figure 2. MCF-7 tumor outgrowth is accompanied by increased expression of markers of EMT and hypoxia.
RFP/luciferase-labeled MCF-7 cells were orthotopically injected into recipient NOD/SCID hosts, and tumors were allowed to grow to until their size reached approximately ≤ 2 mm, 5–7 mm, or 14–15 mm in longitudinal diameter. n = 5 mice per group. The excised tumors (shown in Figure 1A) were fixed in formalin, paraffin-embedded, and sectioned (5 microns thick) prior to immunostaining with the indicated primary antibodies against: HIF-1α (A), FOXC2 (B), E-cadherin (C), and vimentin (D), each pseudo-colored green in the respective images. Dual staining with anti-RFP antibody (red) confirms that the stained tumor cells originate from the injected MCF-7 cells and not the mouse hosts. Nuclei were counterstained with DAPI (blue). Right panels are merged images of individual channels. Note the encircled areas displaying localized loss of E-cadherin immunoreactivity in tumors sized 5–7 mm and 14–15 mm. Scale bars, 100 μm. Representative images are shown.
Figure 3
Figure 3. Cells that have undergone EMT promote endothelial transdifferentiation, neovascularization, and outgrowth of admixed MCF-7 cells.
RFP/luciferase-labeled MCF-7 cells (0.5 × 10⁶) were co-mixed with MCF-7, HMLE-vector, HMLE-Snail, or HMLE-Twist cells at a 1:1 ratio (0.5 × 10⁶ cells per cell type) and orthotopically implanted into female NOD/SCID mice. The mice were sacrificed 5 weeks post implantation, and the primary tumors were excised. n = 5 mice per group. (A) Macroscopic images of the primary tumors from mice injected with admixtures of 0.5 × 10⁶ MCF-7 cells with 0.5 × 10⁶ MCF-7, HMLE-vector, HMLE-Snail, or HMLE-Twist cells. In the experiment presented, one mouse injected with MCF-7/HMLE-vector cells developed sub-millimeter tumors that were too small to be analyzed at necropsy, and two mice injected with MCF-7/HMLE-Twist cells succumbed to their tumor burden before the end of the 5-week study duration. Note the pink/reddish color of MCF-7/HMLE-Snail and MCF-7/HMLE-Twist tumors compared with the pale appearance of tumors formed by MCF-7 cells injected either alone or admixed with HMLE-vector cells. Scale bar, 1 cm. (B) The size of the excised primary tumors, shown in (A), was measured with a caliper, and the tumor volume (mm3) was calculated using a modified ellipsoid formula as described in Materials and Methods. The calculated tumor volumes (y-axis) are plotted against the composition of the implanted admixtures (x-axis) of MCF cells with: MCF-7 cells alone (none), HMLE-vector (HMLE), HMLE-Snail (HMLE-Snail), or HMLE-Twist (HMLE-Twist). Horizontal bars indicate the mean tumor volume. (C) Representative H&E staining of sections from the core regions of the primary tumors, harvested 5 weeks post implantation as described in (A). The location of blood vessels is indicated by arrows. Scale bar, 100 μm. The average number of blood vessels per microscopic field is shown on the right. (D) Representative immunofluorescent staining of the core regions of the primary tumors, harvested 5 weeks post implantation as described in (A), using antibodies recognizing human CD31 (green) and RFP (red). Nuclei were counterstained with DAPI (blue). Right panels are merged images of individual channels. Insets represent images of selected regions. Scale bar, 100 μm. Representative images are shown. Student’s t-test was performed to test significance. Data indicate mean ± SEM. n = 5. * P < 0.05, ** P < 0.01, *** P < 0.001.
Figure 4
Figure 4. HMLE-Snail cells gain CD31 expression and promote acquisition of mesenchymal traits by admixed MCF-7 cells.
RFP/luciferase-labeled MCF-7 cells (0.5 × 10⁶) were co-mixed with 0.5 × 10⁶ MCF-7, HMLE-vector, or HMLE-Snail cells, and orthotopically implanted into female NOD/SCID mice. Ten weeks post implantation, the tumors were harvested and processed for immunofluorescent staining. n = 5 mice per group. (A, B) Tumor core sections were co-stained with antibodies directed against RFP (red) and either E-cadherin (A) or vimentin (B), both pseudo-colored green. Nuclei were counterstained with DAPI (blue). Right panels are merged images of individual channels. Note the progressive reduction of E-cadherin expression, commensurate with the attenuation of the honeycomb-like membrane staining pattern across these tumor cores and the inversely-correlated augmented vimentin staining. (C) Sections from the tumor cores were co-stained with antibodies directed against the SV40 large-T antigen (green) and human CD31 (red). Nuclei were counterstained with DAPI (blue). Right panels are merged images of individual channels. Arrows indicate SV40 large-T antigen/CD31 double-positive cells lining the lumens of vascular structures in tumors formed by admixed MCF-7/HMLE-Snail cells. Boxed areas represent high-magnification images of selected encircled areas. Scale bars, 100 μm. Representative images are shown.
Figure 5
Figure 5. Cells that have undergone EMT can acquire endothelial-like phenotypic traits and functional behaviors in vitro.
(A) The indicated cells were cultured in cell-specific medium (-EGM-2) or endothelial cell growth medium (+EGM-2). After 8–10 days, cells were fixed and immunostained for CD31 (green). Nuclei were counterstained with DAPI (blue). The bar graph on the right shows the mean fluorescence intensity of CD31 immunostaining in cells cultured in EGM-2 relative to cells cultured in cell-specific medium. (B) The indicated cells were cultured in cell-specific medium (-EGM-2) or endothelial cell growth medium (+EGM-2) for 2 days. Cells were incubated with an LDL-DyLight™ 549 conjugate for 4 hours prior to fixation and immunostaining. The distribution of the LDL-receptor (LDLR; green) and the LDL-DyLight™ 549 conjugate (LDL; red) were imaged using fluorescence microscopy. Note the punctate perinuclear staining pattern of the LDL-DyLight™ 549 conjugate, consistent with complex internalization and accumulation in lysosomal membranes. The mean fluorescence intensity of of LDL and LDLR in cells cultured in EGM-2, relative to cells cultured in cell-specific medium, is shown in the bar graphs to the right of the corresponding images. Scale bar: 20 μm (C) The indicated cells were cultured in cell-specific medium (-EGM-2) or endothelial cell growth medium (+EGM-2) and plated onto Matrigel. After 24 hours, the ability of the cells to organize into capillary-like structures was determined using brightfield microscopy. (D) GFP-labeled HMLE cells were plated onto Matrigel in cell-specific medium (-EGM-2) or endothelial cell growth medium (+EGM-2). After 24 hours, the cells were imaged using brightfield (BR) and fluorescence microscopy. Right panels are overlays of brightfield and fluorescent images (Merge). GFP-labeled HMLE cells (green) failed to form interconnecting tubular structures autonomously, irrespective of culture medium. (E) GFP-labeled HMLE (green) and RFP-labeled MDA-MB-231 (abbreviated to MDA 231; red) cells were co-mixed and plated onto Matrigel in the presence of EGM-2. After 24 hours, the cells were imaged using brightfield (BR) and fluorescence microscopy. Merged images of individual fluorescent channels show the incorporation of each cell type into mosaic tubular structures (Merge). Representative images are shown (n = 4). The fluorescence intensity for the evaluation of gene expression analysis was performed using ImageJ software [73, 74]. Student’s t-test was performed to test significance. Data indicate mean ± SEM. n = 5. * P < 0.05, ** P < 0.01, *** P < 0.001.
Figure 6
Figure 6. FOXC2 is necessary for the acquisition of endothelial phenotypic and functional characteristics in vitro.
(A) Immortalized (HMLE) and RAS-transformed (HMLER) human mammary epithelial cells were plated in cell-specific medium. After 24 hours, the cells were treated either with vehicle or desferrioxamine (DFX), a hypoxia-mimetic, for 48 hours prior to fixation and immunostaining for FOXC2 (green) and HIF-1α (red). Nuclei were counterstained with DAPI (blue). Right panels are merged images of individual channels. Scale bar: 20 μm. (B) HMLE cells, transduced with shRNAs targeting firefly luciferase (shControl) or FOXC2 (shFOXC2), were treated with DFX for 48 hours. Following DFX treatment, the cells were fixed and immunostained for HIF-1α (green) and KDR (red). Nuclei were counterstained with DAPI (blue). Right panels are merged images of individual channels. Scale bar: 20 μm (C) GFP-labeled HMLE cells (green) were co-mixed with either MDA-MB-231-shControl or MDA-MB-231-shFOXC2 cells and plated onto Matrigel in EGM-2. After 24 hours, the cells were imaged using brightfield (BR) and fluorescence microscopy. Right panels are overlays of brightfield and fluorescent images. The impact of FOXC2 knockdown on the ability of MDA-MB-231 cells to form vascular-like networks and stimulate the incorporation of GFP-labeled HMLE cells into mosaic structures was examined. (D) GFP-labeled HMLE cells (green) were co-mixed with either HMLE-Snail-shControl or HMLE-Snail-shFOXC2 cells and plated onto Matrigel in EGM-2. After 24 hours, the cells were imaged, using brightfield (BR) and fluorescence microscopy, and the formation of tubular structures assessed. Right panels are overlays of brightfield and fluorescent images. Representative images are shown. MDA-MB-231 have been abbreviated to MDA 231.
Figure 7
Figure 7. FOXC2 is necessary for the ability of cells that have undergone EMT to augment neoangiogenesis.
(A) RFP/luciferase-labeled MCF-7 cells were admixed with either HMLE-Snail-shControl or HMLE-Snail-shFOXC2 cells, and orthotopically implanted into female NOD/SCID mice. The bioluminescent signal emitted by the implanted cells, or the resulting primary tumors, was recorded using bioluminescent imaging 1 day post injection and 8 weeks post implantation, respectively. Blue, least intense, to red, most intense. (B) The tumors from the mice in (A) were excised and imaged prior to processing for histology. Graphical representation of the tumor volumes at endpoint is shown on the right. (C) Tissue sections, from the core regions of the tumors in (B), were stained with H&E. Arrows indicate the location of blood vessels. Scale bar, 100 μm. The average number of blood vessels per microscopic field is plotted on the right. (D) Tissue sections, from the core regions of the tumors in (B), were co-stained with antibodies directed against the SV40 large-T antigen (green) and human CD31 (red). Nuclei were counterstained with DAPI (blue). Right panels are merged images of individual channels. Insets represent high-magnification images of encircled areas. Arrows indicate SV40 large-T antigen/CD31 double-positive cells. Scale bar, 100 μm. n = 5 mice/group. Representative images are shown.

Similar articles

Cited by

References

    1. Risau W. Mechanisms of angiogenesis. Nature. 1997; 386:671–74. 10.1038/386671a0. - DOI - PubMed
    1. Baeriswyl V, Christofori G. The angiogenic switch in carcinogenesis. Semin Cancer Biol. 2009; 19:329–37. 10.1016/j.semcancer.2009.05.003. - DOI - PubMed
    1. Hanahan D, Weinberg RA. Hallmarks of cancer: the next generation. Cell. 2011; 144:646–74. 10.1016/j.cell.2011.02.013. - DOI - PubMed
    1. Folkman J. What is the evidence that tumors are angiogenesis dependent? J Natl Cancer Inst. 1990; 82:4–6. 10.1093/jnci/82.1.4. - DOI - PubMed
    1. McDougall SR, Anderson AR, Chaplain MA. Mathematical modelling of dynamic adaptive tumour-induced angiogenesis: clinical implications and therapeutic targeting strategies. J Theor Biol. 2006; 241:564–89. 10.1016/j.jtbi.2005.12.022. - DOI - PubMed