. 2021 Apr 6:9:628039.
doi: 10.3389/fcell.2021.628039. eCollection 2021.

Differential Expression of Insulin-Like Growth Factor 1 and Wnt Family Member 4 Correlates With Functional Heterogeneity of Human Dermal Fibroblasts

Affiliations

Differential Expression of Insulin-Like Growth Factor 1 and Wnt Family Member 4 Correlates With Functional Heterogeneity of Human Dermal Fibroblasts

Oliver J Culley et al. Front Cell Dev Biol. .

Abstract

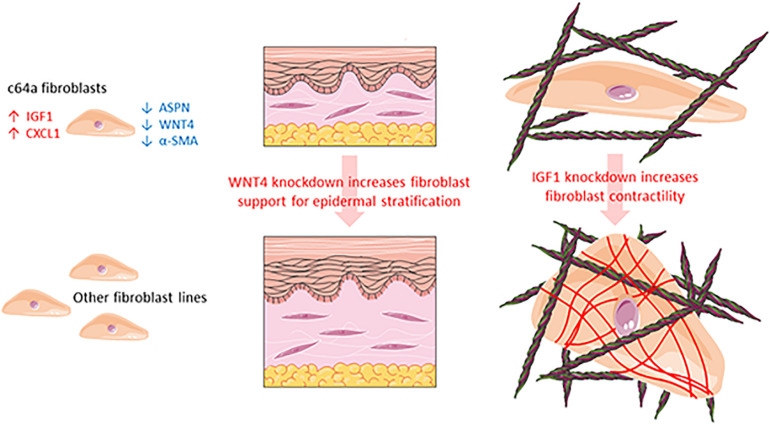
Although human dermis contains distinct fibroblast subpopulations, the functional heterogeneity of fibroblast lines from different donors is under-appreciated. We identified one commercially sourced fibroblast line (c64a) that failed to express α-smooth muscle actin (α-SMA), a marker linked to fibroblast contractility, even when treated with transforming growth factor-β1 (TGF-β1). Gene expression profiling identified insulin-like growth factor 1 (IGF1) as being expressed more highly, and Asporin (ASPN) and Wnt family member 4 (WNT4) expressed at lower levels, in c64a fibroblasts compared to three fibroblast lines that had been generated in-house, independent of TGF-β1 treatment. TGF-β1 increased expression of C-X-C motif chemokine ligand 1 (CXCL1) in c64a cells to a greater extent than in the other lines. The c64a gene expression profile did not correspond to any dermal fibroblast subpopulation identified by single-cell RNAseq of freshly isolated human skin cells. In skin reconstitution assays, c64a fibroblasts did not support epidermal stratification as effectively as other lines tested. In fibroblast lines generated in-house, shRNA-mediated knockdown of IGF1 increased α-SMA expression without affecting epidermal stratification. Conversely, WNT4 knockdown had no consistent effect on α-SMA expression, but increased the ability of fibroblasts to support epidermal stratification. Thus, by comparing the properties of different lines of cultured dermal fibroblasts, we have identified IGF1 and WNT4 as candidate mediators of two distinct dermal functions: myofibroblast formation and epidermal maintenance.

Keywords: IGF1; WNT4; cell culture; epidermis; fibroblasts; signalling; skin; α-SMA.


Conflict of interest statement

DH, GJ, and RB are employees of Unilever. FW is on secondment as Executive Chair, Medical Research Council. The remaining authors declare that the research was conducted in the absence of any commercial or financial relationships that could be construed as a potential conflict of interest.

Figures

FIGURE 1
FIGURE 1
NHDF phenotypes. NHDF lines were untreated, treated with TGF-β1 (10 ng/ml) and/or RepSox (25 μM) in DMEM containing 1% FBS and assayed for cell number (A), differentiation (% α-SMA positive, B), proliferation (% EdU positive, C), and shape (% spindle-shaped, D). Fluorescence intensity was thresholded on the maximum signal in unlabelled NHDF (B,C). Error bars represent SD of mean values in triplicate wells of three 96-well microplates (n = 3). Two-way ANOVA comparing TGF-β1/RepSox treated versus own control NHDF (*), or c64a and different cell lines under the same condition (#) (A–D) (Tukey’s multiple comparisons test; #p < 0.05, **,##p < 0.01, ***,###p < 0.001). (E) Representative images of PromoCell NHDF (c19, c24, c64a, and c64b) cultured in low (1%) serum DMEM. (Left) Input image with NucBlue (blue) EdU (green), α-SMA (orange), and CellMask (red). (Right) Spindle-shaped (green) and non-spindle-shaped (red) cells. Cells on the image border (grey) were excluded from analysis. Scale bar: 200 μm.
FIGURE 2
FIGURE 2
Clustering of genes differentially expressed in c64a fibroblasts. (A) 150 probes representing 140 differentially expressed genes at 12 or 24 h in low serum DMEM. (B) 126 probes representing 115 differentially expressed genes after treatment with TGF-β1 for 12 or 24 h in low serum DMEM. LogFC ±2, adjusted p < 0.05. Fibroblast lines were F22Br, M50F, F60Br, and PromoCell c64a. Code: Non-treated (C) or TGF-β1-treated (T) were analysed at 12 or 24 h in three independent experiments (0, 1, 2 in A; 1, 2, 3 in B).
FIGURE 3
FIGURE 3
Mapping of candidate markers onto scRNAseq dataset of Tabib et al. (2018). (A) Subpopulations of fibroblasts identified by expression of SFRP2/DPP4 and FMO1/LSP1. (B) Subpopulations expressing THY1 (CD90; a pan-fibroblast marker); ENTPD1 (CD39), a papillary fibroblast marker; CD36, a reticular fibroblast marker (Philippeos et al., 2018); and ACTA2 (α-SMA). (C) Genes differentially expressed in c64a fibroblasts. Transcript expression of the selected markers is overlaid on the 2D t-SNE space of human fibroblasts in the dataset of Tabib et al. (2018). Size and colour represent Log10(TPM) normalised expression values. t-SNE, t-distributed stochastic neighbour embedding; TPM, transcripts per million.
FIGURE 4
FIGURE 4
Expression of fibroblast markers. ΔCq expression of (A) ASPN, (B) CXCL1, (C) IGF1, and (D) WNT4, 24 h after treatment with TGF-β1 or low serum DMEM (control). Expression relative to reference gene (PPIA). Error bars represent SD of mean values from three independent experiments (n = 3). Two-way ANOVA comparing c64a with the fibroblast lines indicated. Dunnett’s multiple comparisons test. *p < 0.05, **p < 0.01, and ***p < 0.001. TGF-β1 treatment (D) had a significant effect on WNT4 expression in the case of M50F and F60Br (p < 0.001, Sidak’s multiple comparisons test) but not F22Br or c64a. α-SMA (ACTA2) gene expression levels in NHDF expressing shIGF1 (E) and shWNT4 (F). Bars represent ΔΔCq expression values for each NHDF line, relative to non-coding control (shControl; —), normalised to the reference gene (18S). Effect of IGF1 knockdown (shIGF1, G) and WNT4 knockdown (shWNT4, H) on PromoCell c19 and c24 lines. Control cells (low serum DMEM) and TGF-β1-treated cells (10 ng/ml, in low serum DMEM) were assayed for % α-SMA positive cells. Error bars represent SD of mean values of triplicate wells in 3 × 96-well microplates (n = 1 experiment). Two-way ANOVA comparing targeted NHDF (shTarget) with own non-coding control. Tukey’s multiple comparisons test. ##p < 0.01, and ###p < 0.001.
FIGURE 5
FIGURE 5
Epidermal thickness in skin reconstitution models. H&E stained sections of de-epidermised dermis (DED), seeded with keratinocytes and grown at the air-liquid interface for 2 weeks (A). The dermis was reconstituted with the NHDF indicated or did not contain fibroblasts. Scale bar: 200 μm. (B) Quantitation of epidermal thickness. One-way ANOVA comparing c64a-reconstituted skin with other conditions. Tukey’s multiple comparisons test. ***p < 0.001. Data are from three biological replicates per condition. Two histological slides of each DED, containing four sections per slide, were analysed (eight data points per condition), corresponding to a total of 30 slides and 120 H&E stained sections. Sections were imaged using the NanoZoomer 2.0RS at 20x magnification. Error bars represent SD.
FIGURE 6
FIGURE 6
Effect of shRNA-based lentiviral knockdown of IGF1 and WNT4 in skin reconstitution models. (A) Examples of H&E stained sections. Scale bar: 250 μm. (B,C) Quantitation of epidermal thickness. (B) Individual lentiviral-targeted NHDF: female 22-year-old breast skin (F22Br), female 36-year-old breast skin (F36Br), female 44-year-old breast skin (F44Br), and 60-year-old breast skin (F60Br). (C) Pooled data from the four individual lines in (B). One-way ANOVA, Dunnett’s multiple comparisons test compared with shControl. Error bars represent SD of data points. ***p < 0.001. Data collection as in Figure 5, except that n = 1 DED for each lentiviral-targeted cell line and n = 2 for control (no NHDF) DEDs.
FIGURE 7
FIGURE 7
Schematic summarising the different properties of c64a fibroblasts compared to other fibroblast lines.

References

    1. Ashburner M., Ball C. A., Blake J. A., Botstein D., Butlerm H., Cherry J. M., et al. (2000). Gene ontology: tool for the unification of biology. Nat. Genet. 25 25–29. - PMC - PubMed
    1. Bajouri A., Orouji Z., Taghiabadi E., Nazari A., Shahbazi A., Fallah N., et al. (2020). Long-term follow-up of autologous fibroblast transplantation for facial contour deformities, a non-randomized phase IIa clinical trial. Cell J. 22 75–84. - PMC - PubMed
    1. Ben-David U., Beroukhim R., Golub T. R. (2019). Genomic evolution of cancer models: perils and opportunities. Nat. Rev. Cancer 19 97–109. 10.1038/s41568-018-0095-3 - DOI - PMC - PubMed
    1. Carre A. L., Hu M. S., James A. W., Kawai K., Galvez M. G., Longaker M. T., et al. (2018). β-catenin-dependent Wnt signaling: a pathway in acute cutaneous wounding. Plast. Reconstr. Surg. 141 669–678. 10.1097/prs.0000000000004170 - DOI - PMC - PubMed
    1. Clark R. A., McCoy G. A., Folkvord J. M., McPherson J. M. (1997). TGF-beta 1 stimulates cultured human fibroblasts to proliferate and produce tissue-like fibroplasia: a fibronectin matrix-dependent event. J. Cell. Physiol. 170 69–80. 10.1002/(sici)1097-4652(199701)170:1<69::aid-jcp8>3.0.co;2-j - DOI - PubMed