. 2021 Mar 5:8:634461.
doi: 10.3389/fmolb.2021.634461. eCollection 2021.

Acidic pH Decreases the Endonuclease Activity of Initiator RepB and Increases the Stability of the Covalent RepB-DNA Intermediate while Has Only a Limited Effect on the Replication of Plasmid pMV158 in Lactococcus lactis

Affiliations

Acidic pH Decreases the Endonuclease Activity of Initiator RepB and Increases the Stability of the Covalent RepB-DNA Intermediate while Has Only a Limited Effect on the Replication of Plasmid pMV158 in Lactococcus lactis

Rafael Valdelvira et al. Front Mol Biosci. .

Abstract

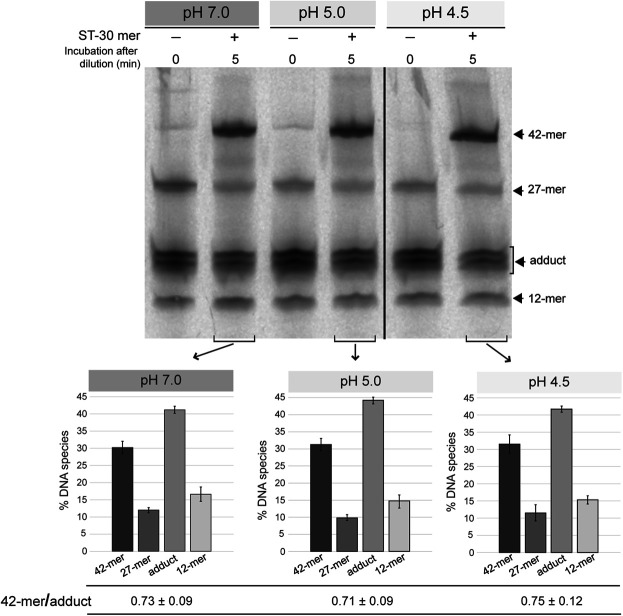
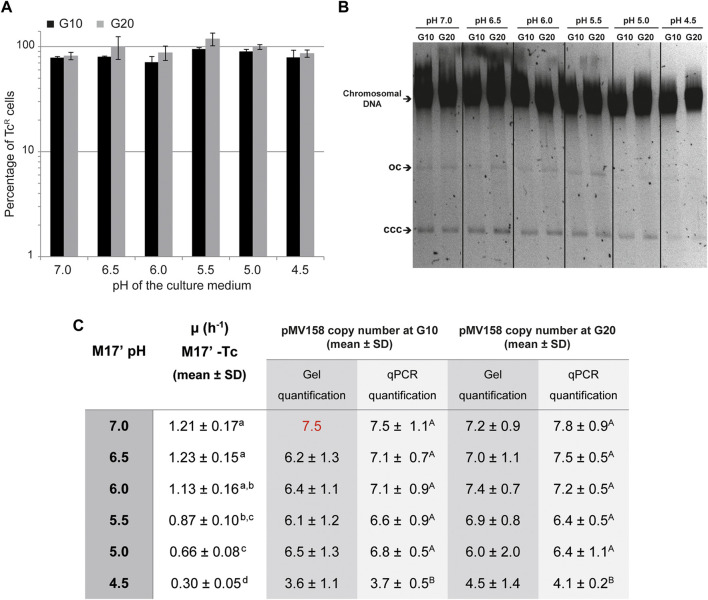
Plasmid vectors constitute a valuable tool for homologous and heterologous gene expression, for characterization of promoter and regulatory regions, and for genetic manipulation and labeling of bacteria. During the last years, a series of vectors based on promiscuous replicons of the pMV158 family have been developed for their employment in a variety of Gram-positive bacteria and proved to be useful for all above applications in lactic acid bacteria. A proper use of the plasmid vectors requires detailed knowledge of their main replicative features under the changing growth conditions of the studied bacteria, such as the acidification of the culture medium by lactic acid production. Initiation of pMV158 rolling-circle replication is catalyzed by the plasmid-encoded RepB protein, which performs a sequence-specific cleavage on one of the parental DNA strands and, as demonstrated in this work, establishes a covalent bond with the 5'-P end generated in the DNA. This covalent adduct must last until the leading-strand termination stage, where a new cleavage on the regenerated nick site and a subsequent strand-transfer reaction result in rejoining of the ends of the cleaved parental strand, whereas hydrolysis of the newly-generated adduct would release the protein from a nicked double-stranded DNA plasmid form. We have analyzed here the effect of pH on the different in vitro reactions catalyzed by RepB and on the in vivo replication ability of plasmid pMV158. We show that acidic pH greatly impairs the catalytic activity of the protein and reduces hydrolysis of the covalent RepB-DNA adduct, as expected for the nucleophilic nature of these reactions. Conversely, the ability of pMV158 to replicate in vivo, as monitored by the copy number and segregational stability of the plasmid in Lactococcus lactis, remains almost intact at extracellular pHs ranging from 7.0 to 5.0, and a significant reduction (by ∼50%) in the plasmid copy number per chromosome equivalent is only observed at pH 4.5. Moreover, the RepB to pMV158 molar ratio is increased at pH 4.5, suggesting the existence of compensatory mechanisms that operate in vivo to allow pMV158 replication at pH values that severely disturb the catalytic activity of the initiator protein.

Keywords: covalent RepB-DNA adduct; endonuclease activity; nucleophilic attack; promiscuous plasmid pMV158; rolling circle replication (RCR); strand-transfer activity.


Conflict of interest statement

The authors declare that the research was conducted in the absence of any commercial or financial relationships that could be construed as a potential conflict of interest.

Figures

FIGURE 1
FIGURE 1
Detection of the RepB-DNA covalent complex. (A) Direct visualization of the fluorescent DNA species that arise from the endonuclease activity of RepB6 and OBD on the ssDNA 27-mer oligo substrate. A prestained and chemiluminescent protein ladder was loaded in lane 1. Lanes 2 and 3 show the migration of fluorescent 27-mer substrate and chemically-synthesized 12-mer oligo, respectively. In lane 4, a mixture of OBD and chemically-synthesized fluorescent 12-mer oligo (which is not a substrate of the protein) was loaded. OBD (lanes 6 and 7) and RepB6 (lanes 9 and 10) were incubated for the indicated times with the 27-mer substrate. The slower migrating bands corresponding to covalent complexes between RepB6 or OBD and the fluorescent 12-mer DNA generated by cleavage of the 27-mer substrate are indicated. The dividing line indicates grouping of different parts of the same gel. (B) Detection of RepB6 and OBD in the gel shown in panel A by chemiluminescent western blotting employing anti-RepB polyclonal serum. Lanes 5 and 8 contain OBD and RepB6 proteins, respectively. The position of the slower migrating chemiluminescent bands that correspond to covalent complexes between RepB6 or OBD and the 12-mer oligo is indicated. The presence of DNA-free protein subunits was also detected and their position indicated. The dividing line indicates grouping of images of the same gel as indicated in panel (A). (C) Schematic description of the endonuclease reaction mediated by RepB6 or OBD.
FIGURE 2
FIGURE 2
Endonuclease activity of OBD at different pHs. (A) Reaction product pattern generated by the nicking and strand-transfer activities of OBD on ssDNA oligos at the indicated reaction pHs. The 27-mer oligo substrate (500 nM), labeled at its 3′-end with the fluorescent dye Cy5 (indicated by a star in panel (C)), and a 30-fold molar excess of the unlabeled 30-mer oligo were incubated with the protein (10 nM) at 25°C for 2 min. The resultant fluorescent oligos were analyzed by electrophoresis in 20% PAA-urea gels, and visualized with the aid of a FLA 3000 (FUJIFILM) imaging system. A representative gel from one of four independent experiments is displayed. The bands corresponding to the 12-mer DNA generated by cleavage of the 27-mer substrate and to the 42-mer DNA strand-transfer product are indicated. The covalent adduct is represented by a set of 2–3 bands that arise from partial digestion of OBD with proteinase K. (B) Vertical bar graph showing the percentage of reaction products rendered by OBD at the indicated pHs. The sum of all reaction products was considered for catalytic activity quantification. The percentage of activity obtained at pH 7.0 was used as a reference for normalization. Vertical bars represent the average value of four independent experiments. Error bars represent standard deviations. Average values with different lowercase letters were significantly (p < 0.05) different. (C) Schematic description of the different reaction products.
FIGURE 3
FIGURE 3
Strand-transfer activity of OBD at different pHs. Gel showing the reaction products that arise from the strand-transfer activity of OBD at different pHs. After setting up a nicking reaction (OBD:27-mer molar ratio of 1:1) in reaction buffer 7 at 25°C for 1 min, the mixture was diluted 10 times in buffers 7, 5.0, and 4.5. Next, the unlabeled 30-mer oligo was added to a 50-fold molar excess relative to the initial 27-mer oligo and the strand-transfer reaction was allowed to proceed for 5 min under the same conditions used for the nicking reaction. Aliquots of the three reactions were taken and analyzed. Aliquots of the diluted reactions before adding the 30-mer oligo were also analyzed and used as reference. The bands corresponding to the 12-mer DNA generated by cleavage of the 27-mer substrate and the 42-mer strand-transfer product are indicated (see reaction scheme in Figure 2C). The covalent adduct is represented by a set of 2–3 bands that arise from partial digestion of OBD with proteinase K. A representative gel of three different experiments is displayed. Below the gel image, three bar graphs represent the quantification of the different DNA species generated at the three reaction pHs analyzed. Vertical bars represent the average value of three different experiments and error bars represent standard deviations. The ratio (mean ± SD) between the percentages of the 42-mer product and the adduct for each quantification is also shown.
FIGURE 4
FIGURE 4
OBD-DNA adduct stability at different pHs. (A) Gels showing the effect of pH on the time course of the adduct-hydrolysis reaction. The reaction mixtures contained a 1.5:1 molar ratio of OBD to the 3′-fluorescently labeled 27-mer oligo substrate and were prepared in buffer 7. After 2 min of incubation at 25°C, the endonuclease reaction was stopped with 10 mM EDTA before diluting the mixtures in buffer 7, 6, 5.5, 5 or 4.5 for 1-h incubation at the same temperature. Several aliquots were taken every 10 min and analyzed in 20% PAA-urea gels. A gel showing the effect of denaturing the protein on the stability of the adduct is also shown. In this case, the endonuclease reaction was performed in buffer 7 for 2 min at 22°C, and then the mixture was diluted in buffer 7, treated with 0.2% SDS and incubated at the same temperature for 24 h. Several aliquots were taken at the indicated times and analyzed in 20% PAA-urea gels. A control lane (-OBD) showing the migration of the fluorescent 27-mer substrate is included. The dividing line indicates grouping of different parts of the same gel. (B) Kinetics of the hydrolysis of the OBD-DNA adduct at different pHs. The logarithm of the ratio between the fraction of adduct at each of the time intervals analyzed (adduct t) and the initial fraction (adduct t0) was plotted against time, and the experimental data were fitted to Eq. 2 by linear regression. The OBD-DNA adduct half-life time was calculated from the slope of the regression curve according to Eq. 3. Plots display the adduct decay curves obtained from at least five independent experiments for each pH, with the symbols and vertical bars representing the mean and standard deviation, respectively. (C) Table showing the adduct half-life time calculated from at least five independent experiments performed under the indicated reaction conditions. The values are expressed as mean ± SD. Values with different superscript letters were significantly (p < 0.05) different.
FIGURE 5
FIGURE 5
Segregational stability and PCN of pMV158 in L. lactis grown in M17′ adjusted to different pHs. (A) Analysis of the segregational stability of plasmid pMV158 in L. lactis MG1363. The stability of inheritance of pMV158 was analyzed after growing the lactoccocal cells for 10 and 20 generations in M17′ adjusted to different pH values in the absence of selective pressure. The vertical bars represent an estimation of the percentage of Tc resistant (TcR) cells after 10 (black bars) and 20 (gray bars) generations at the indicated pHs. Bar height represents the average value of three different analysis and error bars are standard deviations. (B) The gel shows the total DNA content of the L. lactis MG1363/pMV158 strain grown at the indicated pHs for 10 and 20 generations in the absence of Tc. Supercoiled monomeric (CCC) and open circle (OC) forms of pMV158 are indicated in the gel. Dividing lines indicate grouping of different parts of the same gel. This image is representative of at least three agarose gels used in the analysis and quantification of the DNA bands for PCN determination. (C) The table shows the pMV158 PCN in the lactococcal cells grown for 10 and 20 generations in Tc-free M17′ adjusted to different pHs. The pMV158 PCN per chromosome equivalent was determined by qPCR or by densitometric analysis of stained agarose gels. In this latter method, the plasmidic to chromosomal DNA ratios were compared with the one obtained in the lactococcal host cells grown at pH 7.0 for 10 generations, to which the corresponding qPCR-determined PCN value (red color number) was assigned. The table also includes the growth rates of L. lactis/pMV158 in Tc-free M17′ media adjusted to the different pH values. The copy number and growth rate values given in the table are expressed as mean ± SD of three independent experiments (biological samples). All the values with the same superscript letter were not found to have statistically significant differences. The statistical analysis of the PCN was only performed for the results obtained by qPCR, for which a lower standard deviation was found.
FIGURE 6
FIGURE 6
Estimation of the relative RepB concentration and RepB to pMV158 molar ratio in lactococcal cells grown at different pHs. (A) Western blot analysis with RepB antiserum of protein extracts from L. lactis/pMV158 cells grown for 10 and 20 generations in Tc-free M17′ adjusted to pH 7.0, 5.0, and 4.5. Pure RepB protein and a protein extract from a pMV158-free L. lactis culture (−) were used as controls. The sample volume of the protein extracts was adjusted in order to keep constant the amount of total protein loaded in the gel. A black arrowhead indicates the band used as an internal loading control. (B) The normalized RepB level (9.91 ± 0.77) and RepB/PCN ratio (1.32 ± 0.18) were taken as reference and assigned the value 1 (in red color) for comparison with the different conditions. Data are presented as mean ± SD of the analysis of four different western blot assays. Values with an asterisk were found to have statistically significant differences with the corresponding reference value.

Similar articles

Cited by

References

    1. Baas P. D. (1985). DNA replication of single-stranded Escherichia coli DNA phages. BBA - Gene Struct. Expr. 825, 111–139. 10.1016/0167-4781(85)90096-X - DOI - PubMed
    1. Backert S., Meißner K., Börner T. (1997). Unique features of the mitochondrial rolling circle-plasmid mp1 from the higher plant Chenopodium album (L.). Nucleic Acids Res. 25, 582–589. 10.1093/nar/25.3.582 - DOI - PMC - PubMed
    1. Boer D. R., Ruiz-Masó J. A., López-Blanco J. R., Blanco A. G., Vives-Llàcer M., Chacón P., et al. (2009). Plasmid replication initiator RepB forms a hexamer reminiscent of ring helicases and has mobile nuclease domains. EMBO J. 28, 1666–1678. 10.1038/emboj.2009.125 - DOI - PMC - PubMed
    1. Boer D. R., Ruiz-Masó J. A., Rueda M., Petoukhov M. V., Machón C., Svergun D. I., et al. (2016). Conformational plasticity of RepB, the replication initiator protein of promiscuous streptococcal plasmid pMV158. Sci. Rep. 6, 20915. 10.1038/srep20915 - DOI - PMC - PubMed
    1. Bordanaba-Ruiseco L. (2017). Caracterización de las actividades de RepB y su implicación en el proceso replicativo del plásmido promiscuo pMV158. Doctoral Thesis. Complutense University of Madrid. Available at: https://www.educacion.gob.es/teseo/mostrarRef.do?ref=433542