. 2021 Mar 8;24(4):102284.
doi: 10.1016/j.isci.2021.102284. eCollection 2021 Apr 23.

Caenorhabditis elegans learning in a structured maze is a multisensory behavior

Affiliations

Caenorhabditis elegans learning in a structured maze is a multisensory behavior

Eleni Gourgou et al. iScience. .

Abstract

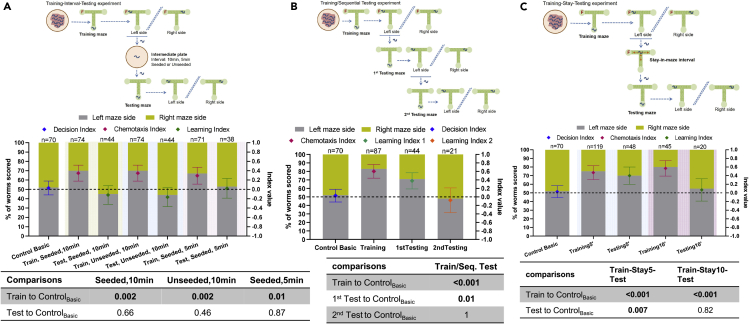
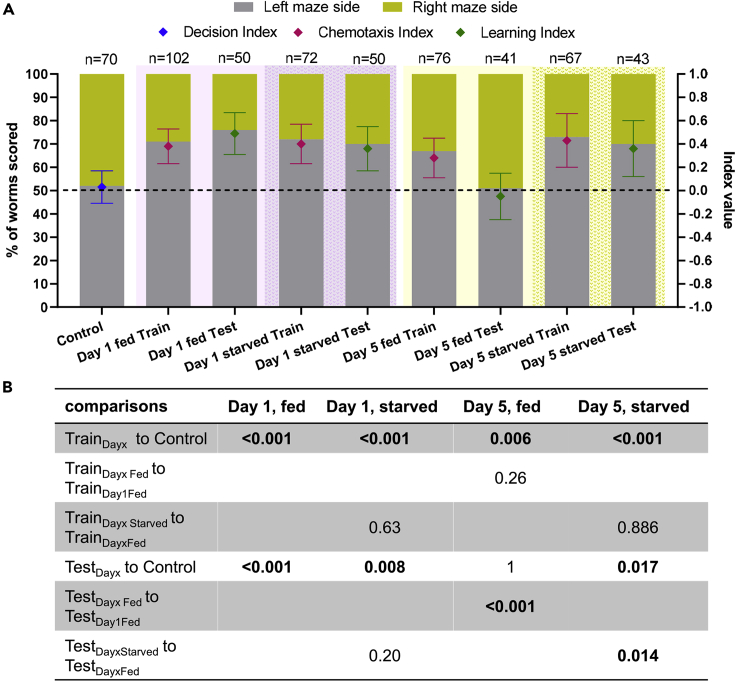
We show that C. elegans nematodes learn to associate food with a combination of proprioceptive cues and information on the structure of their surroundings (maze), perceived through mechanosensation. By using the custom-made Worm-Maze platform, we demonstrate that C. elegans young adults can locate food in T-shaped mazes and, following that experience, learn to reach a specific maze arm. C. elegans learning inside the maze is possible after a single training session, it resembles working memory, and it prevails over conflicting environmental cues. We provide evidence that the observed learning is a food-triggered multisensory behavior, which requires mechanosensory and proprioceptive input, and utilizes cues about the structural features of nematodes' environment and their body actions. The CREB-like transcription factor and dopamine signaling are also involved in maze performance. Lastly, we show that the observed aging-driven decline of C. elegans learning ability in the maze can be reversed by starvation.

Keywords: Behavioral Neuroscience; Biological Sciences; Neuroscience.


Conflict of interest statement

The authors have no competing interests.

Figures

Figure 1
Figure 1
The T-maze arena and the basic (reference) Control and Training/Testing experiments (A): The 3D-printed mold, as designed in SolidWorks software. Nine copies of individual maze molds are included, 5-7mm apart, with the supporting arms of the entire structure branching out in an X-like configuration (see also Figure S1). The square-shaped plate prevents liquid agar from forming a meniscus around each maze mold (Figure S1). Scale bar: 5mm. (B): Schematic showing the dimensions of each maze in mm; wavy green: the functional corridors of the maze, light green: circular auxiliary areas, allowing for extra room to pipette the food in (left and right maze ends) and placing the worm (maze bottom—starting point). The depth of the actual maze is ~5mm. (C): Actual T-maze in an NGM plate. The maze has continuously rough surface. Scale bar: 2.5mm. (D): Basic Control experiment, schematic of the experimental steps. (E): Basic Training/Testing experiment, schematic of the experimental steps, (F) food (E. coli OP50). (F): % of worms scored in Basic Control and Training/Testing experiments (left y axis). Diamond shapes indicate the preference indices (right y axis): for the Control maze, Decision Index DIBasic, (DI)=(nLnR)/(nL+nR), where nL= worms that reached the left arm of the maze, nR= worms that reached the right arm of the maze; for the Training maze, Chemotaxis Index: CIBasic, (CI)=(DI)Train(DI)Control; and for the Testing maze, Learning Index: LIBasic, (LI)=(DI)Test(DI)Control (see also Methods, Tables S1 and S2). Index error bars represent the standard deviation of the index (see supplemental information), dashed line illustrates the 50% and index = 0 level, p values of binomial probability test provided above bars. See also Video S1. Training_1., Video S2. Testing_1., Video S3. Training_2., Video S4. Testing_2..
Figure 2
Figure 2
Characterization of C. elegans learning in the maze environment (A): The effect of maze orientation. Experimental steps are similar to Figure 1E schematic, with testing mazes rotated by 180° (Figure S3), using mazes shown in Figure 1C. (B): The effect of conflicting environmental cues. Experimental steps are similar to Figure 1E, and an angled maze is shown in inset. (C): The effect of tactile input. Experimental steps are similar to Figure 1E, with the use of smooth mazes, shown in Figure S1D. All top panels: % of worms scored in Control and Training/Testing experiments (left y axis). Diamond shapes indicate the preference indices (right y axis): for the Control maze Decision Index, for the Training maze Chemotaxis Index, and for the Testing maze Learning Index (Methods). Index error bars represent the standard deviation of the index; dashed line illustrates the 50% and index = 0 level, above bars is indicated the number of nematodes that were scored (n), see also Table S2. All bottom panels: p values (binomial distribution probability) for comparisons between each case and basic Control or basic Training/Testing experiment. ControlBasic refers to the basic control experiment (Figures 1D and 1F) and TrainBasic, TestBasic refer to basic Training/Testing experiment (Figures 1E and 1F).
Figure 3
Figure 3
Time frame of C. elegans learning in the maze environment (A): Training-interval-Testing experiment. (B): Training-sequential Testing experiment. (C): Training-stay-Testing experiment. (A),(B),(C), top panels: schematic of experimental steps; middle panels: % of worms scored in Basic Control and Training/Testing experiments (left y axis). Diamond shapes indicate the preference indices (right y axis): for the Control maze Decision Index, for the Training maze Chemotaxis Index, and for the Testing maze Learning Index (Methods). Indices error bars represent the standard deviation of the index; above bars is indicated the number of nematodes that were scored (n), see also Table S2; dashed line illustrates the 50% and index = 0 level, bottom panels: p values (binomial distribution probability) for comparisons between each case and basic Control experiment. ControlBasic refers to the basic Control experiment (Figures 1D and 1F) and TrainBasic, TestBasic refer to basic Training/Testing experiment (Figures 1E and 1F). Shaded background indicates data from separate experiments.
Figure 4
Figure 4
Role of sensory modalities and selected biochemical pathways (A–E) (A): chemosensation impaired strains, (B): mechanosensation impaired strains, (C): proprioception impaired strains, (D): strains lacking the CREB-like transcription factor (crh-1) or the dopamine-3 receptor (dop-3); (A), (B), (C), (D): % of scored worms in Training/Testing experiments (left y axis). Diamond shapes: preference indices (right y axis), for the Training maze Chemotaxis Index, and for the Testing maze Learning Index. Indices error bars: standard deviation of the index; above bars: number of scored nematodes (n), dashed line: 50% and index = 0 level; (E): p values (binomial distribution probability) for comparisons between each mutant strain and basic control or basic training/testing experiment. Experimental steps as in Figure 1. See also Tables S2 and S3, and Figure S6. TrainN2, TestN2 refer to basic Training/Testing esxperiment (Figures 1E and 1F).
Figure 5
Figure 5
C elegans' interaction with structural features of the maze Graphs show % of nematodes scored in the Testing maze, with respect to their wall or floor route choice. (A): N2 wild type experiments (Figure 1). For the first two bars the % is calculated over the total number of nematodes that were scored in the Testing maze. For the last two bars the % is calculated over the number of nematodes that reached the same maze side. (B): Smooth mazes (Figure 2A) and mec-4 and mec-10 strains (Figure 4B) experiments. For the first two sets of bars the % is calculated over the total number of nematodes that were scored in the Testing maze. For the last two sets of bars the % is calculated over the number of nematodes that reached the same maze side. (C): trp-4 and trp-;trp-2 strains (Figure 4C). For the first two sets of bars the % is calculated over the total number of nematodes that were scored in the Testing maze. For the last two sets of bars the % is calculated over the number of nematodes that reached the same maze side. All panels: Same side: nematodes that reached the same side in Training and Testing; Same F/W: nematodes that traversed both mazes crawling mainly on the floor, or on the wall; Same side-Dfrnt F/W: Nematodes that reached the same side in Training and Testing, but did not traverse both mazes crawling mainly on the floor, or on the wall; Same side/Same F/W: Nematodes that reached the same side in Training and Testing, and traversed both mazes crawling mainly on the floor or on the wall. Nematodes that reached the same side are the worms that are considered to have learned. Dashed line indicates 50% level. Error bars: standard deviation, above bars: number of scored nematodes (n), asterisks indicate p values (binomial distribution probability), ∗: p < 0.05, ∗∗: p < 0.01, ∗∗∗: p < 0.001, ∗∗∗∗: p < 0.0001. All comparisons are made against the respective N2 result. Nematodes that crawled on the maze ceiling (cover agar pads), varying between 0 and 5%, are not included.
Figure 6
Figure 6
C. elegans' body orientation during Training and Testing Training/Testing experiment, using Pmyo-3:mcherry:unc-54 strain. Experimental steps as in Figure 1. (Α): Images of Pmyo-3:mcherry:unc-54 strain nematodes. Vulva muscles are visible and dorsal/ventral body sides are distinguishable. Nematodes taking a ventral, or a dorsal side bend are depicted. (Β): Training/Testing experiment on Pmyo-3:mcherry:unc-54 strain. Graph shows % of scored nematodes in Training and Testing mazes (left y axis). Diamond shapes indicate the preference indices (right y axis): Chemotaxis Index for Training maze, Learning Index for Testing maze. Indices error bars: standard deviation of the index; dashed line: 50% and index = 0 level, above bars: number of scored nematodes (n), see also Table S2; table shows p values (binomial distribution probability) for comparisons to basic Control or basic Training/Testing experiment (Figure 1). (C): % of nematodes that reached the same maze side (Same side) or repeated the floor- or wall-dominant choice in both Training and Testing (Same F/W), over the total number of scored worms. (D): % of nematodes that maintained the same ventral/dorsal orientation (Same V/D) or maintained the same ventral/dorsal orientation and reached the same maze side in training and testing (Same side V/D), over the number of worms that crawled on the floor. Panels C and D: Dashed line indicates 50% level. Error bars: standard deviation, above bars: number of scored nematodes (n). Note that nematodes marked as Same V/D and Same Side V/D are only floor crawlers, since it not possible to call a V/D orientation in worms crawling on the walls. See also Videos S5 and S6.
Figure 7
Figure 7
The effect of aging and starvation on C elegans performance in the maze environment (A): % of scored nematodes in Training/Testing experiments, of two different age groups, being either fully fed or starved for 24 hr (left y axis). Diamond shapes indicate the preference indices (right y axis): for the Control experiment Decision Index, for the Training maze Chemotaxis Index, and for the Testing maze Learning Index (Methods). Indices error bars represent the standard deviation of the index; dashed line illustrates the 50% and index = 0 level, above bars is indicated the number of scored nematodes (n), see also Table S2. (B): p values (binomial distribution probability) for comparisons between each age cohort and Control, or Training/Testing experiment of the fully fed respective age cohort. Experimental steps are the same as basic Training/Testing experiment (Figure 1). Shaded background indicates data from separate age cohorts and feeding conditions.

References

    1. Amano H., Maruyama I.N. Aversive olfactory learning and associative long-term memory in Caenorhabditis elegans. Learn. Mem. 2011;18:654–665. - PMC - PubMed
    1. Ardiel E.L., Rankin C.H. An elegant mind: learning and memory in Caenorhabditis elegans. Learn Mem. 2010;17:191–201. - PubMed
    1. Arey R.N., Stein G.M., Kaletsky R., Kauffman A., Murphy C.T. Activation of gαq signaling enhances memory consolidation and slows cognitive decline. Neuron. 2018;98:562–574.e5. - PMC - PubMed
    1. Arnatkeviciute A., Fulcher B.D., Pocock R., Fornito A. Hub connectivity, neuronal diversity, and gene expression in the Caenorhabditis elegans connectome. PLoS Comput. Biol. 2018;14 doi: 10.1371/journal.pcbi.1005989. - DOI - PMC - PubMed
    1. Bardgett M.E., Depenbrock M., Downs N., Points M., Green L. Dopamine modulates effort-based decision-making in rats. Behav. Neurosci. 2009;123:242–251. - PMC - PubMed

LinkOut - more resources