Loss of enteric neuronal Ndrg4 promotes colorectal cancer via increased release of Nid1 and Fbln2
- PMID: 33890711
- PMCID: PMC8183412
- DOI: 10.15252/embr.202051913
Loss of enteric neuronal Ndrg4 promotes colorectal cancer via increased release of Nid1 and Fbln2
Abstract
The N-Myc Downstream-Regulated Gene 4 (NDRG4), a prominent biomarker for colorectal cancer (CRC), is specifically expressed by enteric neurons. Considering that nerves are important members of the tumor microenvironment, we here establish different Ndrg4 knockout (Ndrg4-/- ) CRC models and an indirect co-culture of primary enteric nervous system (ENS) cells and intestinal organoids to identify whether the ENS, via NDRG4, affects intestinal tumorigenesis. Linking immunostainings and gastrointestinal motility (GI) assays, we show that the absence of Ndrg4 does not trigger any functional or morphological GI abnormalities. However, combining in vivo, in vitro, and quantitative proteomics data, we uncover that Ndrg4 knockdown is associated with enlarged intestinal adenoma development and that organoid growth is boosted by the Ndrg4-/- ENS cell secretome, which is enriched for Nidogen-1 (Nid1) and Fibulin-2 (Fbln2). Moreover, NID1 and FBLN2 are expressed in enteric neurons, enhance migration capacities of CRC cells, and are enriched in human CRC secretomes. Hence, we provide evidence that the ENS, via loss of Ndrg4, is involved in colorectal pathogenesis and that ENS-derived Nidogen-1 and Fibulin-2 enhance colorectal carcinogenesis.
Keywords: Fibulin-2; Ndrg4; Nidogen-1; colorectal cancer; enteric nervous system.
© 2021 The Authors. Published under the terms of the CC BY NC ND 4.0 license.
Conflict of interest statement
The authors declare that they have no conflict of interest.
Figures
- A
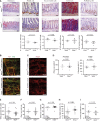
Representative microscopic views of Ndrg4 +/+ and Ndrg4 −/− murine intestinal sections (n = 4, 12 months of age) reveal an even distribution of alkaline phosphatase along the enterocyte brush border, and a similar number and distribution of Paneth cells (Lysozyme) in the small intestine; and neuroendocrine (chromogranin A), goblet (PAS+), and proliferating (Ki67) cells in the colon. Scale bars, 50 µm.
- B, C
Representative microscopic views of the myenteric plexus of Ndrg4 +/+ and Ndrg4 −/− murine colonic sections labeled with either TuJ1 and S100 (B, n = 3) or HuC/D (C, n = 6) did not reveal structural or organizational differences in the ganglionic network of Ndrg4 +/+ and Ndrg4 −/− mice. Scale bars, 100 µm.
- D
Quantification of the enteric neuronal cell number (HuC/D) shows a similar number of enteric neurons in the proximal and distal colon of Ndrg4 +/+ and Ndrg4 −/− mice (n = 6).
- E–I
Gastrointestinal motility assays reveal a similar whole‐gut transit time (E; n = 12 versus 12), with a similar weight per stool and stool water content of the fecal pellets (F, G; n = 11 versus 10), a comparable small intestinal transit (H; n = 10 versus 12) and colonic propulsion time (I; n = 7 versus 6) in Ndrg4 −/− compared to Ndrg4 +/+ mice.

- A–C
Quantification of intestinal cells within the ileum reveals a similar distribution and number of neuroendocrine (Chrom A, A), goblet (PAS+, B), and proliferating (Ki67, C) cells in Ndrg4 +/+ (n = 3) and Ndrg4 −/− mice (n = 3/4).
- D, E
Quantification of the Lgr5‐positive cell population within the intervillus (IV) region in the small intestine (D) and per crypt in the colon (E) shows a similar number of intestinal stem cells in Ndrg4 +/+ (n = 3) and Ndrg4 −/− mice (n = 3/4).
- A
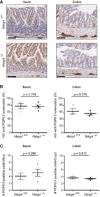
Representative images of intestinal Swiss roll sections of Ndrg4 +/+ (n = 3) and Ndrg4 −/− (n = 3/4) mice stained with anti‐PGP9.5. Scale bars, 100 µm.
- B, C
Quantification of the percentage of villi with anti‐PGP9.5 reactivity (B) and of the number of PGP9.5‐positive cells/fibers per villus or crypt (C) shows a similar mucosal innervation in Ndrg4 +/+ (n = 3) and Ndrg4 −/− (n = 3/4) mice.
- A, B
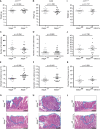
Ndrg4 +/+ and Ndrg4 −/− mice have a similar bodyweight (n = 17 versus 14 in (A) and n = 25 versus 19 in (B).
- C, D
The total number of small intestinal (SI) and colonic adenomas that develops remains the same after deletion of Ndrg4 (n = 18 versus 15 in (C) and n = 25 versus 19 in (D)).
- E–H
Ndrg4 −/− mice develop significantly enlarged small intestinal (SI) polyps (E, G) and colon adenomas (F, H). N = 10 versus 13 in (E) and n = 20 versus 17 in (F).
- I–L
In contrast, Ndrg4fl / fl and Ndrg4fl / fl‐VillinCre mice have a similar bodyweight (I) and develop an equal number of adenomas (J) with an equivalent diameter (K, L). N = 13 versus 12 in (I), n = 13 versus 11 in (J) and n = 10 versus 8 in (K).
- A–C
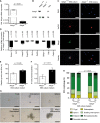
Relative Ndrg4 mRNA (A) and Ndrg4 protein expression by Western blotting (B) and immunofluorescence (C) confirms the absence of Ndrg4 in enteric neurons of Ndrg4 −/− mice (n = 3). EIF4E is used as a loading control in (B).
- D
qRT–PCR analysis of the Ndrg4 +/+ and Ndrg4 −/− ENS cells used in the co‐culture model showed that Ndrg4 −/− ENS cultures have reduced levels of vesicle trafficking‐related genes, with the expression of Rabac1 (78.3%), Nsf (12.8%), Vamp2 (49.2%), Snap25 (13.3%), Stx1a (8.0%), Rab3a (48.1%), Stx1bp (18.3%), Caly (82.1%), and Cadps (60.4%) being down‐regulated in Ndrg4 −/− ENS cultures compared to Ndrg4 +/+ ENS cultures. Data are derived from three independent experiments and log10‐transformed ± SEM, with P‐values determined using a Mann–Whitney U‐test.
- E, F
Compared to Ndrg4 +/+ ENS‐derived medium, addition of medium derived from Ndrg4 −/− ENS cultures enhances the relative growth of intestinal epithelial organoids (E, IEOs) and accelerates the formation of new crypt buds per IEO in the course of 5 days (F).
- G
Medium from both Ndrg4 +/+ and Ndrg4 −/− ENS cultures ensures IEO progression from crypt to (entero‐) sphere, budding enterosphere, enteroid, and a microadenoma‐like structure.
- H
After 5 days of culture, significantly more non‐viable structures are formed upon influence of Ndrg4 −/− ENS‐derived medium.
- A
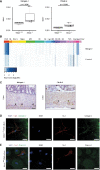
Box plot showing the quantitative protein expression results of nanoLC‐MS/MS analysis reveals the significantly higher presence of Nid1 and Fbln2 in the Ndrg4 −/− compared to the Ndrg4 +/+ ENS cell secretome (n = 4; NSAF, normalized spectral abundance factor). Data are analyzed with R version 3.5.2 and the ibb R package. Each dot within the box plot represents the NSAF of an individual sample; the inside band reflects the median, and the bottom and top of the box the first and third quartile, respectively. The whiskers reflect the minimum and maximal values within 1.5× the interquartile range. NSAF values were compared using the Mann–Whitney U‐test.
- B
Data derived from the Linnarsson mouse database (http://mousebrain.org/) display the expression of Nid1 and Fbln2 within cells of the central, peripheral, and enteric nervous system. Unit color scale: Expression (log(UMI)); UMI, unique molecular identifier. Abbreviations: ENS, enteric nervous system (i.e., enteric neurons and glial cells); OL, oligodendrocytes; Exc N, excitatory neurons in CNS; Hippo, hippocampus; MB, midbrain; HB, hindbrain; Str, striatum; Hyp, hypothalamus; BG, basal ganglia; OB, olfactory bulb; CB, cerebellum; SC, spinal cord; PNS, peripheral nervous system; Glia, glial cells; and Vasc, vasculature.
- C–E
Representative immunohistochemistry (C) and more detailed immunofluorescence (D, E) labeling indicate that Nid1 (C, D) and Fbln2 (C, E) are expressed within the myenteric plexus and by primary ENS cells ((C), n = 3, black arrowheads, scale bars, 50 µm; (D, E), n = 3, scale bars, 10 µm).
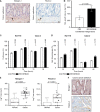
Representative microscopic views show that NID1 and FBLN2 are highly expressed in the human colonic ganglia (black arrowheads) and interconnecting nerve fibers, and in a limited level throughout the epithelium (n = 3). Scale bar, 50 µm.
Addition of NID1&FBLN2 to the Matrigel® dome significantly enhanced the relative growth rate of HIOs after 5 days of culture as compared to the PBS control condition.
Compared to the PBS control condition (white), stimulation with NID1&FBLN2 (black) enhanced the proliferation rate of HCT116 cells after 72 h, but did not affect Caco‐2 cell proliferation.
The migration rate of HCT116 cells was already significantly increased 24 h after addition of NID1&FBLN2 (black), whereas the migration of Caco‐2 cells only significantly increased after 48 h of culture with NID1&FBLN2 (black).
Box plot reflecting the quantitative nanoLC‐MS/MS analysis results shows the up‐regulation of NID1 and FBLN2 in the colorectal cancer tissue secretome (n = 17) compared to the normal colon tissue secretome (n = 17). Data are analyzed with R version 3.5.2 and the ibb R package. Within the box plots, each dot represents the log10‐transformed raw count of an individual sample; the inside band is the median value; the bottom and top of the box the first and third quartile, respectively; and the whiskers reflect the minimum and maximal values within 1.5× the interquartile range.
Representative images of human colonic cancer epithelium (n = 3) show a high scattered expression of NID1 and FBLN2 within the cancerous epithelium. Scale bar, 50 μm.
Similar articles
-
NDRG4, an early detection marker for colorectal cancer, is specifically expressed in enteric neurons.Neurogastroenterol Motil. 2017 Sep;29(9). doi: 10.1111/nmo.13095. Epub 2017 May 19. Neurogastroenterol Motil. 2017. PMID: 28524415
-
The role of enteric neurons in the development and progression of colorectal cancer.Biochim Biophys Acta Rev Cancer. 2017 Dec;1868(2):420-434. doi: 10.1016/j.bbcan.2017.08.003. Epub 2017 Aug 25. Biochim Biophys Acta Rev Cancer. 2017. PMID: 28847715 Review.
-
N-Myc downstream-regulated gene 4 (NDRG4): a candidate tumor suppressor gene and potential biomarker for colorectal cancer.J Natl Cancer Inst. 2009 Jul 1;101(13):916-27. doi: 10.1093/jnci/djp131. Epub 2009 Jun 17. J Natl Cancer Inst. 2009. PMID: 19535783
-
The Imperative for Innovative Enteric Nervous System-Intestinal Organoid Co-Culture Models: Transforming GI Disease Modeling and Treatment.Cells. 2024 May 10;13(10):820. doi: 10.3390/cells13100820. Cells. 2024. PMID: 38786042 Free PMC article. Review.
-
Alternative Splicing of FBLN2 Generates a Prometastatic Extracellular Matrix in Gastrointestinal Cancers by Determining N-Glycosylation of Fibulin 2.Genes Cells. 2025 May;30(3):e70027. doi: 10.1111/gtc.70027. Genes Cells. 2025. PMID: 40400104 Free PMC article.
Cited by
-
Identification of NID1 as a novel candidate susceptibility gene for familial non-medullary thyroid carcinoma using whole-exome sequencing.Endocr Connect. 2022 Jan 31;11(1):e210406. doi: 10.1530/EC-21-0406. Endocr Connect. 2022. PMID: 34941562 Free PMC article.
-
Neuroscience in peripheral cancers: tumors hijacking nerves and neuroimmune crosstalk.MedComm (2020). 2024 Oct 31;5(11):e784. doi: 10.1002/mco2.784. eCollection 2024 Nov. MedComm (2020). 2024. PMID: 39492832 Free PMC article. Review.
-
Identification of HSPG2 as a bladder pro-tumor protein through NID1/AKT signaling.Cancer Cell Int. 2024 Oct 23;24(1):345. doi: 10.1186/s12935-024-03527-7. Cancer Cell Int. 2024. PMID: 39438949 Free PMC article.
-
Prognostic value and biological function of LRRN4 in colorectal cancer.Cancer Cell Int. 2022 Apr 19;22(1):158. doi: 10.1186/s12935-022-02579-x. Cancer Cell Int. 2022. PMID: 35440048 Free PMC article.
-
A Novel Quantification System Combining iTRAQ Technology and Multi-Omics Assessment to Predict Prognosis and Immunotherapy Efficacy in Colon Cancer.Front Bioeng Biotechnol. 2022 Apr 4;10:862619. doi: 10.3389/fbioe.2022.862619. eCollection 2022. Front Bioeng Biotechnol. 2022. PMID: 35445008 Free PMC article.
References
-
- Albo D, Akay CL, Marshall CL, Wilks JA, Verstovsek G, Liu H, Agarwal N, Berger DH, Ayala GE (2011) Neurogenesis in colorectal cancer is a marker of aggressive tumor behavior and poor outcomes. Cancer 117: 4834–4845 - PubMed
-
- Ayala GE, Dai H, Powell M, Li R, Ding Y, Wheeler TM, Shine D, Kadmon D, Thompson T, Miles BJ et al (2008) Cancer‐related axonogenesis and neurogenesis in prostate cancer. Clin Cancer Res 14: 7593–7603 - PubMed
Publication types
MeSH terms
Substances
Grants and funding
LinkOut - more resources
Full Text Sources
Medical
Molecular Biology Databases
Miscellaneous

