. 2021 Jun 25;129(1):9-29.
doi: 10.1161/CIRCRESAHA.120.318805. Epub 2021 Apr 23.

Immunometabolic Endothelial Phenotypes: Integrating Inflammation and Glucose Metabolism

Affiliations

Immunometabolic Endothelial Phenotypes: Integrating Inflammation and Glucose Metabolism

Wusheng Xiao et al. Circ Res. .

Abstract

[Figure: see text].

Keywords: endothelial cells; glucose; glycolysis; inflammation; mitochondria.


Figures

Figure 1.
Figure 1.
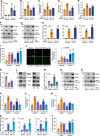
Inflammatory stimuli globally reprogram endothelial cell metabolism. Confluent pulmonary artery endothelial cells (PAECs) were stimulated with TNFα (tumor necrosis factor alpha; 1 ng/mL) or lipopolysaccharide (LPS; 50 ng/mL) for 24 h. A and B, Volcano plots from metabolomic profiling using LC-MS show the fold changes of 137 metabolites in TNFα (A) or LPS (B) stimulated cells; n=3. C, Heat map and the fold changes of intermediate metabolites of glycolysis, the tricarboxylic acid (TCA) cycle, and the pentose phosphate pathway (PPP) relative to control cells; n=3. Significantly increased or decreased metabolites were indicated by blue or red, respectively (P<0.05 using the Kruskal-Wallis test followed by Dunn test). D, The flux rates of glucose uptake and lactate secretion; n=3. E and F, Representative images of 2-NBDG uptake (E) and corresponding quantitation (F) showing TNFα or LPS enhances glucose uptake in PAECs. Scale, 20 μm; n=4. G and H, [14C]-CO2 release from [U-14C]-glucose (Glc) labeled cells; n=4. I, Schematic diagram showing the primary labeling patterns of [U-13C]-Glc in glycolysis and the TCA cycle. J–M, The labeled fraction(s) of pyruvate (PYR; M+3; J), lactate (LAC; M+3; K), citrate (CIT; M+2, M+4, and M+5; L), and aconitate (ACO) (M+2, M+4, and M+5; M) using [U-13C]-Glc as a tracer; n=3. N, Representative oxygen consumption rate (OCR) plot from a Seahorse mitochondrial stress assay. O, Energetics map showing basal OCR and extracellular acidification rate (ECAR) in TNFα-stimulated PAECs; n=6. P and Q, Quantitation of basal and ATP-dependent OCR (P), as well as glycolytic ECAR (Q) from the Seahorse assay; n=6. Data presented as mean±SD. *P<0.05, **P<0.01, and ***P<0.001 vs control by the Kruskal-Wallis test followed by Dunn test (D, F, H, J–M, P, and Q).
Figure 2.
Figure 2.
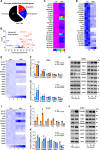
Inflammatory stimuli modulate metabolic gene expression. A and B, Pie graph (A) and volcano plot (B) from RNA sequencing (RNA-seq) showing the expression profile of glucose metabolism–related genes in TNFα (tumor necrosis factor alpha)-stimulated pulmonary artery endothelial cells (PAECs), with upregulated genes (>1.2-fold) and downregulated genes (<0.8-fold), and adjusted P<0.01 by the Benjamini-Hochberg test; n=3. C and D, The upregulated genes (>1.5-fold) and downregulated genes (<0.5-fold) from RNA-seq analysis. Color scales represent fold changes relative to control cells; n=3. E, F, I, and J, Heat maps (E and I) and quantitative results (F and J) show mRNA expression of metabolic genes in PAECs (E and F; n=3) and aortic endothelial cell (AoECs; I and J, n=4) stimulated by TNFα for 24 h. Color scales in heat maps represent fold changes relative to control cells. G and K, mRNA expression of metabolic genes in PAECs (G) or AoECs (K) stimulated by lipopolysaccharide (LPS) for 24 h; n=3. H and L, The protein levels of select metabolic genes in TNFα- or LPS-challenged PAECs (H) or AoECs (L); n=3. Data presented as mean±SD. *P<0.05, **P<0.01, ***P<0.001, ****P<0.0001 vs control by the Kruskal-Wallis test followed by Dunn test (F, G, and K) or the Mann-Whitney U test (J).
Figure 3.
Figure 3.
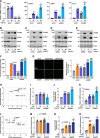
Restoration of the FOXO1 (forkhead box O1)-PDK4 (pyruvate dehydrogenase kinase 4) pathway suppresses mitochondrial respiration but worsens inflammation. A, PDK4 mRNA levels in adenoviral PDK4 vector (AdPDK4; 20 MOI) or empty vector (AdEmpty) transfected pulmonary artery endothelial cells (PAECs) with or without TNFα (tumor necrosis factor alpha) stimulation for 24 h; n=4. B–E, Basal oxygen consumption rate (OCR; B), ATP-dependent OCR (C), maximal OCR (D), and extracellular acidification rate (ECAR; E) from a Seahorse mitochondrial stress test; n=4. F and G, Protein levels of ICAM1 (intercellular adhesion molecule 1), VCAM1 (vascular cell adhesion molecule 1), and P-PDH in PAECs with 24 h of TNFα (F) or lipopolysaccharide (LPS; G) stimulation; n=3. H, mRNA expression of inflammatory adhesion molecules in TNFα-stimulated cells; n=4. I, CCL2 (C-C motif chemokine ligand 2) levels in PAECs transfected with AdEmpty or AdPDK4; n=4. J, Representative images (left; scale, 200 μm) and quantitation (right) showing monocyte adhesion to the lawn of PAECs; n=3. K and L, FOXO1 mRNA (K; n=4) and protein (L; n=3) expression in PAECs challenged with TNFα or LPS for 24 h. M, PDK4 mRNA expression in PAECs transfected with adenoviral vector of mouse Foxo1 (AdFoxo1; 80 MOI) or GFP control (AdGFP) followed by 24-h stimulation of LPS; n=4. N and O, Protein levels of ICAM1, VCAM1, and P-PDH in Foxo1 overexpressed cells with the stimulation of LPS (N) or TNFα (O) for 24 h; n=3. P–R, The Seahorse mitochondrial stress test shows basal OCR (P), ATP-dependent OCR (Q), and maximal OCR (R) in PAECs transfected with AdFoxo1 or AdGFP followed by 24-h stimulation of TNFα or LPS; n=3. S, mRNA expression of inflammatory marker genes in Foxo1 overexpressed and LPS-stimulated cells; n=4. T, CCL2 levels in PAECs transfected with AdGFP or AdFoxo1 followed by inflammatory stimuli for 24 h; n=3. Data presented as mean±SD. *P<0.05, **P<0.01, ***P<0.001, ****P<0.0001 vs control by the Kruskal-Wallis test followed by Dunn test (A–E, H–K, M, and P–T); #P<0.05 and ##P<0.01 vs AdEmpty- or AdGFP-transfected and TNFα-stimulated cells by Dunn test (A, B, D, H, and P–R); $P<0.05 vs AdEmpty- or AdGFP-transfected and LPS-stimulated cells by Dunn test (I, J, M, P, Q, S, and T).
Figure 4.
Figure 4.
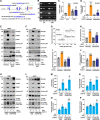
Inhibition of G6PD (glucose 6-phosphate dehydrogenase) promotes a metabolic shift to glycolysis and inflammation. A, mRNA expression of G6PD and adhesion molecules in human G6PD siRNA (siG6PD) or control siRNA (siCtrl) transfected pulmonary artery endothelial cells (PAECs) with or without lipopolysaccharide (LPS) stimulation for 8 h; n=5. B–E, Protein levels of G6PD, ICAM1 (intercellular adhesion molecule 1), and VCAM1 (vascular cell adhesion molecule 1) in PAECs with G6PD silencing by siRNA (B and C) or inactivation by the enzymatic inhibitor DHEA (50 μM; D and E) under LPS (B and D) or TNFα (tumor necrosis factor alpha; C and E) stimulation for 8 h; n=3. F, CCL2 (C-C motif chemokine ligand 2) levels in PAECs with G6PD silencing and 8 h of inflammatory stimuli challenge; n=3 to 4. G, Representative images (left; scale, 200 μm) and corresponding quantitation (right) show the adhesion of monocytes to the lawn of PAECs; n=3. H and L, Energetics maps showing basal oxygen consumption rate (OCR) and extracellular acidification rate (ECAR) in LPS- (H) or TNFα- (L) treated and G6PD silenced PAECs for 8 h; n=3. I, J, M, and N, Seahorse mitochondrial stress assays showing basal OCR (I and M) and glycolytic ECAR (J and N) after 8 h of LPS (I and J) or TNFα (M and N) stimulation; n=3. K and O, PFKFB3 mRNA expression in LPS- (K; n=5) or TNFα- (O; n=3) stimulated PAECs for 8 h. Data presented as mean±SD. *P<0.05, **P<0.01, ***P<0.001, ****P<0.0001 vs control by the Kruskal-Wallis test followed by Dunn test (A, F, G, I–K, N, and O); #P<0.05, ##P<0.01, ###P<0.001 vs siCtrl-transfected and TNFα-treated cells by Dunn test (F, G, N, and O); $P<0.05, $$P<0.01, $$$P<0.001 vs siCtrl-transfected and LPS-stimulated cells by Dunn test (A, F, G, I, and J).
Figure 5.
Figure 5.
PFKFB3 (6-phosphofructo-2-kinase/fructose 2,6-bisphosphatase 3) is an essential immunometabolic regulator. A and F, PFKFB3 mRNA expression in pulmonary artery endothelial cells (PAECs) with PFKFB3 silencing by siRNA (siPFKFB3; A) or overexpression by adenoviral vector (AdPFKFB3; 60 MOI; F) followed by TNFα (tumor necrosis factor alpha) stimulation for 24 h; n=3. B and G, Energetics maps from a Seahorse glycolysis stress assay show basal oxygen consumption rate (OCR) and extracellular acidification rate (ECAR) in PFKFB3 silenced (B; n=3) or overexpressed (G; n=4) PAECs with TNFα stimulation. C and D, Quantitation of glycolytic ECAR (C) and basal OCR (D) from the Seahorse assay; n=3. E, Extracellular lactate levels determined by a colorimetric assay in PAECs with TNFα stimulation for 24 h; n=4. H–J, Quantitation of glycolytic ECAR (H), glycolytic capacity (I), and basal OCR (J) from the Seahorse assay; n=4. K–N, Immunoblots showing the levels of inflammatory and metabolic proteins in PAECs with PFKFB3 knockdown by siRNA (K and L) or inactivation by enzymatic inhibitors 3-PO (20 μM; M) or PFK15 (6 μM; N) in the presence or absence of TNFα (K and M) or lipopolysaccharide (LPS; L and N); n=3. O, Immunoblots showing the levels of inflammatory and metabolic proteins in PAECs with PFKFB3 overexpression and TNFα stimulation for 6 h; n=3. P and Q, CCL2 (C-C motif chemokine ligand 2) levels in LPS-stimulated PAECs (P) and TNFα-stimulated aortic endothelial cells (Q); n=3. R, Monocyte adhesion to the lawn of PAECs (left; scale, 200 μm) and quantitative bar graph (right) in cells with PFKFB3 silencing and inflammatory stimuli for 24 h; n=3. S, CCL2 levels in PFKFB3 overexpressed and TNFα-treated PAECs; n=5. Data presented as mean±SD. *P<0.05, **P<0.01, ***P<0.001, ****P<0.0001 vs control by the Kruskal-Wallis test followed by Dunn test (A, C–F, H–J, and P–S); #P<0.05, ##P<0.01, ####P<0.0001 vs siCtrl- or AdGFP–-transfected and TNFα-challenged cells by Dunn test (A, C, E, F, H, J, and Q–S); $P<0.05 and $$P<0.01 vs siCtrl-transfected and LPS-challenged cells by Dunn test (P and R).
Figure 6.
Figure 6.
The NF-κB (nuclear factor-kappa B)–PFKFB3 (6-phosphofructo-2-kinase/fructose 2,6-bisphosphatase 3) axis promotes glycolysis and inflammation. A, Bioinformatic identification of 4 potential binding sites (S1–S4) of NF-κB (p65) at the promoter region of human PFKFB3 gene. B, ChIP (chromatin immunoprecipitation) assay shows the binding of p65 protein to the PFKFB3 promoter with or without TNFα (tumor necrosis factor alpha) stimulation (1 ng/mL for 4 h); n=3. C and D, PFKFB3 mRNA expression in pulmonary artery endothelial cells (PAECs) with NF-κB pathway inactivation by PDTC (50 μM; C; n=5) or overexpression of a dominant-negative IκBα (IkappaBalpha) protein (AdIκBα[DN]; 20 MOI; D; n=4) followed by TNFα stimulation for 4 h. E and F, Immunoblotting images showing the levels of inflammatory and metabolic proteins in PAECs (E) or aortic endothelial cells (AoECs; F) transfected with AdEmpty or AdIκBα(DN) followed by TNFα stimulation; n=3. G, Energetics map from the Seahorse mitochondrial stress test showing basal oxygen consumption rate (OCR) and extracellular acidification rate (ECAR) in PAECs with 24 h of TNFα treatment; n=3. H–J, Quantitation of ECAR (H), basal OCR (I), and ATP-dependent OCR (J) from the Seahorse assay; n=3. K and L, Immunoblots showing the levels of inflammatory and metabolic proteins in PAECs (K) or AoECs (L) transfected with AdIκBα(DN) or cotransfected with AdIκBα(DN) and AdPFKFB3 followed by TNFα stimulation for 24 h; n=3. M, CCL2 (C-C motif chemokine ligand 2) levels in PAECs with the same treatment as in panel K; n=4. N and O, Seahorse glycolysis stress test shows glycolytic ECAR (N) and capacity (O) in PAECs; n=3. P, Extracellular lactate levels in PAECs determined by a fluorescence-based assay; n=5. Data presented as mean±SD. *P<0.05, **P<0.01, ***P<0.001 vs control by the Kruskal-Wallis test followed by Dunn test (C, D, H–J, and M–P); ##P<0.01 and ###P<0.001 vs H2O-treated or AdEmpty-transfected cells with TNFα stimulation by Dunn test (C, D and H–J); &P<0.05 and &&P<0.01 vs AdIκBα-transfected cells with TNFα stimulation by Dunn test (M, O, and P).
Figure 7.
Figure 7.
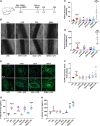
Modulating glucose metabolism regulates mesenteric vessel inflammation in lipopolysaccharide (LPS)-stimulated mice. A, Schematic illustration of the treatment protocol for intravital microscopy (IVM). B, Representative IVM images showing the adhesion of leukocytes to the mesenteric endothelium. Scale, 100 μm. C and D, Quantitative IVM results of rolling leukocytes (C) and adherent leukocytes (D); n=9 in Ctrl and DHEA groups, n=10 in 3-PO and DCA groups, n=11 in LPS and DHEA+LPS groups, n=12 in 3-PO+LPS and DCA+LPS groups. E and F, Immunofluorescent images (E) and corresponding quantitation (F) of VCAM1 (vascular cell adhesion molecule 1) expression on mesenteric vessels; n=5 in DCA and DHEA groups, n=6 in DCA+LPS and DHEA+LPS groups, n=7 in other groups. Scale, 50 μm. G and H, ELISA measurements of plasma E-selectin (G) and P-selectin (H) levels; n=6. Data presented as mean±SD. *P<0.05, **P<0.01, ***P<0.001, ****P<0.0001 vs vehicle control (Ctrl) treated mice by 1-way ANOVA followed by Tukey test (C and D) or the Kruskal-Wallis test followed by Dunn test (F–H); $P<0.05, $$P<0.01, $$$P<0.001, and $$$$P<0.0001 vs LPS-stimulated mice by Tukey test (C and D) or Dunn test (F–H).
Figure 8.
Figure 8.
Proposed immunometabolic regulation of resting and inflamed endothelial cell (EC) phenotypes. In resting ECs, the 3 central glucose metabolism pathways of glycolysis, the pentose phosphate pathway (PPP), and mitochondrial oxidative phosphorylation (OXPHOS) are active. PFKFB3 (6-phosphofructo-2-kinase/fructose 2,6-bisphosphatase 3) maintains glycolysis by generating F2,6BP as a potent agonist of the rate-limiting enzyme PFK1 (phosphofructokinase 1). G6PD (glucose 6-phosphate dehydrogenase) is the first and rate-limiting enzyme of the PPP. PDKs govern the flux of glucose-derived pyruvate into the tricarboxylic acid cycle and OXPHOS via phosphorylation and inactivation of PDH complex. Upon inflammatory stimulation, all 3 glucose metabolism pathways are extensively enhanced in ECs. In turn, enhanced PPP and mitochondrial OXPHOS via upregulation of G6PD or inhibition of the FOXO1 (forkhead box O1)-PDK4 (pyruvate dehydrogenase kinase 4) axis, respectively, suppress inflammation, while heightened glycolysis via activation of the NF-κB (nuclear factor-kappa B)–PFKFB3 pathway promotes inflammation.

Comment in

References

    1. Cines DB, Pollak ES, Buck CA, Loscalzo J, Zimmerman GA, McEver RP, Pober JS, Wick TM, Konkle BA, Schwartz BS, et al. . Endothelial cells in physiology and in the pathophysiology of vascular disorders. Blood. 1998;91:3527–3561. - PubMed
    1. Favero G, Paganelli C, Buffoli B, Rodella LF, Rezzani R. Endothelium and its alterations in cardiovascular diseases: life style intervention. Biomed Res Int. 2014;2014:801896. doi: 10.1155/2014/801896 - PMC - PubMed
    1. Dobrina A, Rossi F. Metabolic properties of freshly isolated bovine endothelial cells. Biochim Biophys Acta. 1983;762:295–301. doi: 10.1016/0167-4889(83)90084-8 - PubMed
    1. Spolarics Z, Spitzer JJ. Augmented glucose use and pentose cycle activity in hepatic endothelial cells after in vivo endotoxemia. Hepatology. 1993;17:615–620. doi: 10.1002/hep.1840170415 - PubMed
    1. Culic O, Gruwel ML, Schrader J. Energy turnover of vascular endothelial cells. Am J Physiol. 1997;273:C205–C213. doi: 10.1152/ajpcell.1997.273.1.C205 - PubMed

Publication types

MeSH terms