

doi: 10.1083/jcb.202001188.
VPS13D promotes peroxisome biogenesis
Affiliations
- PMID: 33891012
- PMCID: PMC8077185
- DOI: 10.1083/jcb.202001188
Item in Clipboard
VPS13D promotes peroxisome biogenesis
J Cell Biol.
.
Abstract
The VPS13 gene family consists of VPS13A-D in mammals. Although all four genes have been linked to human diseases, their cellular functions are poorly understood, particularly those of VPS13D. We generated and characterized knockouts of each VPS13 gene in HeLa cells. Among the individual knockouts, only VPS13D-KO cells exhibit abnormal mitochondrial morphology. Additionally, VPS13D loss leads to either partial or complete peroxisome loss in several transformed cell lines and in fibroblasts derived from a VPS13D mutation-carrying patient with recessive spinocerebellar ataxia. Our data show that VPS13D regulates peroxisome biogenesis.
© 2021 Baldwin et al.
Figures
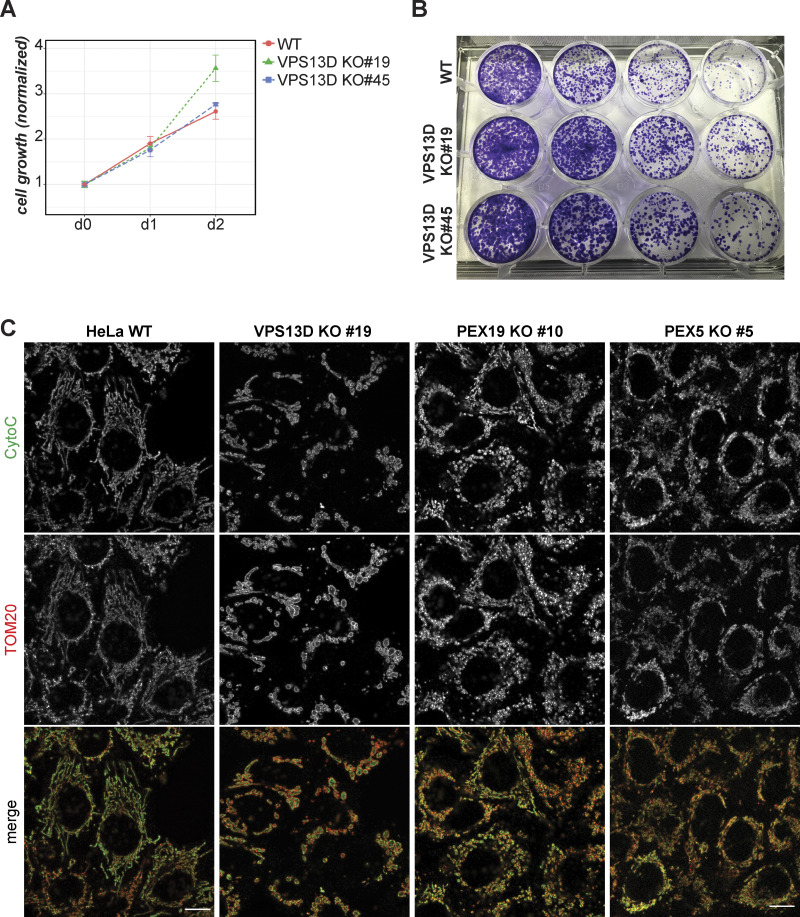
VPS13D loss does not reduce viability of HeLa population. (A) Cell growth rate of WT, VPS13D KO 19, and VPS13D KO 45 HeLa cells measured by CellTiter-Glo assay. Luminescence normalized to day 0 for each group; n = 5,000 cells/well; 3 wells per group. Error bars show SD among the technical replicates. (B) Clonogenic assay of WT and VPS13D KO 19 and 45 cells. Colonies were fixed and stained for crystal violet 8 d after seeding. Four dilution rates were used (columns from left to right): 4 × 10³, 2 × 10³, 1 × 10³, and 5 × 10². (C) HeLa WT, VPS13D KO 19, PEX5 KO 5, and PEX19 KO 10 cells costained for cytochrome c (green) and TOM20 (red). Scale bars = 10 µm.
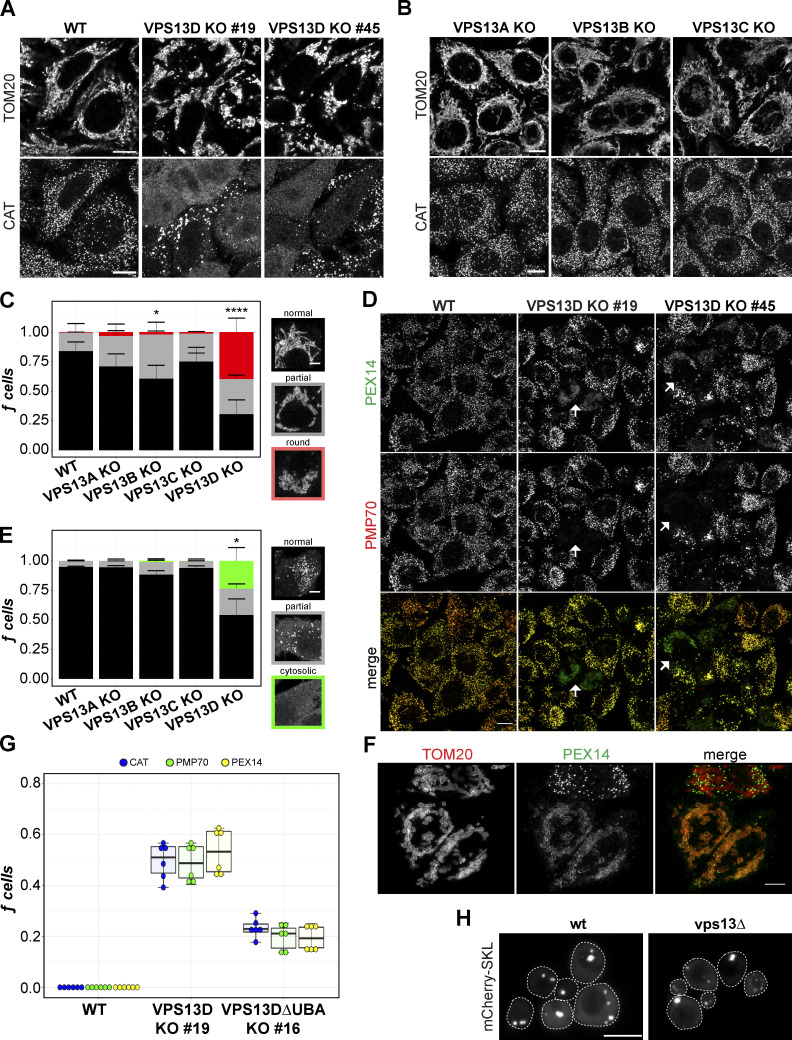
VPS13D, but not VPS13A–C, is required for normal mitochondrial morphology and peroxisome maintenance. (A) HeLa WT and VPS13D KO 19 and KO 45 cells fixed and stained for TOM20 and CAT. (B)
VPS13A–C KO cells similarly stained for TOM20 and CAT. Scale bars = 10 µm. (C) The fraction of each cell line’s population manually classified as “rounded,” “partial,” or “normal” mitochondrial morphology. *, P = 0.0128; ****, P = 0.0003. (D)
VPS13D-KO and WT cells stained for PEX14 and PMP70. Arrows indicate examples of VPS13D-KO cells with simultaneous nonperoxisomal PEX14 and missing PMP70. Scale bars = 10 µm. (E) Cells classified by peroxisome phenotype (CAT signal) as “cytosolic,” “partial,” or “normal.” *, P = 0.0224 (VPS13D KO versus WT). Kruskal-Wallis and Dunn’s tests for multiple comparisons (versus WT) of normal (mitochondrial/peroxisomal) cells were used in C and E. Each count represents a field of ≥ 100 cells; n counts: WT = 15; VPS13A-KO, VPS13B-KO, VPS13C-KO = 12; VPS13D-KO = 18. Error bars represent SEM. (F)
VPS13D KO 45 cells costained for TOM20 and PEX14. Scale bar = 5 µm. (G) Quantification of peroxisomal phenotype in fixed HeLa WT, VPS13D ΔUBA KO 16, and VPS13D KO 19 cells. The fraction of cells missing peroxisomes was determined by cytosolic CAT (blue), negative PMP70 (dark-green), or mislocalized PEX14 (yellow-green) signal. n = 3 counts; ≥100 cells per count. Boxes mark 25th, 50th, and 75th percentiles, and lines show the upper and lower extreme values (Tukey method). (H)
vps13Δ and control yeast transiently transfected with peroxisomal marker mCherry-SKL. Cells were outlined (dashed white lines) by hand for visibility. Scale bar = 1 µm.
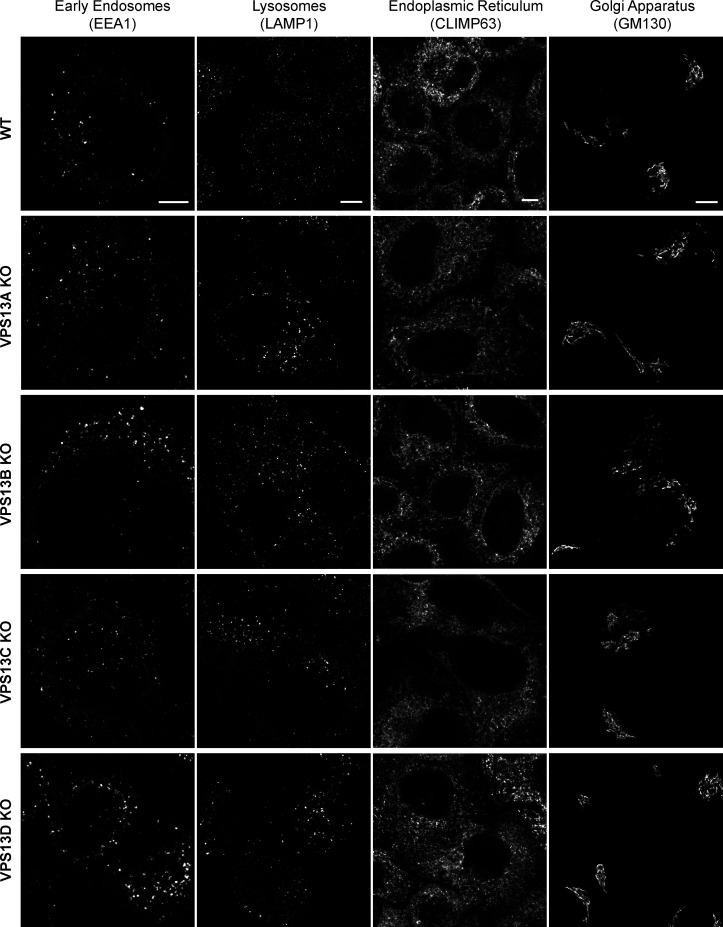
Other organelles in VPS13A–D KO cells are morphologically normal. WT, VPS13A-KO, VPS13B-KO, VPS13C-KO, and VPS13D KO 45 cells were fixed and immunostained for EEA1, LAMP1, GM130, or CLIMP63. Scale bars = 5 µm.
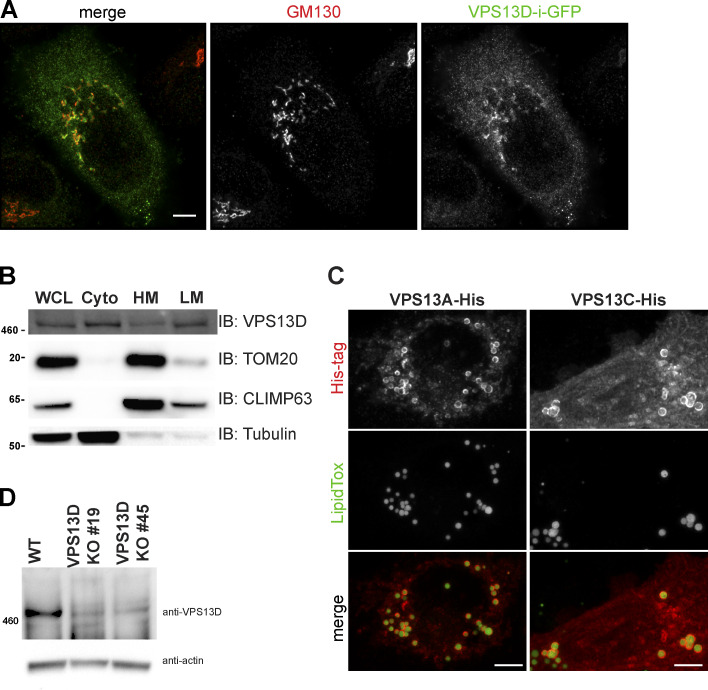
Exogenous VPS13D preferentially localizes to Golgi, while VPS13A and VPS13C localize to lipid droplets. (A) HeLa cells transiently transfected with VPS13D-i-GFP immunostained for GFP and GM130 (red). (B) Subcellular fractionation Western blot of HeLa WT cells for endogenous VPS13D. WCL, whole cell lysate; Cyto, cytosol; HM, heavy membrane; LM, light membrane. (C) His-tagged VPS13A or VPS13C stained for His-tag (red) and lipid droplets (LipidTox; green). (D) Western blot of VPS13D in HeLa WT, VPS13D KO 19, and VPS13D KO 45 cells with actin loading control. Scale bars in A and C = 5 µm.
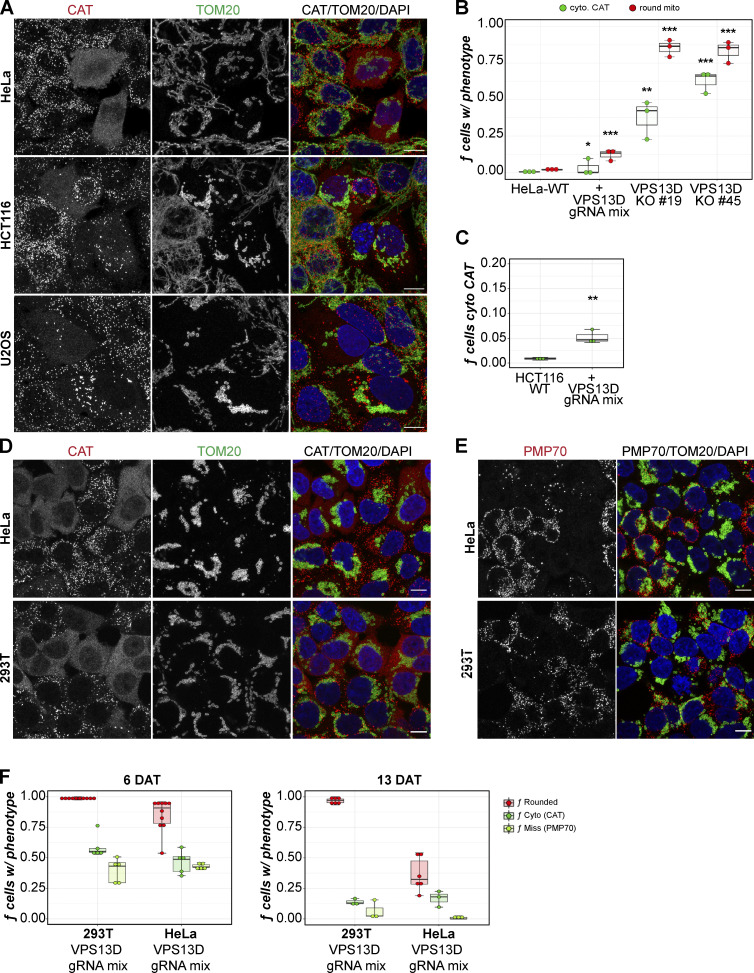
VPS13D loss causes mitochondrial and peroxisomal phenotypes in multiple cell lines. (A) Representative images of HeLa, HCT116, and U2OS cells after transfection of VPS13D CRISPR gRNA mix were fixed and stained for CAT (red) and TOM20 (green). (B) Quantification of cells with cytosolic (cyto.) CAT and rounded mitochondria (mito) in HeLa cells with and without VPS13D gRNA mix in parallel with VPS13D KO 19 and 45 cells. One-way ANOVA, Tukey post-hoc multiple comparisons (vs. HeLa-WT): *, P = 0.0320; **, P = 0.0016; ***, P < 0.0005. (C) Quantification of the peroxisomal phenotype (CAT) of HCT116 cells with and without VPS13D gRNA mix. Welch t test: **, P = 0.0045. (D and E) Representative images of HeLa and 293T cells 6 DAT with VPS13D gRNA mix stained for CAT (red) and TOM20 (green; D) or for PMP70 (red) and TOM20 (green; E). (F) Quantification of cells with rounded mitochondria, cytosolic (Cyto) CAT, and missing (Miss) PMP70 signal in 293T and HeLa cells either 6 DAT or 13 DAT with VPS13D gRNA mix. Each dot represents the count from one field of images. Mean cells/field for 6 DAT: n = 116 (HeLa), n = 138 (293T); mean cells/field for 13 DAT: n = 72 (HeLa), n = 86 (293T). Partial peroxisome phenotype cells were excluded from the total count. Box-and-whisker plot whiskers in B, C, and F represent minimum (before lower fence) and maximum (before upper fence) values. Scale bars = 10 µm.
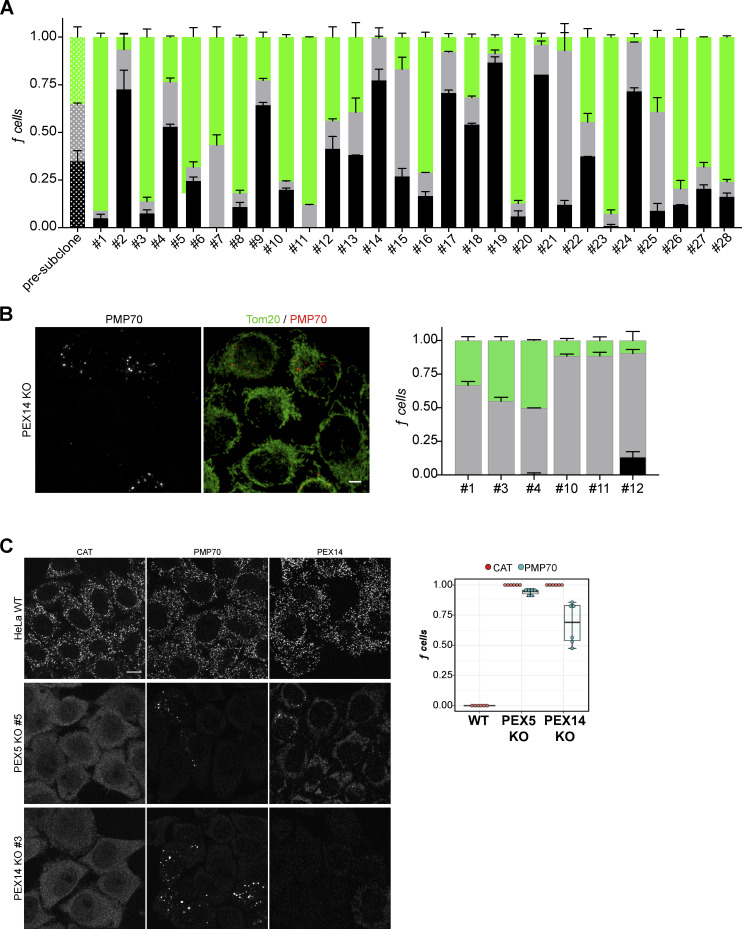
Stochastic peroxisome phenotype heterogeneity in Vps13D-KO populations. (A)
VPS13D KO 19 cells were subcloned. Selected single colonies were sampled 16 d after subcloning for immunofluorescence (CAT): “normal” (black), “partial” loss (gray), and “missing” peroxisomes or cytosolic CAT (green). For each experiment, n = 6 counts, ≥100 cells per count. (B) Six independent PEX14-KO clones were immunostained with PMP70 and TOM20 and manually classified by peroxisome phenotype: “normal” (black), “partial” (gray), or “missing” (green). One-way ANOVA (fraction of normal peroxisome cells between clones; P = 0.0054; n = 3 counts/clone, ≥100 cells per count. Scale bar = 5 µm. Error bars in A and B represent SEM. (C) Representative images and box plots of the fraction of HeLa WT, PEX5-KO, and PEX14-KO cells with cytosolic CAT (red) or missing PMP70 (blue). Also included are representative images of PEX14 staining. Per group, n = 3 counts/clone, ≥100 cells per count. Boxes mark 25th, 50th, and 75th percentiles, and lines show the upper and lower extreme values (Tukey method). Scale bar = 10 µm.
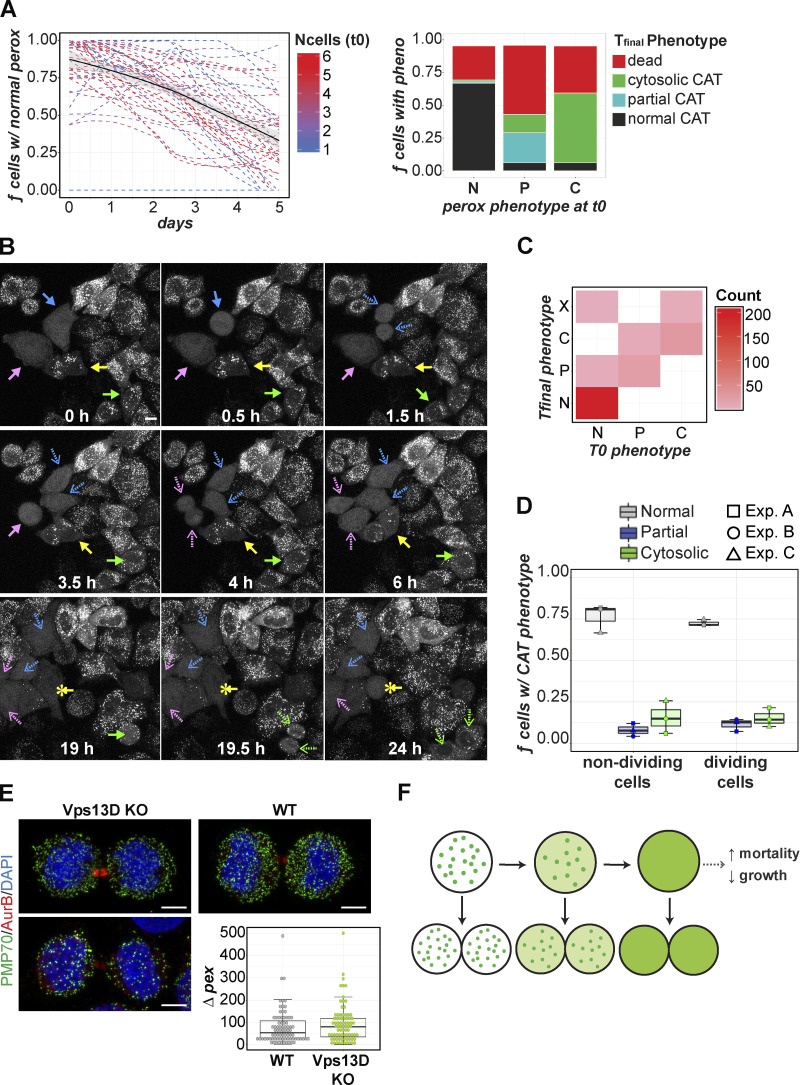
Peroxisome phenotype changes over time in VPS13D-KO. (A) GFP-CAT stable VPS13D-KO cells were seeded at one to six cells per well. Time-lapse imaging of live cells at 12-h intervals (interrupted by media changes between intervals). Time point 0 (t0) is defined as the first day of imaging (1 d after seeding). Left: Fraction of normal peroxisome (perox) cells (per well). Trend line (dashed) for each well was fitted via LOWESS. Light gray region indicates SE. The lines are colored by total number of cells (Ncells) in the well at t0. Best fit line of total wells modeled via LOWESS is indicated by the black solid line. Right: Individual GFP-CAT VPS13D-KO cells separated into groups by their initial peroxisomal phenotype (normal, partial, missing) and fraction of cells classified as normal (dark gray), partial (turquoise), or missing (green) peroxisomes or dead (red) at final time point (day 5). n = 43 wells; 1–30 unique cells per well. GFP-CAT VPS13D-KO were seeded into chamber wells, and selected fields were imaged continuously overnight. Three independent experiments (detailed in Fig. S5) were performed over different time periods: 8 (experiment A), 12 (experiment B), or 25 (experiment C) h at 900-s (experiment A) or 600-s (experiments B and C) intervals. (B) Select frames from one field of experiment C. Arrows point to cells of interest for tracking with cytosolic CAT/missing peroxisomes (pink and blue) or partial peroxisome phenotype (yellow and green). Dashed arrows (pink, blue, or green) point to the progeny of the same (color-matched) cells at later time points. Note one of the pink daughter cells drifts out of frame at ∼24 h. Yellow asterisks indicate the transformation of partial to cytosolic CAT phenotype within an individual cell (19 h). Scale bar = 10 µm. (C) Heatmap plot correlating a cell’s peroxisomal phenotype (CAT localization) at the initial (0 h) time-point with their (or their progeny’s) final phenotype (8-25 h). N, normal; P, partial; C, cytosolic; X, dead/dying. (D) Cells at the initial time point were classified by whether they divided by the end of the experiment according to initial peroxisomal phenotype: normal (gray), partial (blue), or cytosolic (green) CAT. Each point is one independent experiment.Boxes mark 25th, 50th, and 75th percentiles, and lines show the upper and lower extreme values (Tukey method). n cells per experiment were as follows: A (square) = 91 nondividing, 12 dividing; B (circle) = 47 nondividing, 7 dividing; C (triangle) = 39 nondividing and 79 dividing. No significant difference in peroxisome phenotype prevalence in the dividing versus nondividing groups (Welch’s two-sample t test). (E) Representative images of dividing WT and VPS13D-KO cells stained for PMP70, DAPI, and Aurora B. Two representative images of dividing VPS13D-KO cells that originally had normal (top) or reduced (bottom) peroxisomes are shown. Difference in peroxisome count between two daughter cells (each dot represents one pair of newly divided daughter cells) is shown in the right-hand bottom panel. Both WT and VPS13D-KO: n = 80 images (2 daughter cells per image). Scale bar = 5 µm. (F) Model of VPS13D’s variable effect on peroxisome number. Green represents localization of CAT.
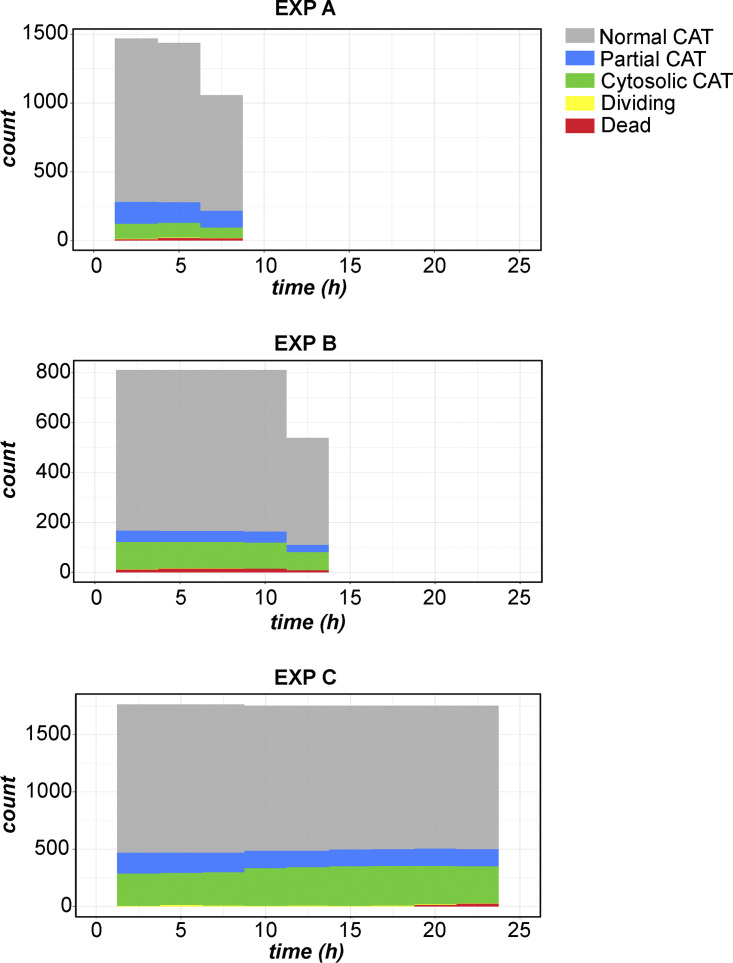
Histograms of peroxisome phenotypes over time in overnight GFP-CAT VPS13D-KO experiments. Binned histograms showing counts of cells observed as having either normal (gray), partial (blue) missing/cytosolic CAT (green) peroxisomal phenotype, dividing (yellow), or dead (red) at each time point. Experiment A: 900-s intervals, 34 time points (30,600 s final time point), 103 cells at initial time point; experiment B: 600-s intervals, 78 time points (46,200 s), 54 cells at first time point; experiment C: 600-s intervals, 151 time points (90,000 s), 118 initial cells.
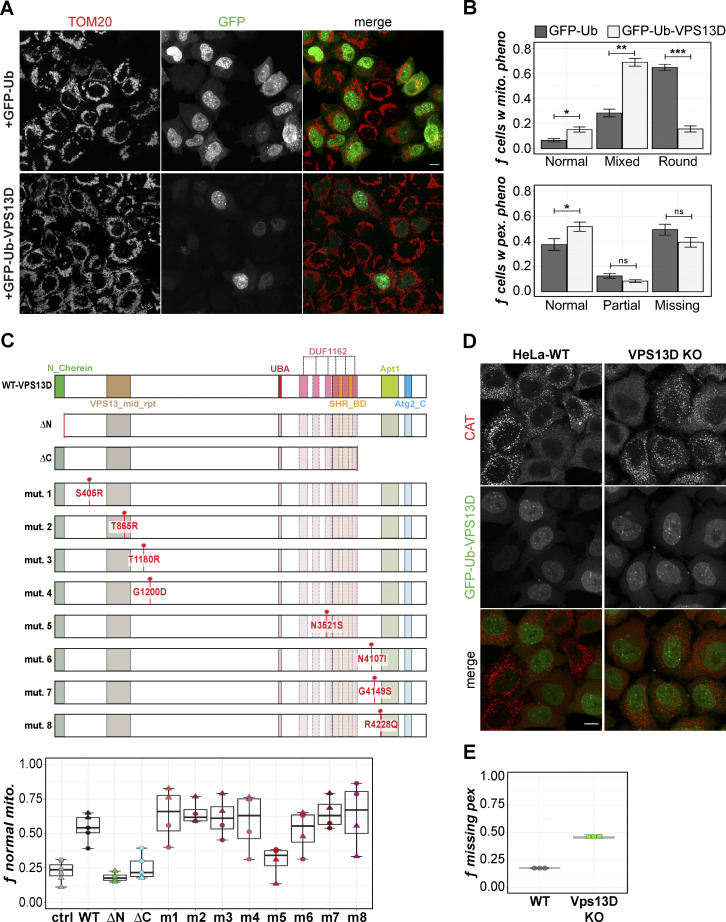
Exogenous expression of VPS13D rescues VPS13D-KO mitochondrial phenotype, but not peroxisomal phenotype. (A)
VPS13D KO 19 cells were transiently transfected with either GFP-Ub-VPS13D or GFP-Ub (ctrl) for 2 d and stained for TOM20. (B) Proportion of GFP-positive cells manually classified as having either round and fragmented, fragmented only, or normal mitochondria for GFP-Ub-VPS13D and GFP-Ub groups. Welch’s two-sample t test between groups for each phenotype class: *, P = 0.03055; **, P = 0.0007925; ***, P = 0.0001459. The same analysis was performed for peroxisome phenotypes (CAT): *, P = 0.0126. Error bars in A and B represent SEM. (C) Schematic (top panel) of WT VPS13D protein domains, including the β-propeller/DUF1162 regions (light pink). Patient mutations are indicated by red star. Bottom: Quantification of the proportion of VPS13D KO 45 cells with normal mitochondrial morphology following transfection with the corresponding VPS13D constructs. Each point is an independent field of view of two independent experiments, A (circles) and B (triangles). 3–4 images/experiment (ctrl); 2–3 images/experiment (ΔN, ΔC, mutants 1–8); mean number of cells per image: n = 272 (ctrl), n = 81 (nonctrl). (D) HeLa WT and VPS13D-KO cells stably expressing GFP-Ub-VPS13D and stained for CAT. (E) Quantification of peroxisomal phenotype in cells from D; n = 3 counts, ≥100 cells/count. Scale bar = 5 µm. Box-and-whisker plot whiskers in C and E represent minimum (before lower fence) and maximum (before upper fence) values.
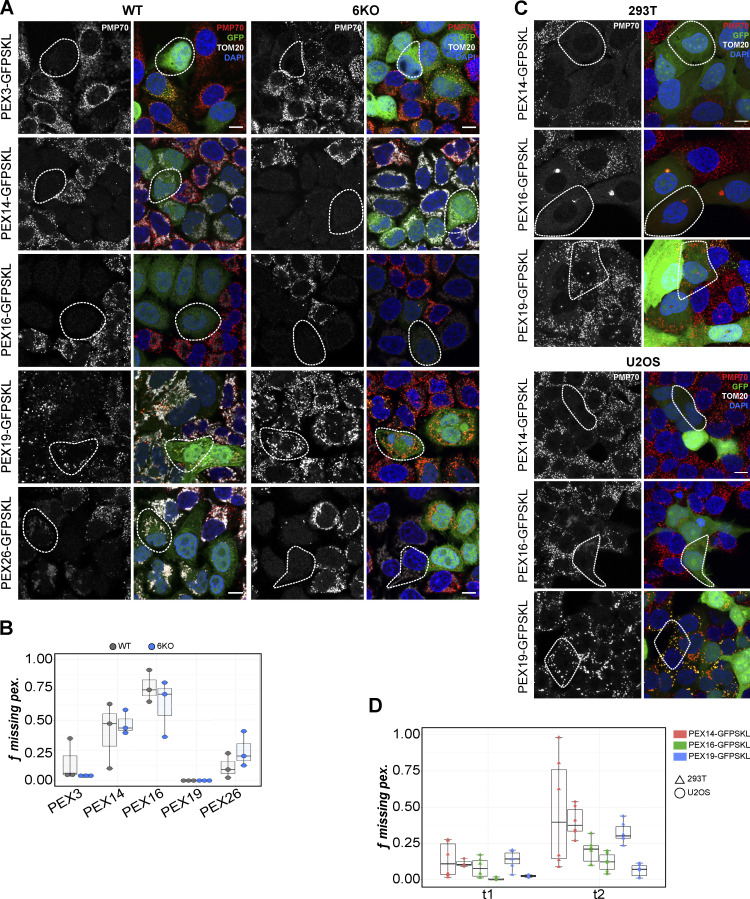
Overexpression of peroxisomal membrane proteins disrupts peroxisomal biogenesis in WT cells. (A) Representative images of HeLa WT and ATG8 6KO cells stably coexpressing untagged PEX genes and GFP-SKL. Cells were stained for PMP70 (red in merged) and TOM20 (white in merged). The PMP70 channel is isolated as a grayscale image. (B) Box plots quantify the fraction of WT (gray) or 6KO (blue) cells missing PMP70-positive peroxisomesfollowing overexpression of each PEX gene; each dot represents an independent field of view; total cells per group: n = 562 (PEX3, WT), n = 522 (PEX3, 6KO); n = 131 (PEX14, WT), n = 285 (PEX14, 6KO); n = 95 (PEX16, WT), n = 190 (PEX16, 6KO); n = 352 (PEX19, WT), n = 388 (PEX19, 6KO); n = 370 (PEX26, WT), n = 388 (PEX26, 6KO). (C) 293T and U2OS cells transduced with the PEX-IRES-GFPSKL (green) constructs stained with PMP70 and DAPI. (D) Box plots of the fraction of PEX-overexpressing 293T (triangles) and U2OS (circles) cells missing peroxisomes 1 wk (t1) and 2 wk (t2) after transduction. Each point represents an independent field of view; mean number of cells per field: n = 262 (PEX14, 293T), n = 259 (PEX16, 293T), n = 200 (PEX19, 293T); n = 79 (PEX14, U2OS), n = 71 (PEX16, U2OS), n = 70 (PEX19, U2OS). Representative images in D are from the second time point. Exemplifying cells are highlighted by white dashed outlining.Scale bar = 10 µm. For B and D, boxes mark 25th, 50th, and 75th percentiles, and lines show the upper and lower extreme values (Tukey).
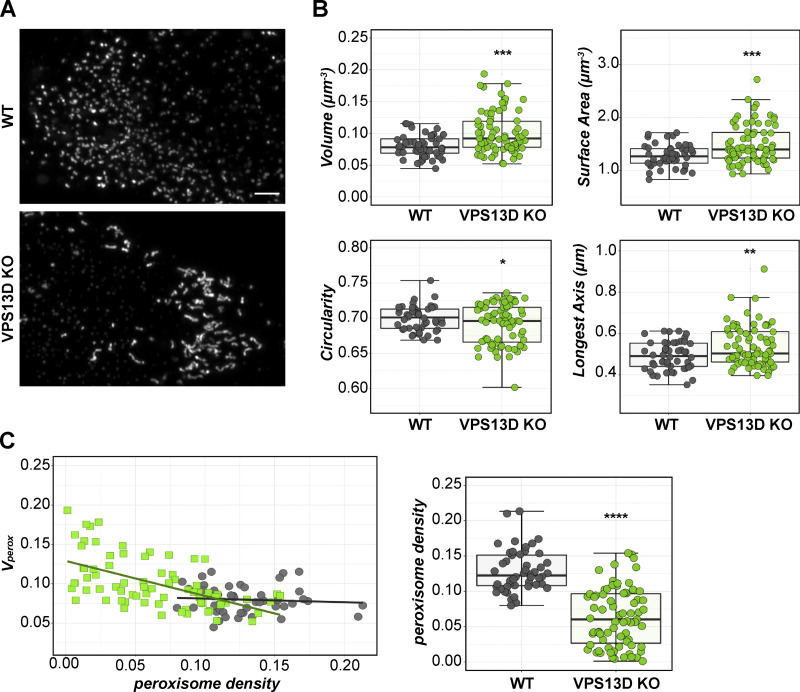
VPS13D-KO cells have elongated peroxisomes correlating with peroxisome loss. (A) Maximum-intensity projections of super-resolution images of WT and VPS13D-KO cells stained for PMP70. (B) Morphology and size measurements of individual peroxisomes in WT or VPS13D-KO cells. Each data point represents the average values of all peroxisomes in an individual cell. Shape factor represents deviation from circularity (circle = 1). Welch’s t test; ****, P < 0.0001 (volume, surface area); **, P = 0.0024 (longest axis); *, P = 0.0358 (circularity). (C) Linear regression analysis: peroxisomal volume versus peroxisome density (number of peroxisomes per cell volume, µm−3) plot (left) inVPS13D-KO (green) or WT (gray) cells. VPS13D-KO slope = −0.5944 to −0.29242; WT slope = −0.2191 to 0.127 (95% CI); test for if slope is significantly nonzero: KO, P < 0.0001; WT, P = 0.5950. Right: Relative peroxisome density (number per cell volume) in WT and VPS13D-KO cells; Welsh’s t test; ****, P < 0.0001. VPS13D-KO 19 and 45 cells included in analysis. WT, n = 48 cells; VPS13D-KO, n = 75 cells. Scale bar = 5 µm. For B and C (right), boxes mark 25th, 50th, and 75th percentiles, and lines show the upper and lower extreme values (Tukey).
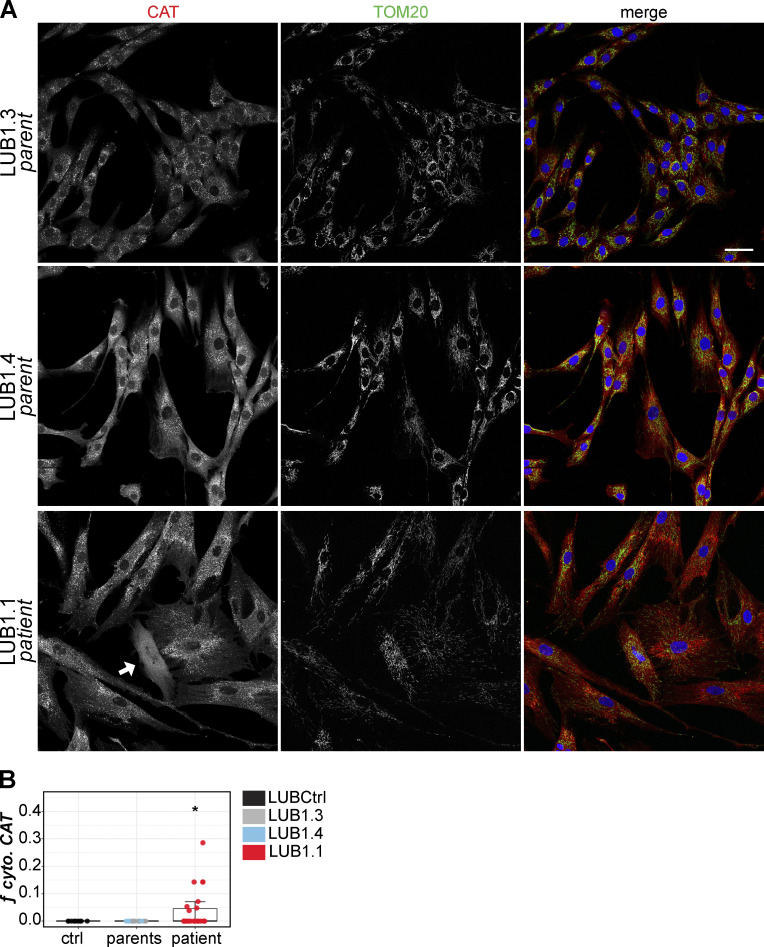
VPS13D mutation carrying patient fibroblasts also show peroxisome loss. (A) Fibroblasts from SCAR4 patient (LUB1.1; bottom panel) and the patient’s two heterozygous nonsymptomatic parents (LUB1.3 and LUB1.4; top and middle panels) immunostained for CAT (red) and TOM20 (green); nuclei were visualized by DAPI (blue). Cell with cytosolic CAT is identified with a white arrow. Scale bar = 50 µm. (B) Quantification of cytosolic (cyto.) CAT cells in LUB1.1 patient cells (red) compared with the two unaffected parental lines, LUB1.3 (light blue) and LUB1.4 (gray), or an unrelated control fibroblast line, LUBCtrl (black). Three separate experiments are grouped; each data point represents an independent field of view. Parental and unrelated control data were combined into a single group (“control”) for statistical comparison with LUB1.1 (patient). Welch’s t test; *, P = 0.0154. Per group: n = 26 (patient), n = 22 (control); boxes mark 25th, 50th, and 75th percentiles, and lines show the upper and lower extreme values (Tukey).
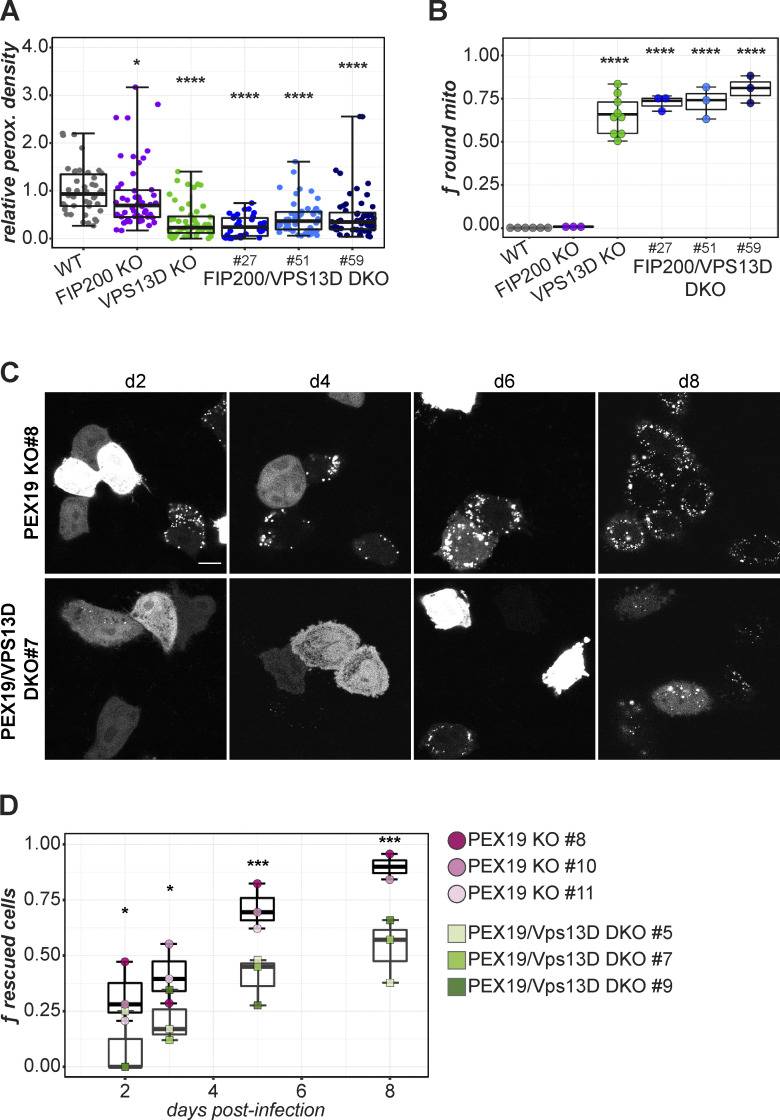
PEX19-mediated biogenesis is attenuated by VPS13D loss. (A) Relative peroxisome density in WT, FIP200-KO, VPS13D KO 45, and three FIP200/VPS13D DKO subclones. Kruskal-Wallis and Dunn tests for multiple comparisons versus WT; ****, P < 0.0001. Cells per group: n = 42 (WT), n = 52 (VPS13D-KO), n = 50 (FIP200-KO), n = 36 (FIP200/VPS13D-DKO 27, 51), n = 56 (FIP200/VPS13D-DKO 59). (B) Quantification of round mitochondria in each cell line. Each point represents an independent field of view. One-way ANOVA, Tukey post hoc multiple comparisons test (versus WT); ****, P < 0.0001. Per group number of images (N) and total cells (n): WT, n = 6, n = 1,987; VPS13D-KO, n = 9, n = 3,179; FIP200-KO, n = 3, n = 1,016; FIP200/VPS13D-DKO 27, n = 3, n = 811; DKO 51, n = 3, n = 828; DKO 59, n = 3, n = 872. (C) Representative images of live PEX19-KO or PEX19/VPS13D-DKO cells transduced with PEX19-IRES-GFP-SKL at each time point. Peroxisome presence or absence is indicated by punctate or cytosolic GFP-SKL. Scale bar = 20 µm. (D) Time course of rescued cells (containing peroxisomes) following PEX19 reintroduction. Each dot represents the mean fraction of 6 fields of view per PEX19-KO or PEX19/VPS13D-DKO subclone. Welch’s t test; *, P < 0.05; ***, P < 0.001. Total cells across all time points: n = 252 (PEX19 KO 8), n = 196 (PEX19 KO 10), n = 189 (PEX19 KO 11), n = 226 (PEX19/VPS13D DKO 5), n = 217 (PEX19/VPS13D DKO 7), n = 228 (PEX19/VPS13D DKO 9). Mean number of cells per time point: n = 63 (PEX19 KO 8, PEX19 KO 11), n = 49 (PEX19 KO 10), n = 56 (PEX19/VPS13D DKO 5), n = 54 (PEX19/VPS13D DKO 7), n = 57 (PEX19/VPS13D DKO 9). For A, B, and D, boxes mark 25th, 50th, and 75th percentiles, and lines show the upper and lower extreme values (Tukey).
References
-
- Abadi, M., Agarwal A., Barham P., Brevdo E., Chen Z., Citro C., Corrado G.S., Davis A., Dean J., Devin M., et al. 2016. TensorFlow: large-scale machine learning on heterogeneous distributed systems. http://tensorflow.org
-
- Anding, A.L., Wang C., Chang T.K., Sliter D.A., Powers C.M., Hofmann K., Youle R.J., and Baehrecke E.H.. 2018. Vps13D encodes a ubiquitin-binding protein that is required for the regulation of mitochondrial size and clearance. Curr. Biol. 28:287–295.e6. 10.1016/j.cub.2017.11.064 - DOI - PMC - PubMed
Publication types
MeSH terms
Substances
Grants and funding
LinkOut - more resources
Full Text Sources
Research Materials
