Review
. 2021 Oct;22(5):567-589.
doi: 10.1007/s10162-021-00795-2. Epub 2021 Apr 23.

The Panoramic ECAP Method: Estimating Patient-Specific Patterns of Current Spread and Neural Health in Cochlear Implant Users

Affiliations
Review

The Panoramic ECAP Method: Estimating Patient-Specific Patterns of Current Spread and Neural Health in Cochlear Implant Users

Charlotte Garcia et al. J Assoc Res Otolaryngol. 2021 Oct.

Abstract

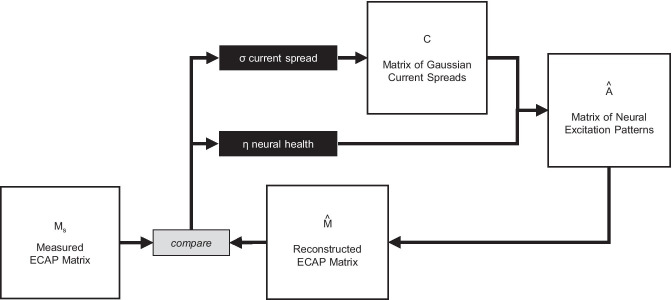
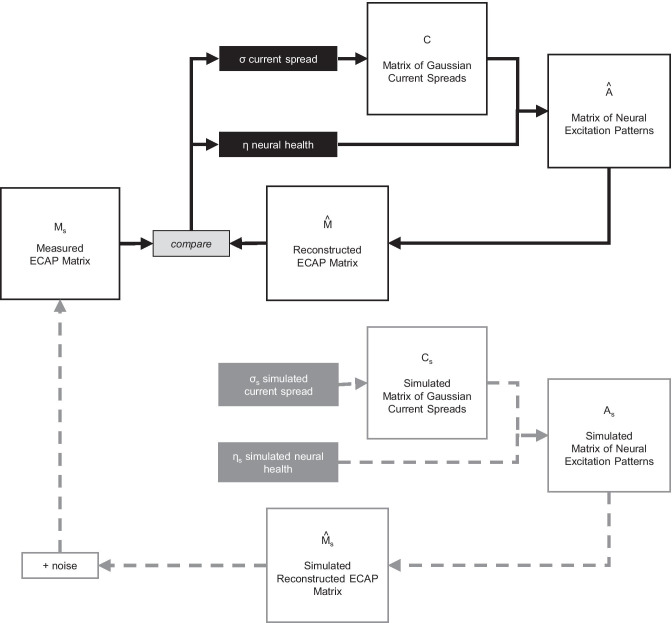
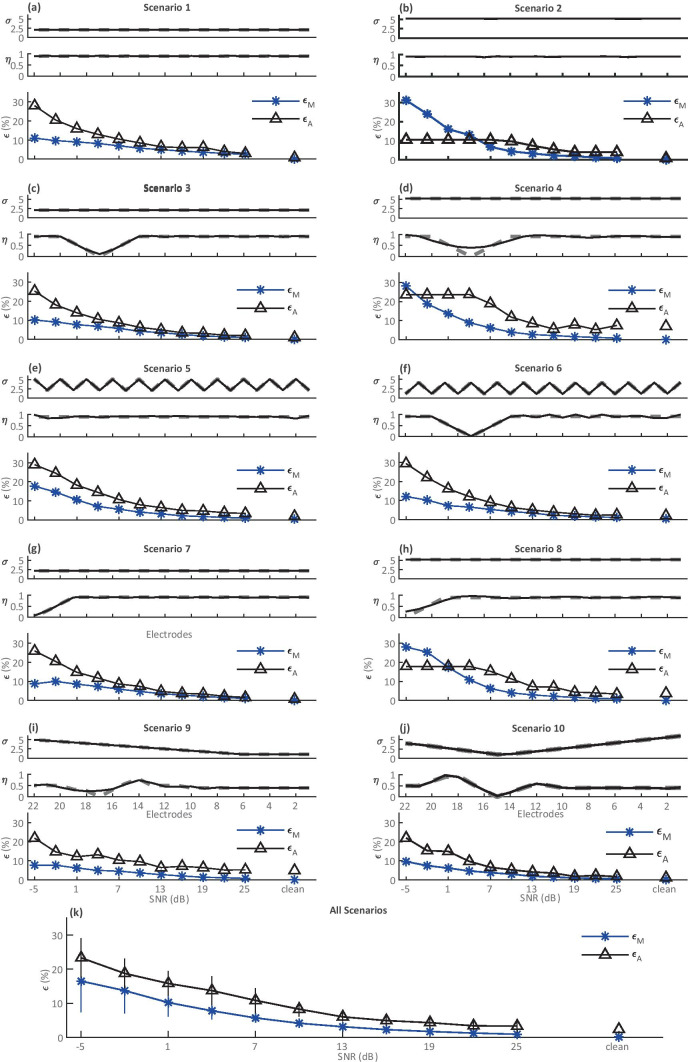
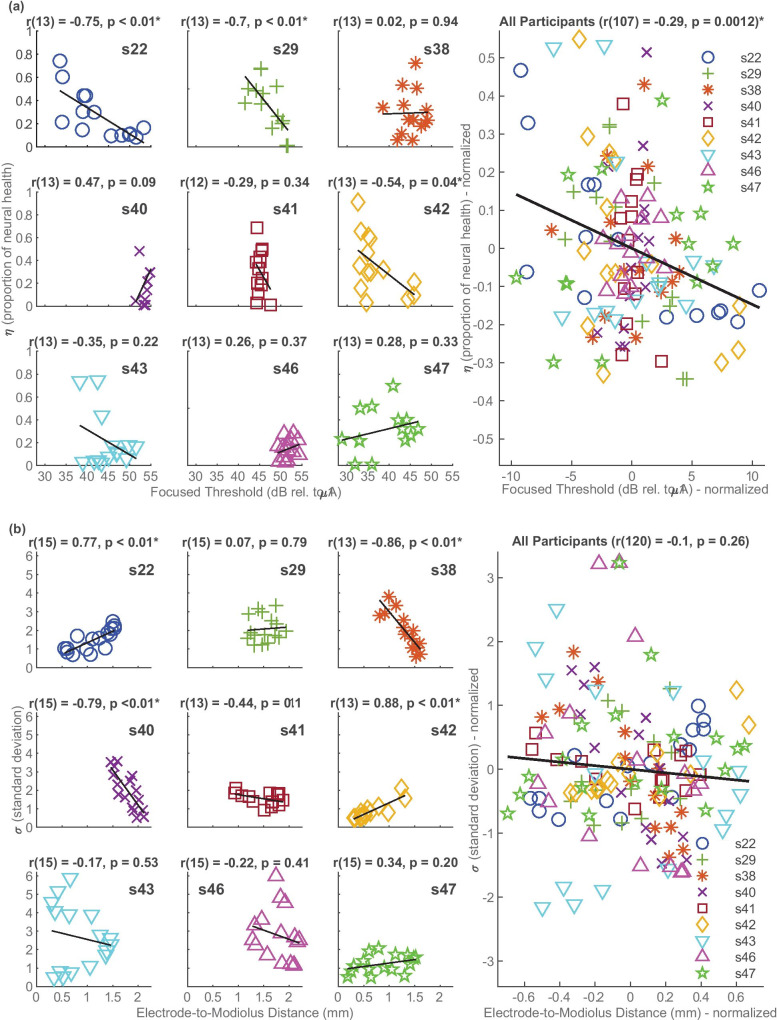
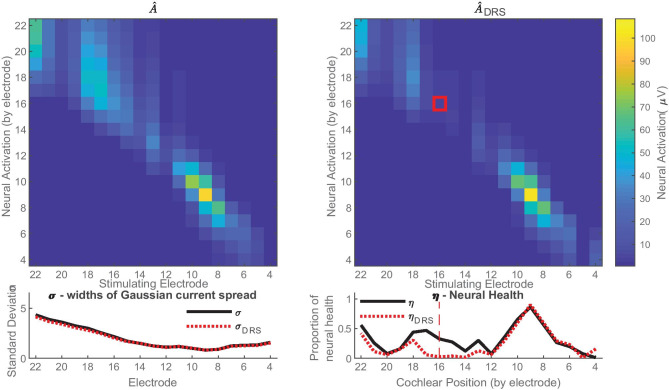
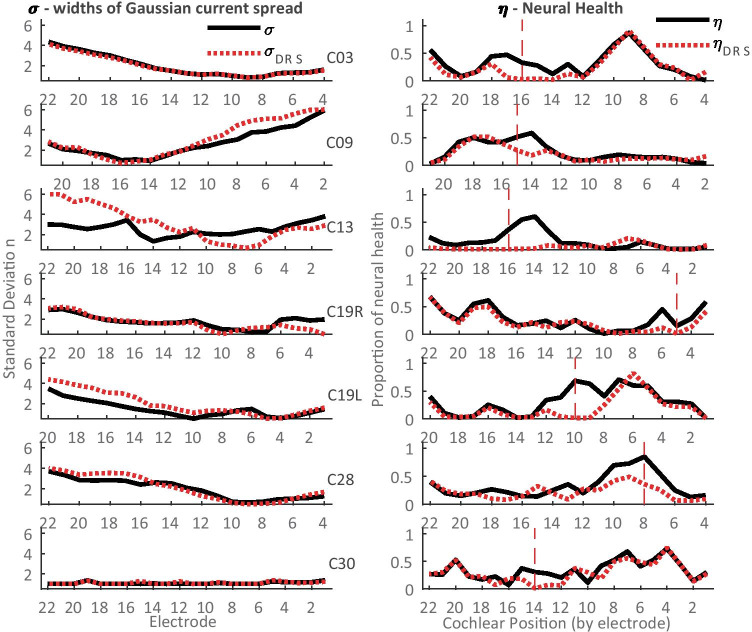
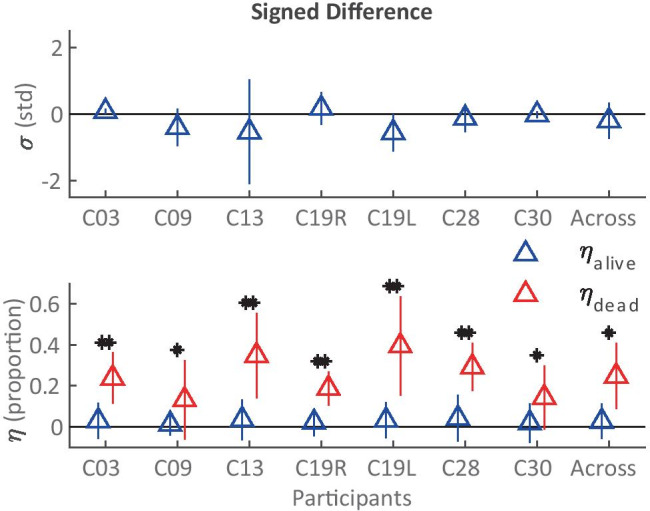
The knowledge of patient-specific neural excitation patterns from cochlear implants (CIs) can provide important information for optimizing efficacy and improving speech perception outcomes. The Panoramic ECAP ('PECAP') method (Cosentino et al. 2015) uses forward-masked electrically evoked compound action-potentials (ECAPs) to estimate neural activation patterns of CI stimulation. The algorithm requires ECAPs be measured for all combinations of probe and masker electrodes, exploiting the fact that ECAP amplitudes reflect the overlapping excitatory areas of both probes and maskers. Here we present an improved version of the PECAP algorithm that imposes biologically realistic constraints on the solution, that, unlike the previous version, produces detailed estimates of neural activation patterns by modelling current spread and neural health along the intracochlear electrode array and is capable of identifying multiple regions of poor neural health. The algorithm was evaluated for reliability and accuracy in three ways: (1) computer-simulated current-spread and neural-health scenarios, (2) comparisons to psychophysical correlates of neural health and electrode-modiolus distances in human CI users, and (3) detection of simulated neural 'dead' regions (using forward masking) in human CI users. The PECAP algorithm reliably estimated the computer-simulated scenarios. A moderate but significant negative correlation between focused thresholds and the algorithm's neural-health estimates was found, consistent with previous literature. It also correctly identified simulated 'dead' regions in all seven CI users evaluated. The revised PECAP algorithm provides an estimate of neural excitation patterns in CIs that could be used to inform and optimize CI stimulation strategies for individual patients in clinical settings.

Keywords: cochlear implant (CI); current spread; electrically evoked compound action potential (ECAP); neural excitation patterns; neural health; optimization.


Conflict of interest statement

The authors declare no competing interests.

Figures

Fig. 1
Fig. 1
Schematics and components for the forward-masking artefact-reduction technique. The maskers (dashed blue lines) and probes (solid green lines) are presented in biphasic current units, and the waveforms (solid black lines) were measured in C28 (with the probe and masker both on electrode 3) in µV (y axis) over a period of 2 ms (x axis). Ap is the stimulus artefact as a result of the probe, Am is the same for the masker, Np is the neural response to the probe, Nm is the same for the masker, Θ is the amplifier switch-on artefact, φ is baseline neural activity, and k is the proportion of the probe’s neural response that is not masked by the masker. For maskers and probes presented on the same electrode, the entire neural response to the probe is masked. Therefore, k = 0 and the resulting ECAP waveform is Np
Fig. 2
Fig. 2
An example of the PECAP Mo matrix measured for a CI participant (C03), each cell of which represents the amplitude of an ECAP waveform in µV, recorded using all possible combinations of probe and masker electrodes from base to apex. It can be seen that the ECAP amplitudes are highest along the diagonal of the matrix for which probe and masker are placed on the same electrode, thereby maximising the overlap in neural excitation area
Fig. 3
Fig. 3
Schematics and components for the forward-masking artefact-reduction technique in the dead region simulation condition. Note that the onset of each of the biphasic current pulses (pre-masker pulses, maskers, and probes alike) was spaced 400 µs apart from each other. The additional symbols in the ‘waveform components’ column not described in Fig. 1 are in red and are as follows: Apmp1 is the stimulus artefact as a result of the first pre-masker pulse, Apmp2 is the same for the second pre-masker pulse, Npmp1 is the neural response to the first pre-masker pulse, and Npmp2 is the same for the second pre-masker pulse. With the addition of the two pre-masker pulses (red dotted lines) prior to the Masker and Probe pulses in the standard forward-masking artefact-reduction technique, there is no change to the result of the ECAP waveform equation, as the additional components are all subtracted out
Fig. 4
Fig. 4
a An example of a neural health vector ƞ along the cochlea from apex (left) to base (right) with a dead region centred on electrode 17. b The Gaussian current spread (solid blue line) centred on electrode 16 (C16) and the resultant neural activation pattern (dashed red line) for the same electrode that is defined as A16 = C16 · ƞ
Fig. 5
Fig. 5
Schematic for the PECAP algorithm. The optimization algorithm adjusts the values in the σ and ƞ vectors, reconstructs M^, and updates σ and ƞ iteratively in order to minimize the RMSE between Mo and M^
Fig. 6
Fig. 6
Schematic for the ‘backward model’ of PECAP used for the computational validation of the model accuracy and its sensitivity to noise. The two vectors σs and ƞs are initialized with pre-defined values, the backwards (grey) part of the algorithm is run to generate a simulated Ms using Eqs. (6), (4), and (3), and random Gaussian noise is added. The algorithm is then run in the normal, forward manner (black) with σ and ƞ initialized from random numbers as described previously, and the resultant final estimates of σ and ƞ are evaluated by comparing them to σs and ƞs
Fig. 7
Fig. 7
Error (RMSE) profiles as a function of SNR for ten simulated scenarios (aj). The neural health vector (ƞ) and the current spread vector (σ) used to generate the ten scenarios are shown for every electrode (N = 22 electrodes) in each plot. In the top two graphs for each simulation scenario, the dashed grey lines indicate the simulated values (ƞs and σs), and the solid black lines indicate the reconstructed predictions of the algorithm (ƞ and σ) at SNR = ∞ (no noise added). The bottom graph for each simulation scenario shows the εMs,M^ and εAs,A^ values across all SNR levels, normalized by the maximum value in the Ms and As matrices respectively for each condition. Therefore, while the units are indicated as %, the RMSE values have been normalized so they fall on a scale of 0–1. Note that estimates of ƞ for the neural dead regions in scenarios 4, 8, and 9 are suboptimal. The across-electrode correlations between original and reconstructed ƞ for these scenarios (ƞs,ƞ) are r(21) = 0.91, 0.97, and 0.87, respectively (all with p < 0.001). The εMs,M^ and εAs,A^ values were then averaged across conditions for all SNRs in the final graph (k), in which error bars indicate one standard deviation from the sample mean
Fig. 8
Fig. 8
a The left-hand plots show the within-participant, across-electrode correlations between Focused Thresholds (obtained using sQP stimulation) and PECAP estimate of neural health (ƞ). The right-hand plot shows the combined correlations for all participants, with between-participant differences removed by expressing each value relative to the mean for that participant. b This is in the same format as a but showing the correlations between electrode-to-modiolus distances and PECAP estimate of current spread (σ)
Fig. 9
Fig. 9
Neural dead region simulation results for participant C03. In the top left, the A^ matrix for neural excitation patterns which PECAP estimates for the standard condition, and in the top right, the A^DRS matrix which PECAP estimates for the neural dead region simulation condition. The neural dead region was simulated for this participant at electrode 16, as indicated by the red box. The graph in the bottom left indicates PECAP estimation of current spread (σ) was consistent between the standard condition (black, straight line) and the neural dead region simulation condition (red, dotted line). The graph in the bottom right shows PECAP estimation of neural health (ƞ) for both conditions. Poorer estimated neural health is apparent for the neural dead region simulation in comparison to the standard condition from electrodes 13 to 18, but estimates were largely consistent between the two conditions for the other electrodes
Fig. 10
Fig. 10
PECAP estimates for σ (current spread, left) and ƞ (neural health, right) for the seven participants for whom neural dead region simulations were performed. Solid black lines indicate estimations of neural health and current spread from the standard PECAP condition, and dotted red lines indicate estimations in the dead region simulation condition. Vertical dashed red lines in the ƞ graphs indicate the electrode that was used for the neural dead region simulation for each participant
Fig. 11
Fig. 11
Signed differences for σ (current spread) and ƞ (neural health) for each of the seven participants who participated in the dead region simulation part of the experiment. The error bars represent one standard deviation from the sample mean. The asterisks show cases where the ƞalive and ƞalive signed differences were statistically significant from each other as a result of a two-tailed t-test. Across electrodes, all the individual participants showed p < 0.001 and Hedge’s gs > 0.8 (**) between ƞalive and ƞalive signed differences, except for C09 (p = 0.038, Hedge’s gs = 0.59, df = 19) and C30 (p = 0.036, Hedge’s gs = 0.78, df = 21) (*)
Fig. 12
Fig. 12
5th order polynomial transfer function (Eq. 12) between RMSEs of Mo matrices and SNR values from −20 to 10 dB is indicated as the operating SNR threshold above which PECAP estimates are considered reliable. The 24-sweep RMSEs for the Mo s of each of the 11 human CI participants in the second cohort are plotted

References

    1. Abbas PJ, Brown CJ, Shallop JK, Firszt JB, Hughes ML, Hong SH, Staller SJ. Summary of results using the nucleus C124M implant to record the electrically evoked compount action potential. Ear Hear. 1999;20:45–59. doi: 10.1097/00003446-199902000-00005. - DOI - PubMed
    1. Abbas PJ, Hughes ML, Brown CJ, Miller CA, South H. Channel interaction in cochlear implant users evaluated using the electrically evoked compound action potential. Audiol Neurootol. 2004;9:203–213. doi: 10.1159/000078390. - DOI - PubMed
    1. Avci E, Nauwelaers T, Lenarz T, Hamacher V, Kral A (2014) Variations in microanatomy of the human cochlea. J Comp Neurol 3245–3261 - PMC - PubMed
    1. Biesheuvel JD, Briaire JJ, Frijns JM. A novel algorithm to derive spread of excitation based on deconvolution. Ear Hear. 2016;37:572–581. doi: 10.1097/AUD.0000000000000296. - DOI - PubMed
    1. Bland JM, Altman DG. Calculating correlation coefficients with repeated observations: Part 1—Correlation within subjects. BMJ. 1995;310:446. doi: 10.1136/bmj.310.6977.446. - DOI - PMC - PubMed

Publication types