. 2021 Oct;23(5):745-755.
doi: 10.1007/s11307-021-01605-0. Epub 2021 Apr 23.

Monitoring PSMA Responses to ADT in Prostate Cancer Patient-Derived Xenograft Mouse Models Using [18F]DCFPyL PET Imaging

Affiliations

Monitoring PSMA Responses to ADT in Prostate Cancer Patient-Derived Xenograft Mouse Models Using [18F]DCFPyL PET Imaging

Jyoti Roy et al. Mol Imaging Biol. 2021 Oct.

Abstract

Purpose: PSMA overexpression has been associated with aggressive prostate cancer (PCa). However, PSMA PET imaging has revealed highly variable changes in PSMA expression in response to ADT treatment ranging from increases to moderate decreases. To better understand these PSMA responses and potential relationship to progressive PCa, the PET imaging agent, [18F]DCFPyL, was used to assess changes in PSMA expression in response to ADT using genomically characterized LuCaP patient-derived xenograft mouse models (LuCaP-PDXs) which were found to be sensitive to ADT (LuCaP73 and LuCaP136;CS) or resistant (LuCaP167;CR).

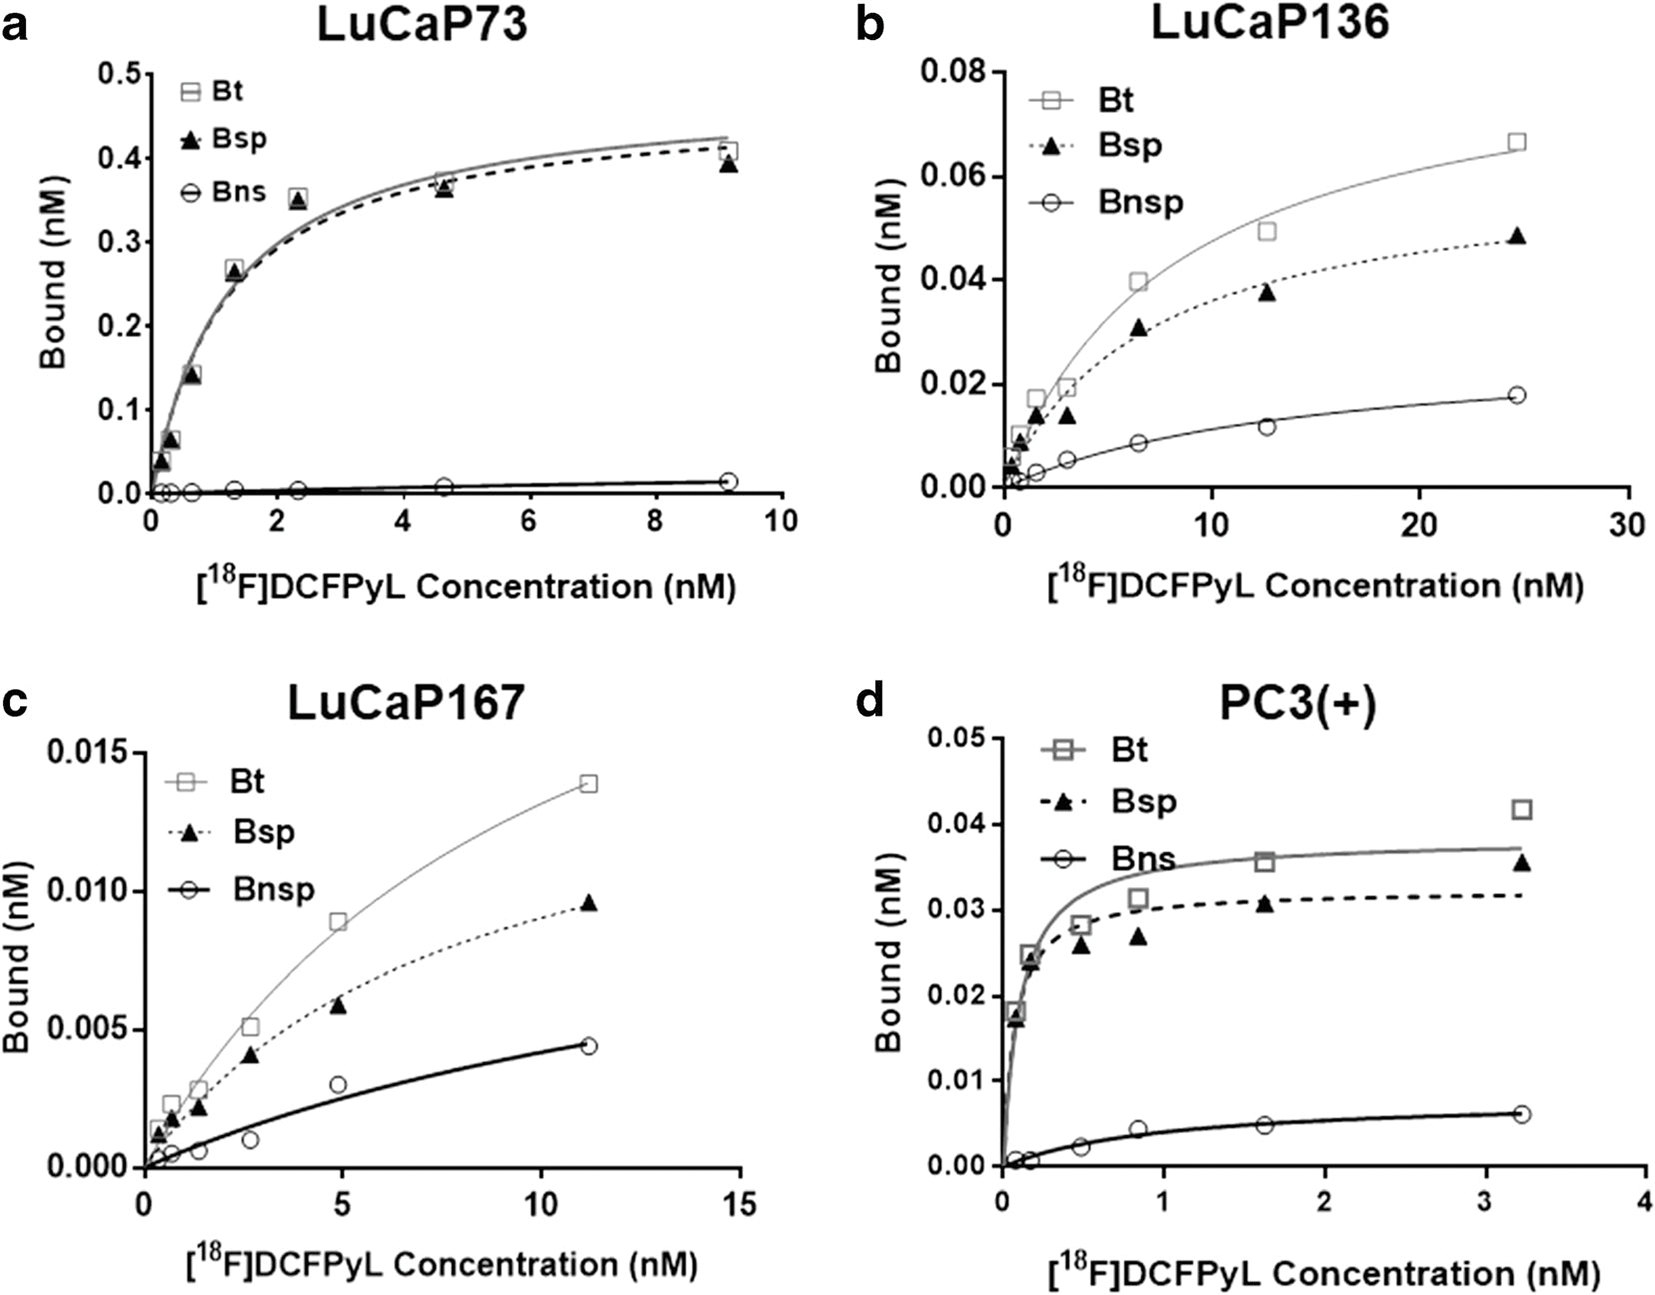
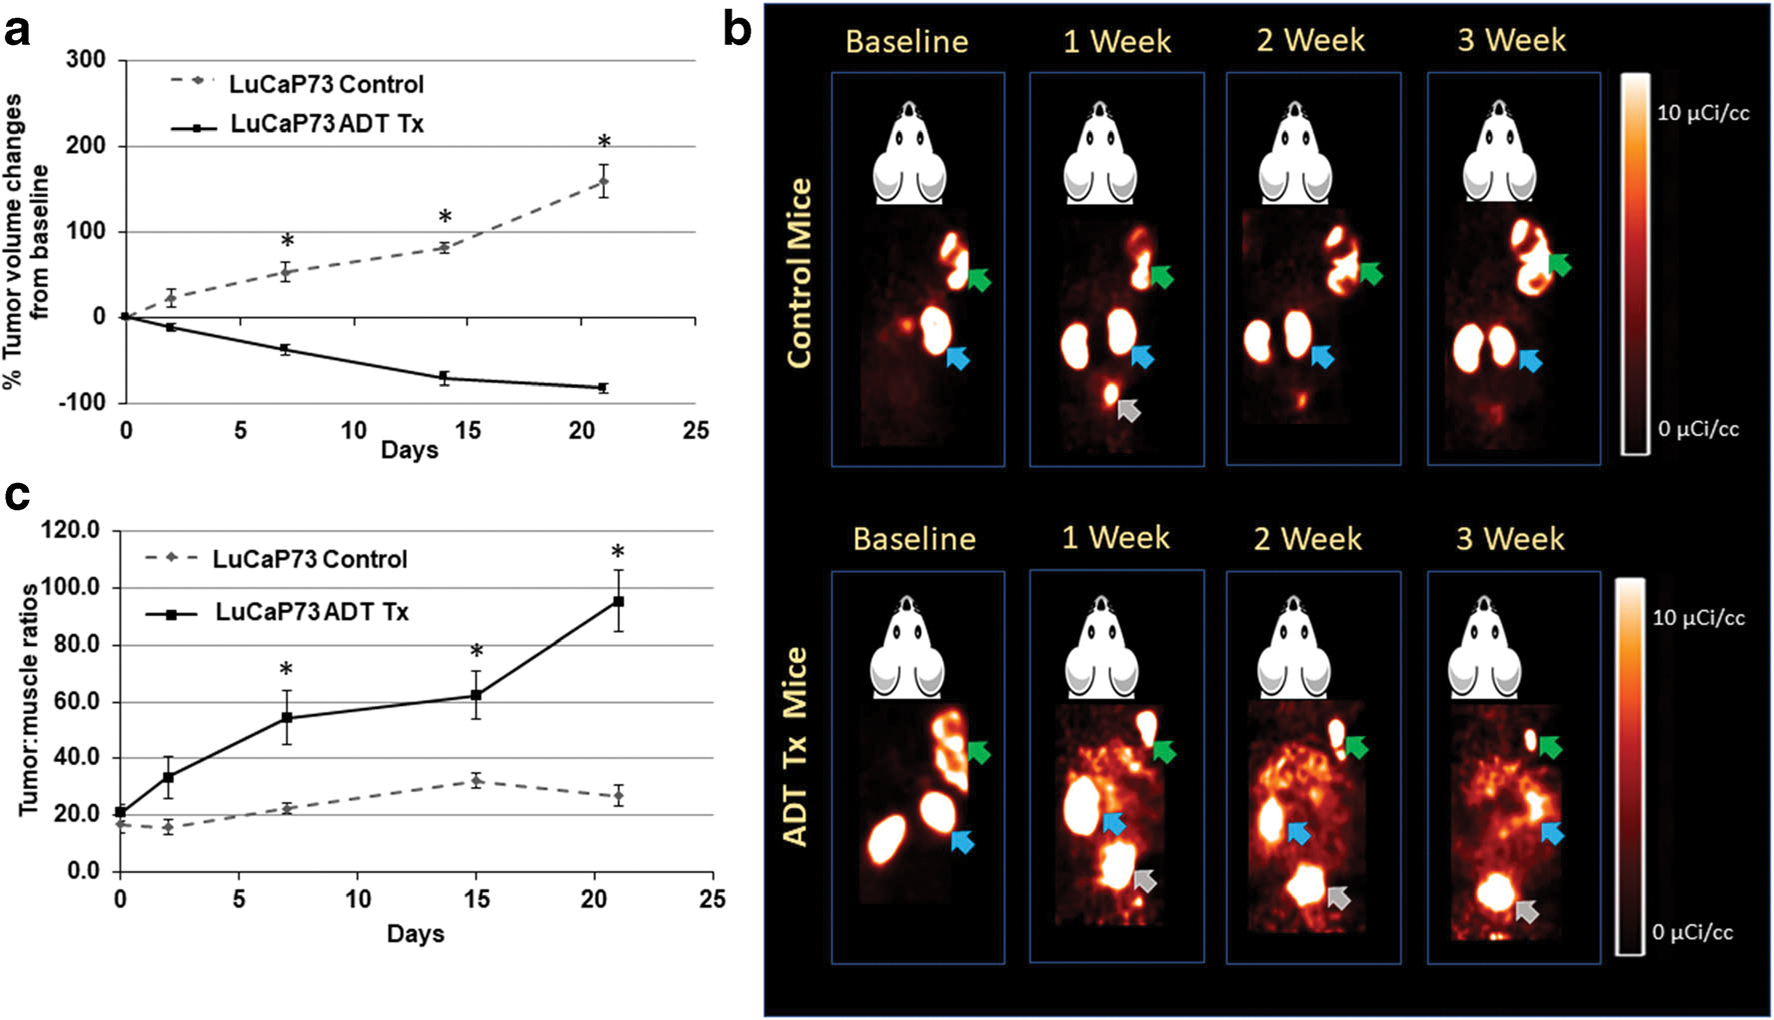
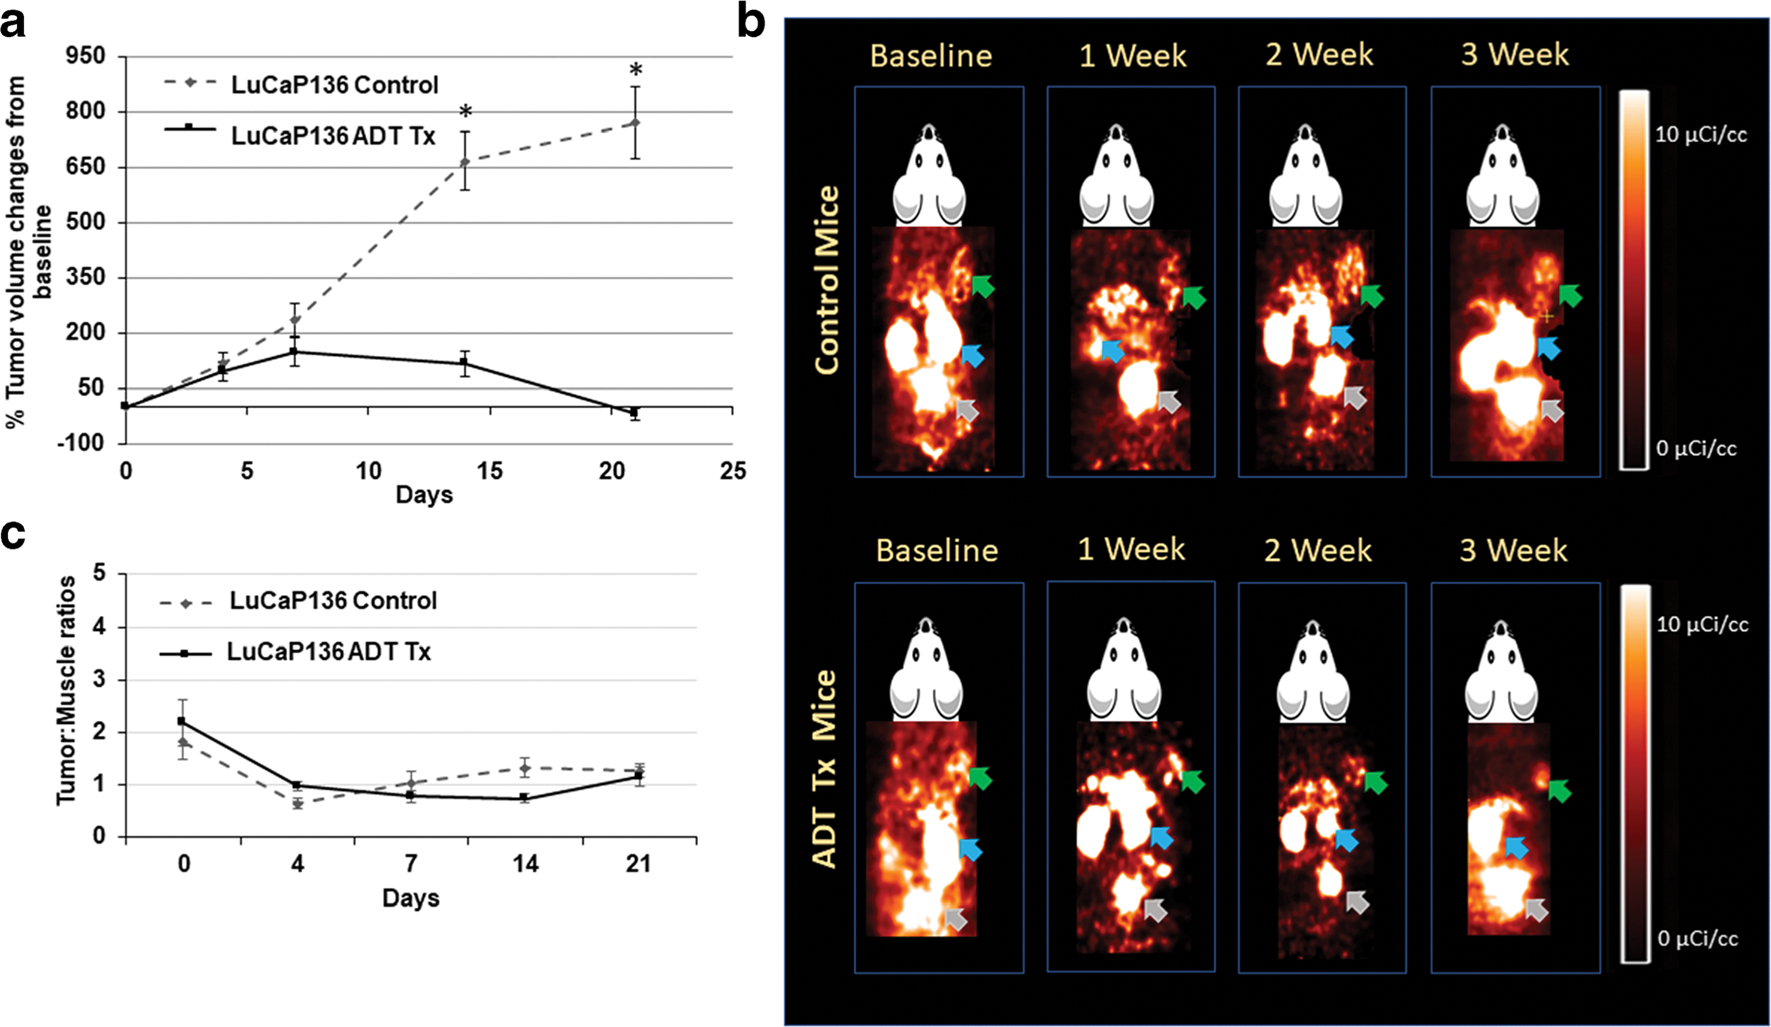
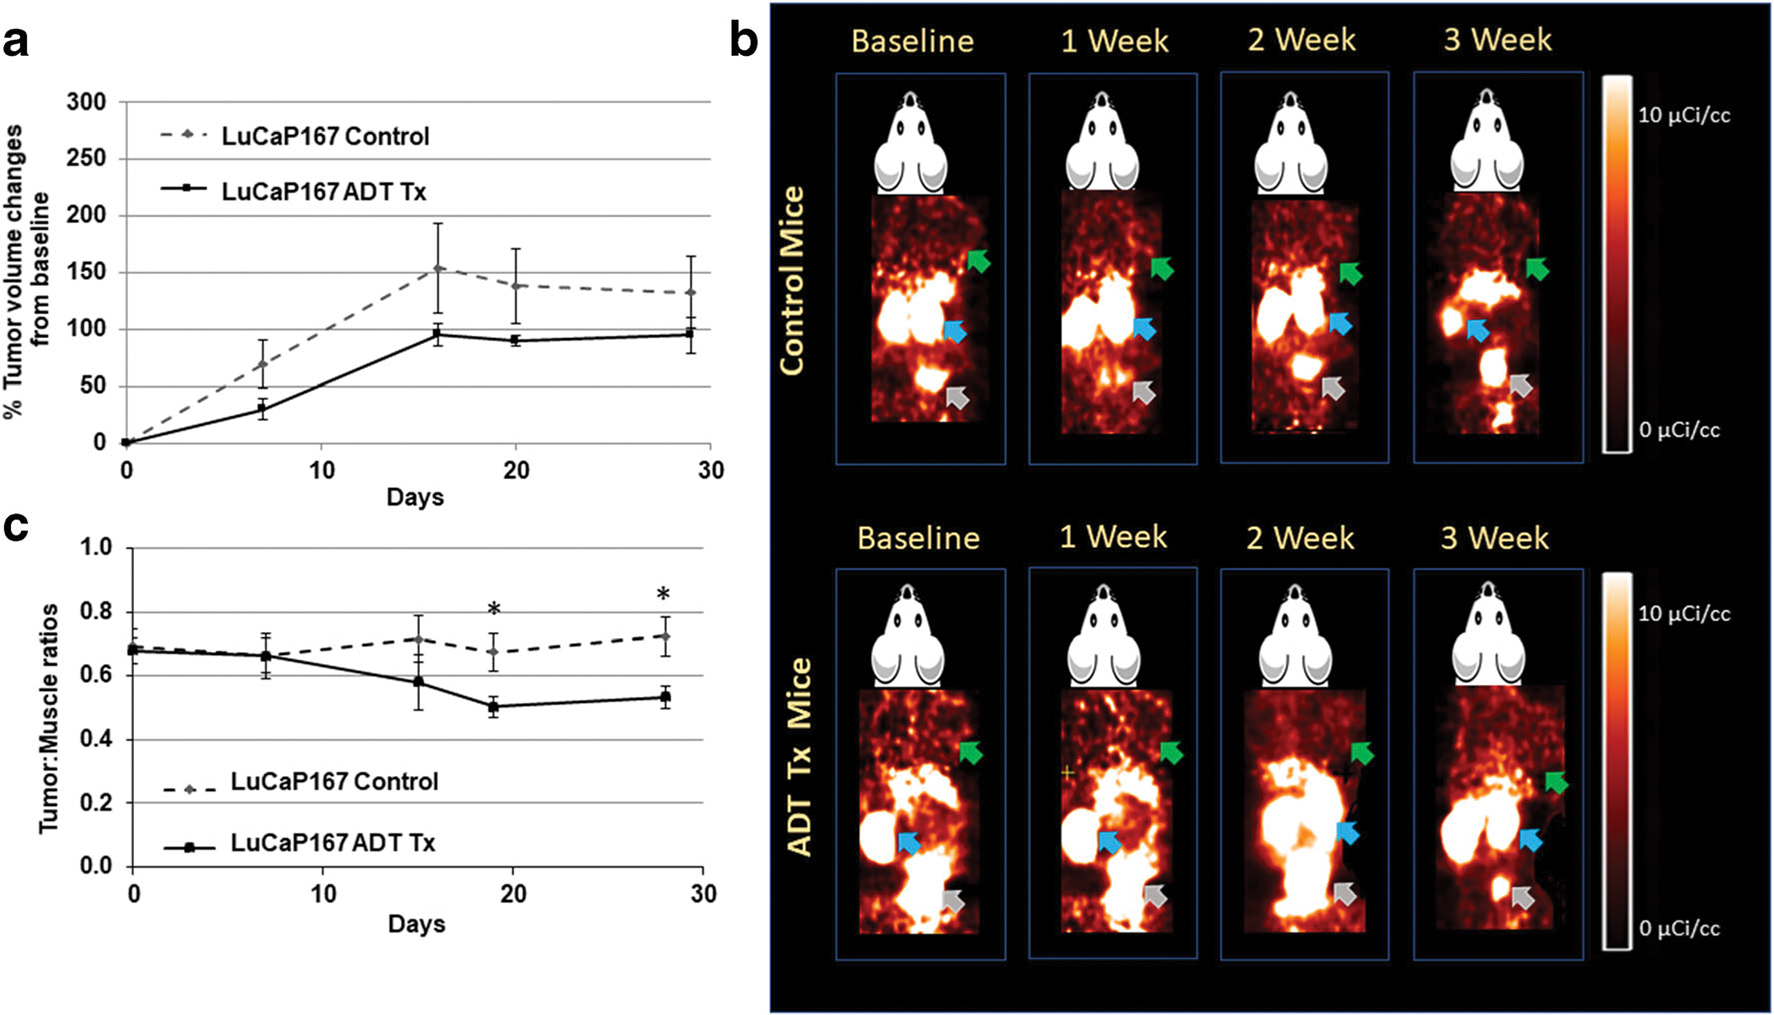
Methods: [18F]DCFPyL (2-(3-{1-carboxy-5-[(6-[18F]fluoro-pyridine-3-carbonyl)-amino]-pentyl}-ureido)-pentanedioic acid) was used to assess PSMA in vitro (saturation assays) in LuCaP tumor membrane homogenates and in vivo (imaging/biodistribution) in LuCaP-PDXs. Control and ADT-treated LuCaPs were imaged before ADT (0 days) and 2-, 7-, 14-, and 21-days post-ADT from which tumor:muscle ratios (T:Ms) were determined and concurrently tumor volumes were measured (caliper). After the 21-day imaging, biodistributions and histologic/genomic (PSMA, AR) analysis were done.

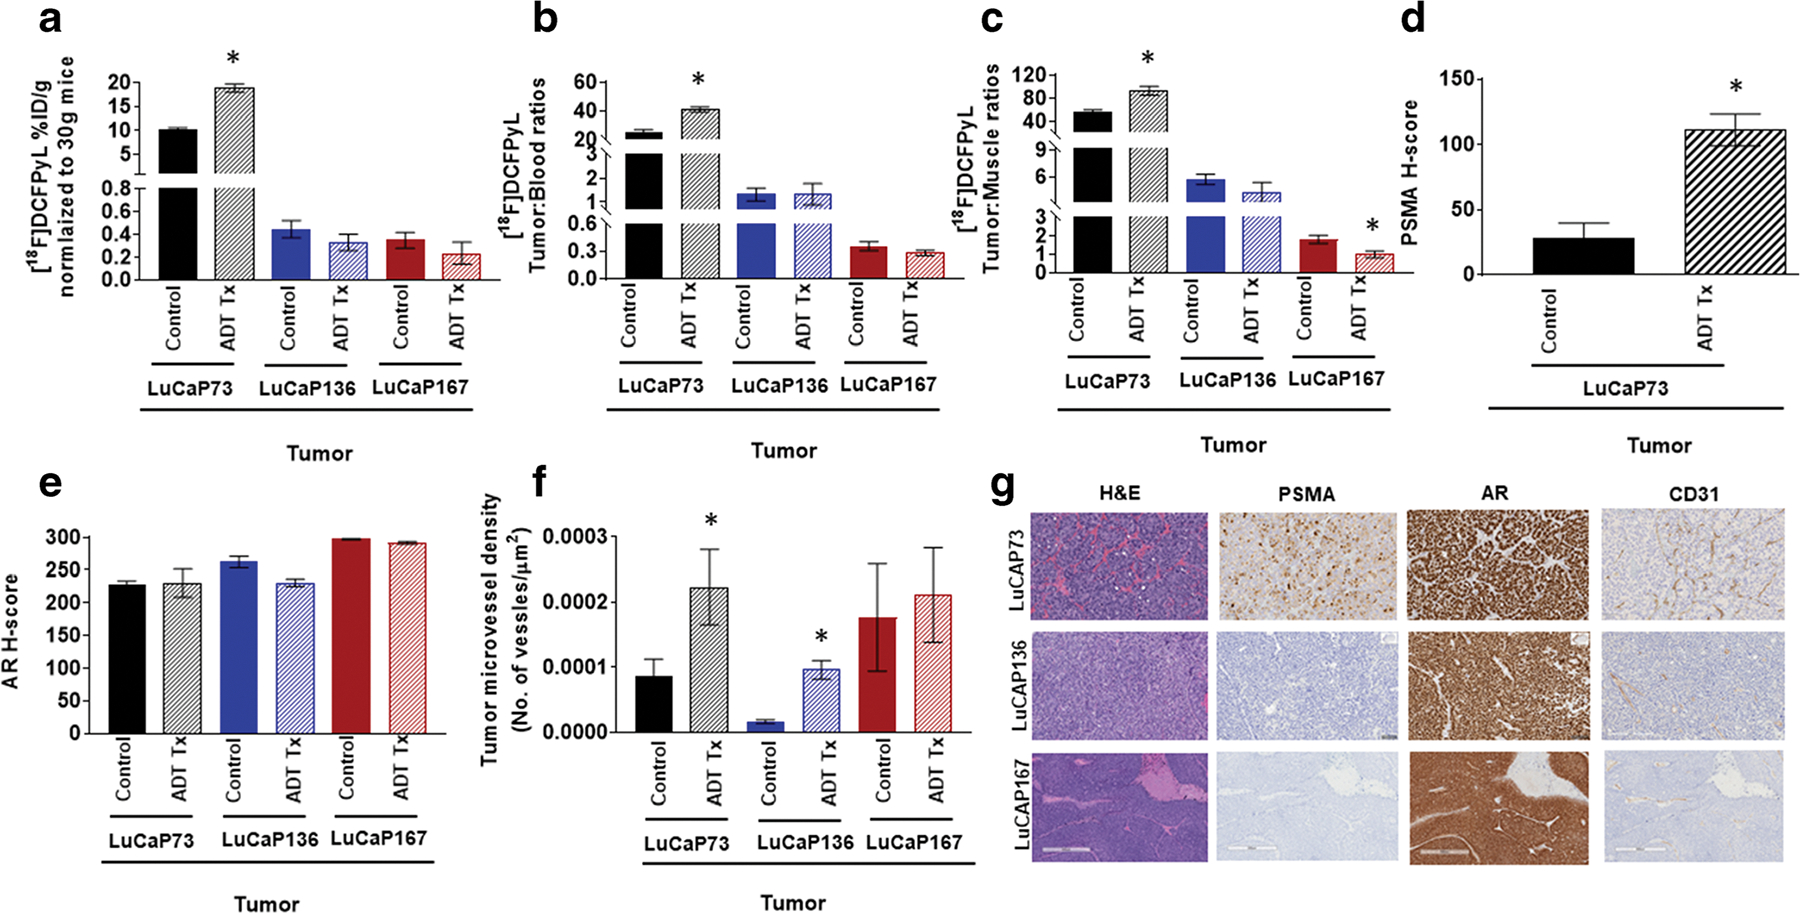
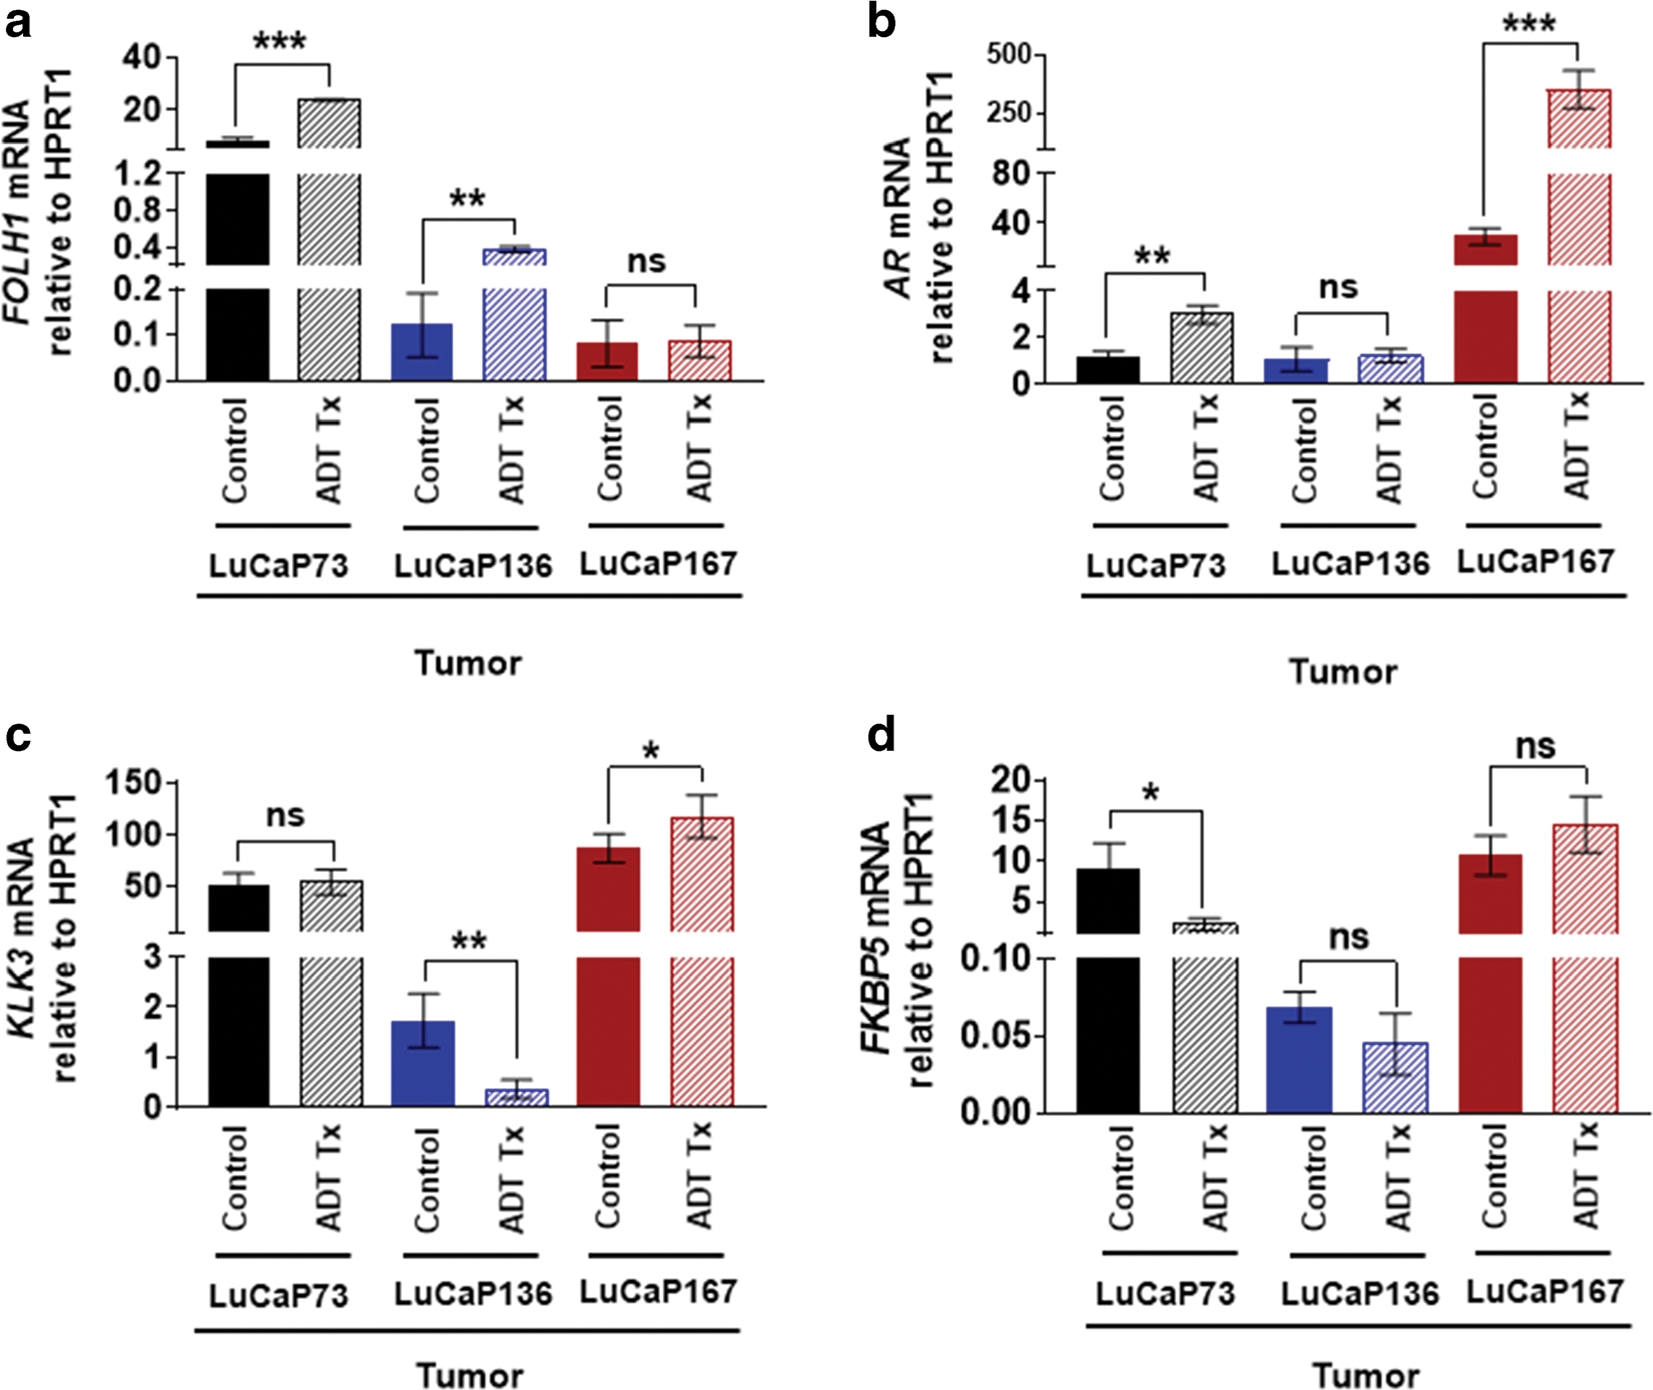
Results: [18F]DCFPyL exhibited high affinity for PSMA and distinguished different levels of PSMA in LuCaP tumors. Post-ADT CS LuCaP73 and LuCaP136 tumor volumes significantly decreased at day 7 or 14 respectively vs controls, whereas the CR LuCaP167 tumor volumes were minimally changed. [18F]DCFPyL imaging T:Ms were increased 3-5-fold in treated LuCaP73 tumors vs controls, while treated LuCaP136 T:Ms remained unchanged which was confirmed by day 21 biodistribution results. For treated LuCaP167, T:Ms were decreased (~ 45 %) vs controls but due to low T:M values (<2) may not be indicative of PSMA level changes. LuCaP73 tumor PSMA histologic/genomic results were comparable to imaging/biodistribution results, whereas the results for other tumor types varied.

Conclusion: Tumor responses to ADT varied from sensitive to resistant among these LuCaP PDXs, while only the high PSMA expressing LuCaP model exhibited an increase in PSMA levels in response to ADT. These models may be useful in understanding the clinical relevance of PSMA PET responses to ADT and potentially the relationship to disease progression as it may relate to the genomic signature.

Keywords: ADT therapy; Androgen deprivation therapy; LuCaP; PDX; PET imaging; PSMA; Prostate cancer.


Conflict of interest statement

Conflict of Interest

The authors declare that they have no conflict of interest.

Figures

Fig. 1
Fig. 1
Representative plots of in vitro saturation binding studies using tumor membrane preparations from LuCaP [LuCaP73 (a), LuCaP136 (b), and LuCaP167 (c) or PC3(+) [PC3 cells transfected with human PSMA(d)] xenografts. For each plot: Bt = bound total; Bnsp = bound non-specific; Bsp = bound specific (Bt-Bnsp=Bsp), n= 2 or 3.
Fig. 2
Fig. 2
a Comparison of % changes in tumor volumes from baseline in control and ADT-treated LuCaP73 tumor-bearing mice at baseline (0), 2, 7, 14, and 21 days (mean ± SE, n = 5–7 mice; *significant difference between groups, P < 0.05). b Representative [18F]DCFPyL PET images (60 min post-injection) in LuCaP73 control and ADT-treated tumor-bearing mouse over the course of therapy. Green, blue, and grey arrows indicate tumor, kidneys, and bladder respectively. c LuCaP73 tumor:muscle ratios calculated from PET image analysis in control and treated groups (mean tumor:muscle ratios ± SE, n = 5–7 mice; *significant difference between groups, P < 0.05).
Fig. 3
Fig. 3
a Comparison of % changes in tumor volumes from baseline in control and ADT-treated LuCaP136 tumor-bearing mice at baseline (0), 2, 7, 14, and 21 days (mean ± SE, n = 5–7 mice; *significant difference between groups, P < 0.05). b Representative [18F]DCFPyL PET images (60 min post-injection) in LuCaP136 control and ADT-treated tumor-bearing mouse over the course of therapy. Green, blue, and grey arrows indicate tumor, kidneys, and bladder respectively. c LuCaP136 tumor:muscle ratios calculated from PET image analysis in control and treated groups (mean tumor:muscle ratios ± SE, n = 5–7 mice; *significant difference between groups, P < 0.05).
Fig. 4
Fig. 4
a Comparison of % changes in tumor volumes from baseline in control and ADT-treated LuCaP167 tumor-bearing mice at baseline (0), 2, 7, 14, and 21 days (mean ± SE, n = 5–7 mice; *significant difference between groups, P < 0.05). b Representative [18F]DCFPyL PET images (60 min post-injection) in LuCaP167control and ADT-treated tumor-bearing mouse over the course of therapy. Green, blue, and grey arrows indicate tumor, kidneys, and bladder respectively. c LuCaP167 tumor:muscle ratios calculated from PET image analysis in control and treated groups (mean tumor:muscle ratios ± SE, n = 5–7 mice; *significant difference between groups, P < 0.05).
Fig. 5
Fig. 5
[18F]DCFPyL biodistribution (a), tumor to blood ratios (b; T:B), and tumor:muscle ratios (c; T:M) in control and ADT (degarelix) treated LuCaP73, LuCaP136, and LuCaP167 tumor-bearing mice. Biodistribution was performed at 60 min post [18F]DCFPyL injection. Each bar represents mean %ID/g ± SE (a), mean T:B± SE (b), or T:M ± SE (c); n = 5–7. (d)–(f) Quantitative histological analysis of PSMA (d, H-score), androgen receptor (e, AR, H-score), and CD31 (f, tumor microvessel density). Each bar in (d) and (e) represents mean H-score ± SD. Each bar in (f) represents the number of vessel/μm2 ± SD. (g) Representative H&E and IHC staining of tumor sections showing expression of PSMA, AR, and CD31; *significant difference in the control group versus the treated group (P < 0.05).
Fig. 6
Fig. 6
RT-qPCR analysis of FOLH1 (a), AR (b), KLK3 (c), and FKBP5 (d) in LuCaP73, LuCaP136, and LuCaP167 PDXs obtained from control and ADT (degarelix) treated mice; n = 3–4/group; ns, not significant; *P < 0.05; **P < 0.01; ***P < 0.001. All the mRNA values were normalized to hypoxanthine-guanine phosphoribosyltransferase 1 (HPRT1).

References

    1. Rawla P (2019) Epidemiology of Prostate Cancer. World J Oncol 10:63–89 - PMC - PubMed
    1. Bravaccini S, Puccetti M, Bocchini M, Ravaioli S, Celli M, Scarpi E, de Giorgi U, Tumedei MM, Raulli G, Cardinale L, Paganelli G (2018) PSMA expression: a potential ally for the pathologist in prostate cancer diagnosis. Sci Rep 8:4254. - PMC - PubMed
    1. Chang SS (2004) Overview of prostate-specific membrane antigen. Rev Urol 6(Suppl 10):S13–S18 - PMC - PubMed
    1. Bouchelouche K, Turkbey B, Choyke PL (2016) PSMA PET and Radionuclide Therapy in Prostate Cancer. Semin Nucl Med 46:522–535 - PMC - PubMed
    1. Ghosh A, Heston WD (2004) Tumor target prostate specific membrane antigen (PSMA) and its regulation in prostate cancer. J Cell Biochem 91:528–539 - PubMed

Publication types

MeSH terms

Substances