

Hospital-Level Variation in Death for Critically Ill Patients with COVID-19
- PMID: 33891529
- PMCID: PMC8480242
- DOI: 10.1164/rccm.202012-4547OC
Hospital-Level Variation in Death for Critically Ill Patients with COVID-19
Abstract
Rationale: Variation in hospital mortality has been described for coronavirus disease 2019 (COVID-19), but the factors that explain these differences remain unclear.
Objective: Our objective was to utilize a large, nationally representative dataset of critically ill adults with COVID-19 to determine which factors explain mortality variability.
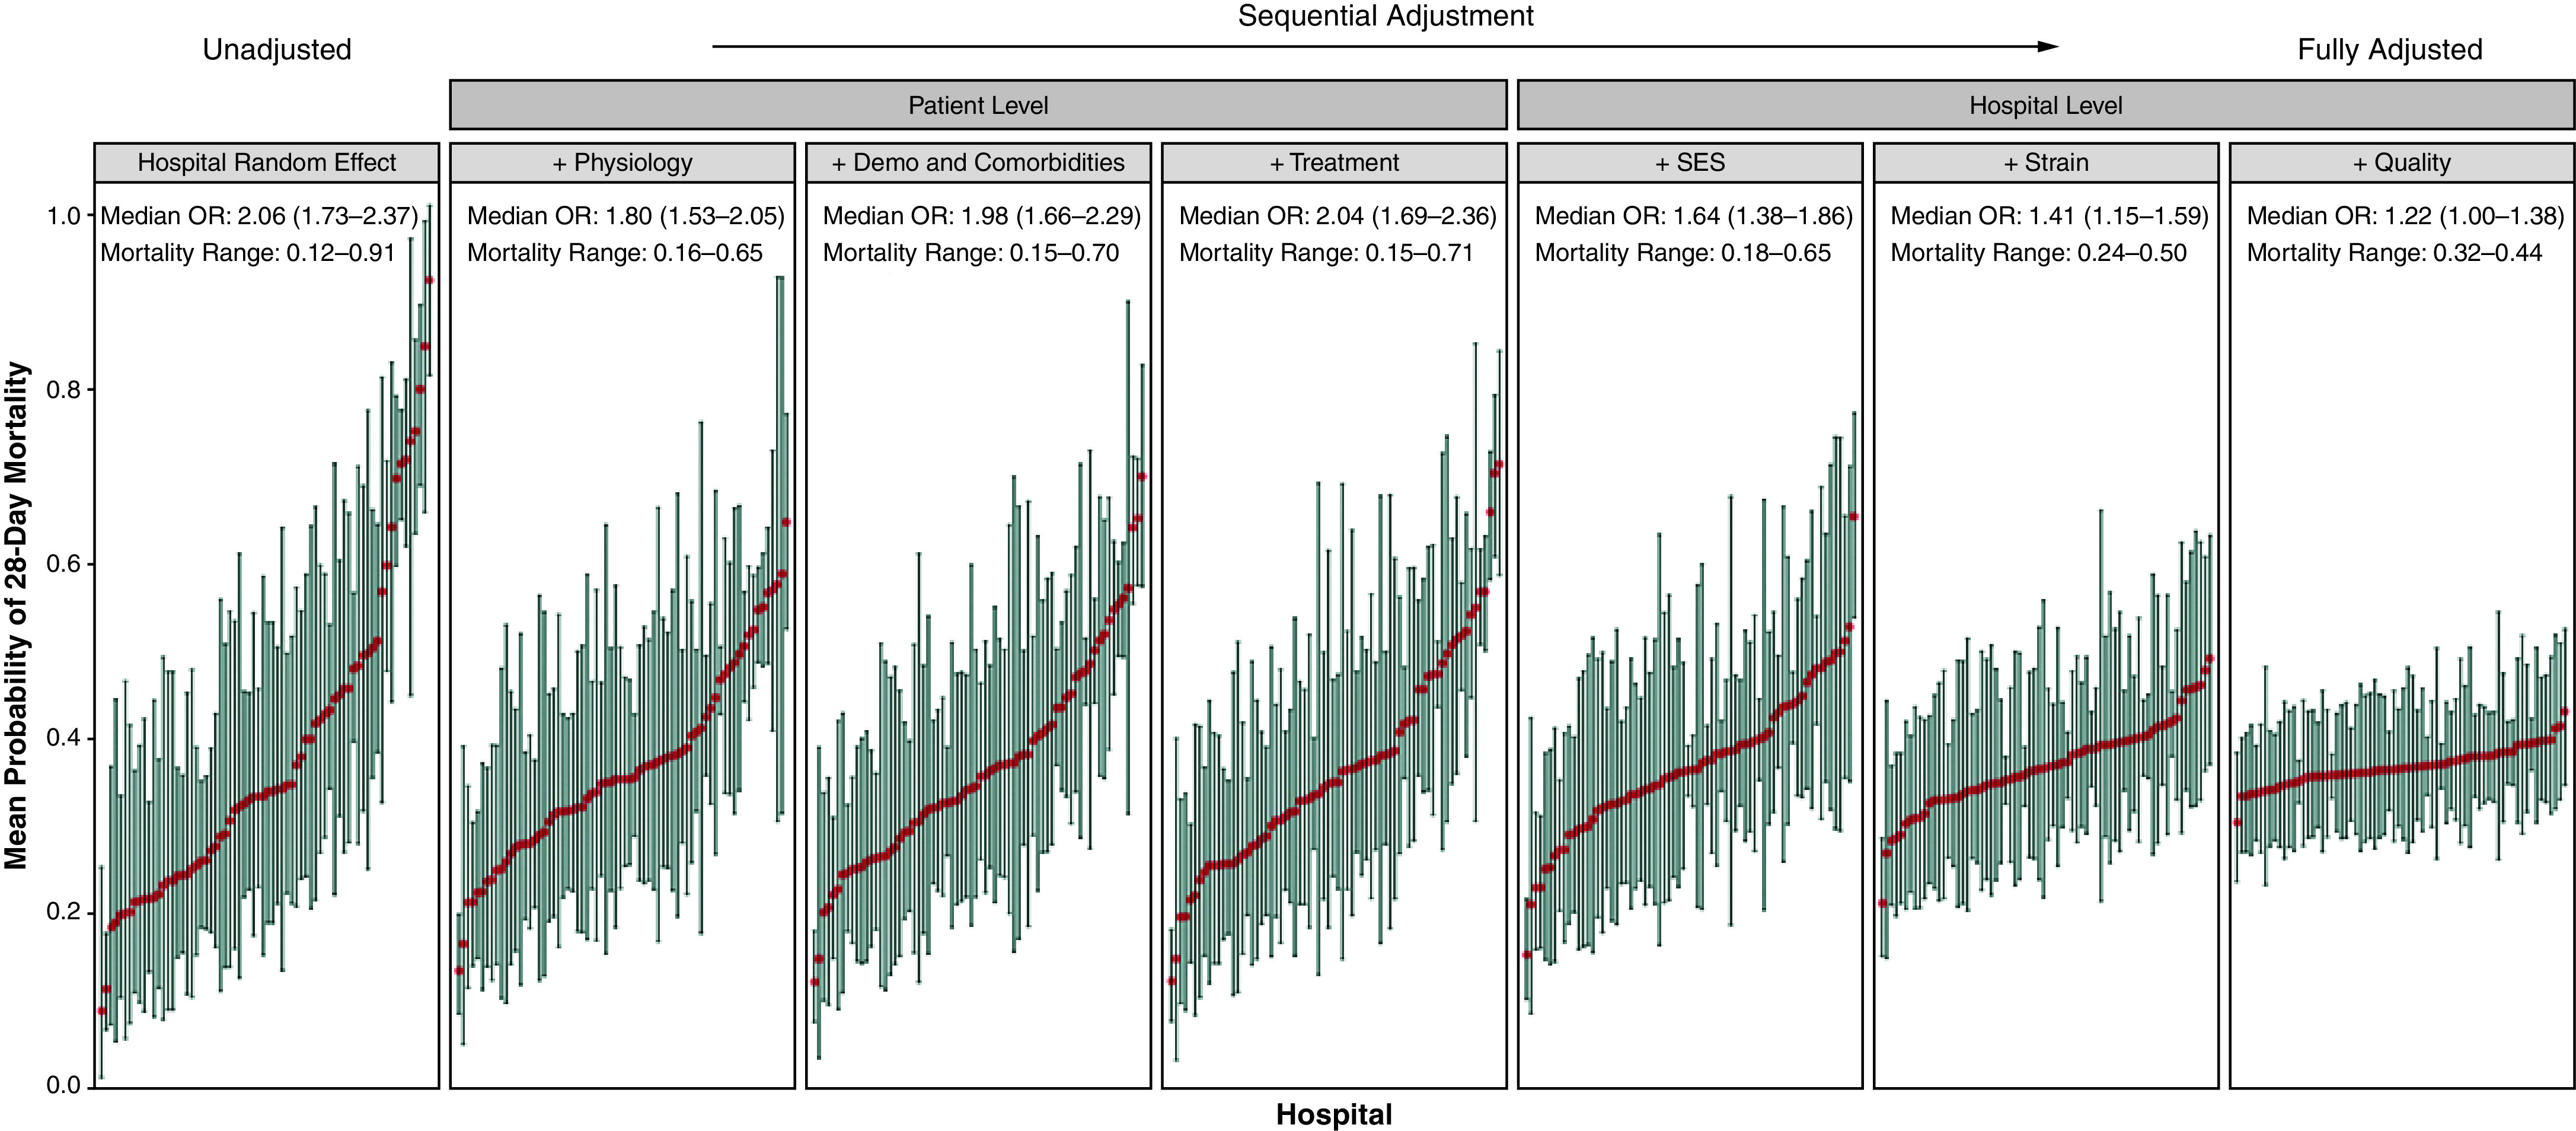
Methods: In this multicenter cohort study, we examined adults hospitalized in intensive care units with COVID-19 at 70 United States hospitals between March and June 2020. The primary outcome was 28-day mortality. We examined patient-level and hospital-level variables. Mixed-effects logistic regression was used to identify factors associated with interhospital variation. The median odds ratio (OR) was calculated to compare outcomes in higher- vs. lower-mortality hospitals. A gradient boosted machine algorithm was developed for individual-level mortality models.
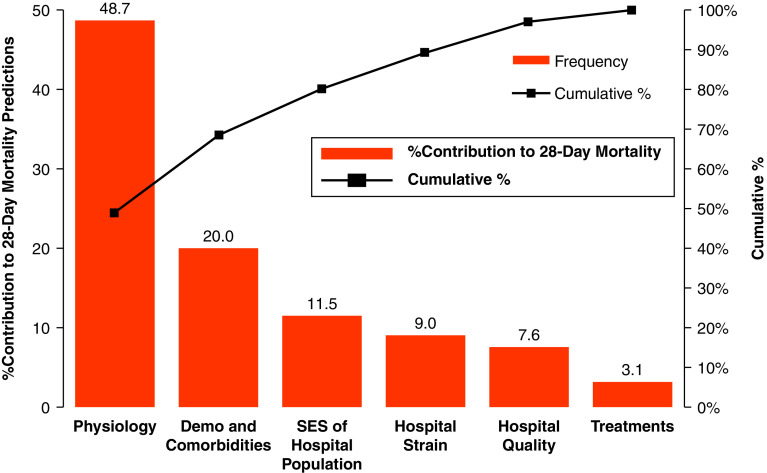
Measurements and main results: A total of 4,019 patients were included, 1537 (38%) of whom died by 28 days. Mortality varied considerably across hospitals (0-82%). After adjustment for patient- and hospital-level domains, interhospital variation was attenuated (OR decline from 2.06 [95% CI, 1.73-2.37] to 1.22 [95% CI, 1.00-1.38]), with the greatest changes occurring with adjustment for acute physiology, socioeconomic status, and strain. For individual patients, the relative contribution of each domain to mortality risk was: acute physiology (49%), demographics and comorbidities (20%), socioeconomic status (12%), strain (9%), hospital quality (8%), and treatments (3%).
Conclusion: There is considerable interhospital variation in mortality for critically ill patients with COVID-19, which is mostly explained by hospital-level socioeconomic status, strain, and acute physiologic differences. Individual mortality is driven mostly by patient-level factors. This article is open access and distributed under the terms of the Creative Commons Attribution Non-Commercial No Derivatives License 4.0 (http://creativecommons.org/licenses/by-nc-nd/4.0/).
Keywords: COVID-19; Critical Care; Health Disparities; Intensive Care Unit.
Figures
Comment in
-
Pinpointing the Cause of Variation in Mortality in COVID-19.Am J Respir Crit Care Med. 2021 Aug 15;204(4):381-382. doi: 10.1164/rccm.202105-1244ED. Am J Respir Crit Care Med. 2021. PMID: 34139143 Free PMC article. No abstract available.
References
-
- COVID data tracker. Atlanta, GA: CDC; 2021https://www.cdc.gov/covid-data-tracker/#cases
-
- Severe outcomes among patients with coronavirus disease 2019 (COVID-19): United States, February 12–March 16, 2020. Atlanta, GA: CDC; 2020https://www.cdc.gov/mmwr/volumes/69/wr/mm6912e2.htm - PMC - PubMed
-
- Berlin DA, Gulick RM, Martinez FJ. Severe COVID-19. N Engl J Med . 2020;383:2451–2460. - PubMed
-
- Kahn JM, Goss CH, Heagerty PJ, Kramer AA, O’Brien CR, Rubenfeld GD. Hospital volume and the outcomes of mechanical ventilation. N Engl J Med . 2006;355:41–50. - PubMed
Publication types
MeSH terms
Grants and funding
LinkOut - more resources
Full Text Sources
Medical
