. 2021 May 11;54(5):1083-1095.e7.
doi: 10.1016/j.immuni.2021.04.003. Epub 2021 Apr 13.

Immune dysregulation and autoreactivity correlate with disease severity in SARS-CoV-2-associated multisystem inflammatory syndrome in children

Affiliations

Immune dysregulation and autoreactivity correlate with disease severity in SARS-CoV-2-associated multisystem inflammatory syndrome in children

Anjali Ramaswamy et al. Immunity. .

Abstract

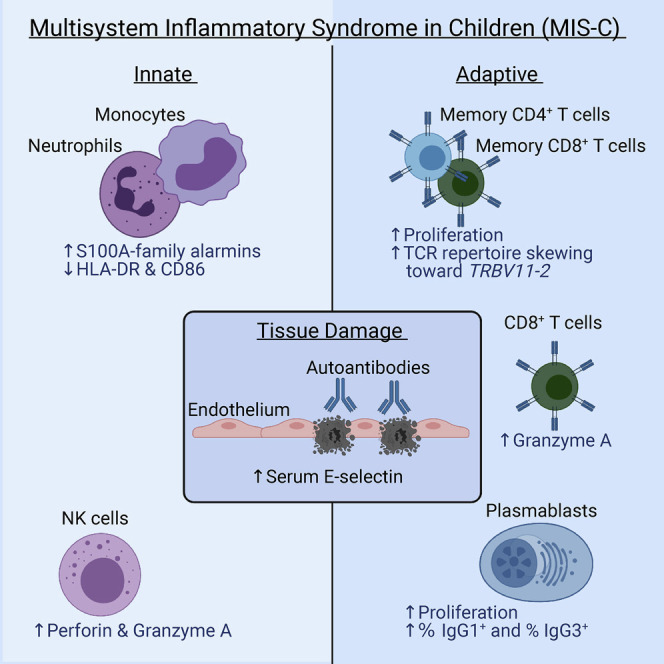
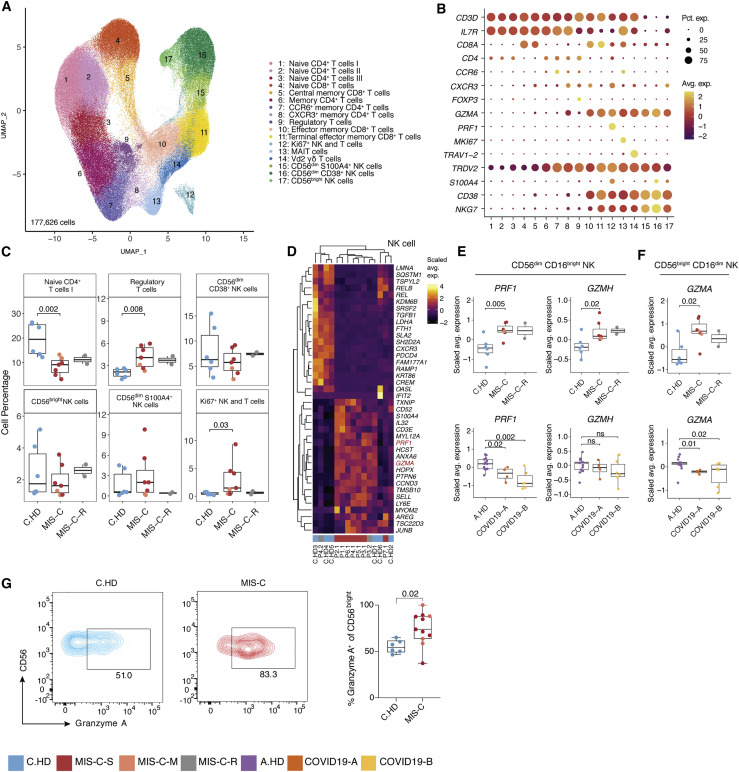
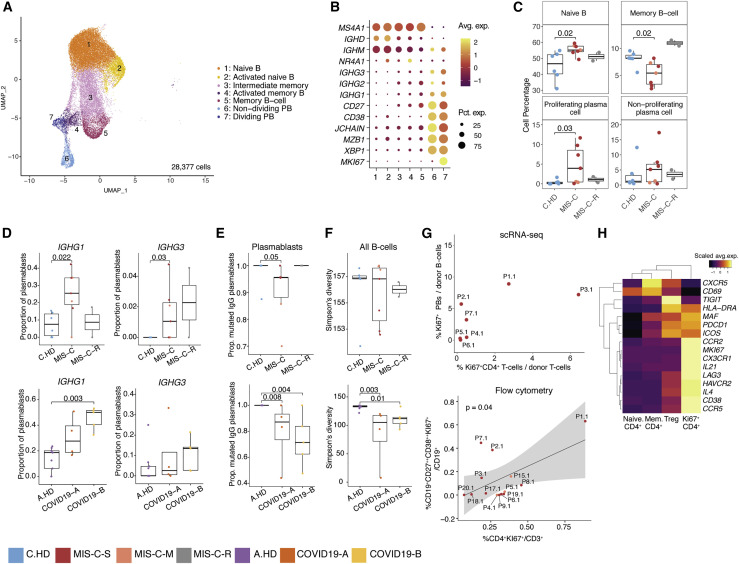
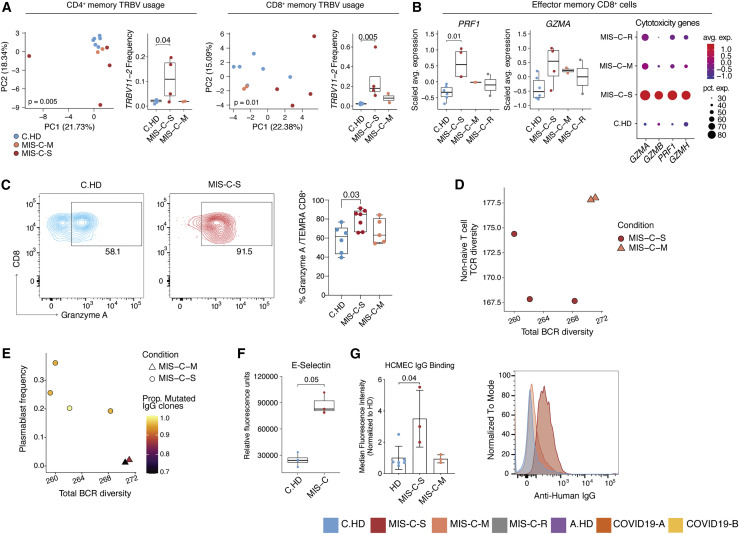
Multisystem inflammatory syndrome in children (MIS-C) is a life-threatening post-infectious complication occurring unpredictably weeks after mild or asymptomatic SARS-CoV-2 infection. We profiled MIS-C, adult COVID-19, and healthy pediatric and adult individuals using single-cell RNA sequencing, flow cytometry, antigen receptor repertoire analysis, and unbiased serum proteomics, which collectively identified a signature in MIS-C patients that correlated with disease severity. Despite having no evidence of active infection, MIS-C patients had elevated S100A-family alarmins and decreased antigen presentation signatures, indicative of myeloid dysfunction. MIS-C patients showed elevated expression of cytotoxicity genes in NK and CD8+ T cells and expansion of specific IgG-expressing plasmablasts. Clinically severe MIS-C patients displayed skewed memory T cell TCR repertoires and autoimmunity characterized by endothelium-reactive IgG. The alarmin, cytotoxicity, TCR repertoire, and plasmablast signatures we defined have potential for application in the clinic to better diagnose and potentially predict disease severity early in the course of MIS-C.

Keywords: MIS-C; SARS-CoV-2; TRBV11-2; alarmins; cytotoxicity; inflammation; pediatric; plasmablasts.


Conflict of interest statement

Declaration of interests D.A.H. has received research funding from Bristol-Myers Squibb, Novartis, Sanofi, and Genentech. He has been a consultant for Bayer Pharmaceuticals, Bristol Myers Squibb, Compass Therapeutics, EMD Serono, Genentech, Juno Therapeutics, Novartis Pharmaceuticals, Proclara Biosciences, Sage Therapeutics, and Sanofi Genzyme. Further information regarding funding is available on: https://openpaymentsdata.cms.gov/physician/166753/general-payments. N.K. reports personal fees from Boehringer Ingelheim, Third Rock, Pliant, Samumed, NuMedii, Indalo, Theravance, LifeMax, Three Lake Partners, RohBar in the last 36 months, and Equity in Pliant. N.K. is also a recipient of a grant from Veracyte and non-financial support from Miragen. All outside the submitted work; In addition, N.K. has patents on New Therapies in Pulmonary Fibrosis and ARDS (unlicensed) and Peripheral Blood Gene Expression as biomarkers in IPF (licensed to biotech). S.H.K. receives consulting fees from Northrop Grumman. K.B.H. receives consulting fees from Prellis Biologics. B.S. is a former SomaLogic, Inc. (Boulder, CO, USA) employee and a company shareholder. All other authors declared that they have no competing interests.

Figures

None
Graphical abstract
Figure 1
Figure 1
Clinical features of moderate and severe MIS-C (A) Yale New Haven Hospital (YNHH) timeline of total daily adult COVID-19 hospitalizations (blue) and MIS-C cumulative cases (red). (B) Clinical time course of moderate and severe patients showing symptom onset and treatments relative to hospital admission (Day 0). (C) PCA biplot for clinical parameters, where available for MIS-C patients. P13, P7, and P21 were excluded due to unavailable measurements for troponin, BNP, and ALC, respectively. (D) Clinical laboratory data for the indicated analyte. Normal range represented by gray shading. BNP, B-type natriuretic peptide; CRP, C-reactive protein; ALC, absolute lymphocyte count; AST, aspartate aminotransferase; ALT, alanine aminotransferase; WBC, white blood cells; CKD, chronic kidney disease; CHF, chronic heart failure.
Figure 2
Figure 2
Altered MIS-C immune cell subsets with no evidence of active viral or bacterial infection (A) Peripheral blood mononuclear cell (PBMC) UMAP of integrated samples from pediatric healthy donors, adult healthy donors, MIS-C patients, and COVID-19 patients. (B) Dot plots of key PBMC cell lineage markers. (C) Distributions of peripheral blood cell frequencies across pediatric cohorts, based on cell types inferred from scRNA-seq. A non-parametric two-sided Wilcoxon test was used to assess statistical significance between the C.HD and MIS-C groups. (D) Donor distributions of viral and bacterial scores in monocytes and neutrophils. Module scores are calculated for each cell and averaged per donor.
Figure 3
Figure 3
Innate inflammation in MIS-C with elevated myeloid alarmins in the S100A family (A) Myeloid cell sub-clustering UMAP. (B) Key markers delineating myeloid clusters. (C) Heatmap representing top 20 up- and downregulated differentially expressed genes in monocytes between MIS-C and C.HD. Scale bar represents the scaled average expression of markers. (D) A module score for S100A8, S100A9, and S100A12 is computed across pediatric donors and adult healthy donors in all monocytes and neutrophils depicted in UMAP. Statistical significance between cohorts is computed using a two-sided non-parametric Wilcoxon test. (E) HLA class II score including HLA-DP, DQ, and DR molecules is computed across adult and pediatric donors as above, and CD86 expression depicted across pediatric and adult donors in monocytes. Statistical significance was assessed as in (D). (F) Flow cytometric validation of key scRNA-seq data in gated CD14+ monocytes stained for S100A9, HLA-DR, and CD86 in C.HD (n = 6) and MIS-C (n = 10). Representative plots depict donor closest to the mean of the cohort. Statistical significance was assessed using a two-sided unpaired t-test. (G) Sepsis-associated monocyte module score computed in classical monocytes across pediatric and adult cohorts. Statistical significance was assessed as in (D). (H) Volcano plot showing differentially up- and downregulated serum proteins between MIS-C (n = 3) and pediatric healthy donors (n = 4). Molecule annotations are color-coded and genes of interest are labeled in black text. IL-1RN, an upregulated protein in MIS-C, likely corresponds to anakinra treatment. Significance of enrichment is calculated using Fisher’s exact test. (I) Pathway analysis of differential proteins in serum analysis between MIS-C (n = 3) and C.HD (n = 4).
Figure 4
Figure 4
Increased cytotoxicity signatures in NK cells from MIS-C patients (A) T cell sub-clustering UMAP. (B) Dot plot depicting key T and NK cell markers for cluster delineation. (C) T and NK compositions across pediatric cohorts. A two-sided Wilcoxon test was calculated for statistical significance between cohorts. (D) Heatmap representing top 20 up- and downregulated differentially expressed genes in NK cells between MIS-C and C.HD. Highlighted are genes associated with cytotoxicity. Scale bar represents the scaled average expression of markers. (E and F) PRF1, GZMA, and GZMH expression in NK cell subsets in MIS-C compared to C.HD and MIS-C-R donors. Scaled average expression was calculated for each donor. Statistical significance was computed as in (C). (G) Flow cytometric confirmation of key scRNA-seq data. Quantification of granzyme A in CD56bright NK cells stained for Granzyme A in MIS-C (n = 11) and C.HD (n = 6). Statistical significance was assessed using a two-sided unpaired t-test.
Figure 5
Figure 5
MIS-C patients have increased proliferating plasmablasts harboring IgG1 and IgG3 and a coordinated CD4+ T cell response (A) B cell sub-clustering UMAP. (B) Dot plots for key B cell markers delineating naive, memory, and plasmablast subsets. (C) Distributions of B cell frequencies within total B cells across donors. Two-sided Wilcoxon rank sum tests were used to calculate significance. (D) IGHG1 and IGHG3 isotype frequencies as a proportion of plasmablasts (proliferating and non-proliferating) are depicted across donors. Statistical significance was calculated as in (C). (E) Proportion mutated IGHG clones in plasmablasts. Statistical significance was calculated as in (C). (F) Simpson’s diversity in all B cells computed across cohorts in pediatric cohorts (top) and adult cohorts (bottom). Significance calculated as above. Statistical significance was calculated as in (C). (G) (Top): Percentage dividing plasmablasts/total B cells versus percentage Ki67+CD4+ cells/total T cells within the MIS-C cohort using scRNA-seq. Ki67+ CD4+ cells defined as CD4+ cells within the Ki67+ NK and T cell cluster (see Figure 4A). (Bottom): Correlation of dividing plasmablasts (CD272+CD382+Ki67+) among CD19+ B cells and Ki67+ CD4+ T cells among CD3+ T cells assessed by flow cytometry. Statistical significance calculated by linear regression. 95% confidence interval is shown in gray shading. (H) Heatmap showing differential gene expression across four subsets of CD4+ T cells, comprising samples from the MIS-C scRNA-seq cohort. Scale bar represents the scaled average expression of markers.
Figure 6
Figure 6
Distinct features of severe versus moderate MIS-C (A) PCA of TRBV usage in CD4+ and CD8+ memory cells, along with frequency of TRBV11-2 usage, in the pediatric cohort. Statistical significance for PCA calculated by permutation test, and by one-sided Wilcoxon test for TRBV11-2 frequency comparisons. (B) PRF1 and GZMA expression in effector memory CD8+ T cells along with dot plot depicting relative average expression and percent expression for four cytotoxicity genes (right). Two-sided Wilcoxon rank sum tests were used to calculate significance. (C) Flow cytometric evaluation of Granzyme A in TEMRA CD8+ compartment in C.HD (n = 6), MIS-C-S (n = 7), and MIS-C-M (n = 5) patients. Statistical significance was assessed using an ordinary one-way ANOVA test. (D) Correlation between BCR diversity and TCR diversity relating to combined Ki67+ and memory CD4+ T cells. P7.1 was excluded from TCR analysis due to low cell numbers (see STAR Methods). (E) B cell diversity, plasmablast frequency, and proportion of mutated IGHG within MIS-C cohort. (F) Serum E-selectin in pediatric healthy and MIS-C donors. Statistical significance was calculated as in (B). (G) Median fluorescence intensity (normalized to average HD) of serum IgG binding to cultured human cardiac microvascular endothelial cells (HCMEC) by flow cytometry (left). A non-parametric two-sided Wilcoxon rank sum test was used to calculate significance. Error bars represent mean with SD. MIS-C-S (acute n = 3; P1-3); MIS-C-M (acute n = 2; P4-5 and recovered n = 1; P11); and HD (n = 6; 1 C.HD and 5 A.HD). Representative histogram of a patient representing the median of the MIS-C-S cohort and sampled prior to IVIG treatment (right).

Update of

References

    1. Aibar S., González-Blas C.B., Moerman T., Huynh-Thu V.A., Imrichova H., Hulselmans G., Rambow F., Marine J.C., Geurts P., Aerts J., et al. SCENIC: single-cell regulatory network inference and clustering. Nat. Methods. 2017;14:1083–1086. - PMC - PubMed
    1. Aran D., Looney A.P., Liu L., Wu E., Fong V., Hsu A., Chak S., Naikawadi R.P., Wolters P.J., Abate A.R., et al. Reference-based analysis of lung single-cell sequencing reveals a transitional profibrotic macrophage. Nat. Immunol. 2019;20:163–172. - PMC - PubMed
    1. Balázs Z., Tombácz D., Szűcs A., Csabai Z., Megyeri K., Petrov A.N., Snyder M., Boldogkői Z. Long-Read Sequencing of Human Cytomegalovirus Transcriptome Reveals RNA Isoforms Carrying Distinct Coding Potentials. Sci. Rep. 2017;7:15989. - PMC - PubMed
    1. Benjamini Y., Hochberg Y. Controlling the False Discovery Rate - a Practical and Powerful Approach to Multiple Testing. J. R. Stat. Soc. Series B Stat. Methodol. 1995;57(1):289–300.
    1. Bernardes J.P., Mishra N., Tran F., Bahmer T., Best L., Blasé J.I., Bordoni D., Franzenburg J., Geisen U., Josephs-Spaulding J., et al. Longitudinal Multi-omics Analyses Identify Responses of Megakaryocytes, Erythroid Cells, and Plasmablasts as Hallmarks of Severe COVID-19. Immunity. 2020;53(6):1296–1314 e9. - PMC - PubMed

Publication types

MeSH terms

Supplementary concepts