. 2021 Jun 21;31(12):2550-2560.e5.
doi: 10.1016/j.cub.2021.03.094. Epub 2021 Apr 22.

EPHA2-dependent outcompetition of KRASG12D mutant cells by wild-type neighbors in the adult pancreas

Affiliations

EPHA2-dependent outcompetition of KRASG12D mutant cells by wild-type neighbors in the adult pancreas

William Hill et al. Curr Biol. .

Abstract

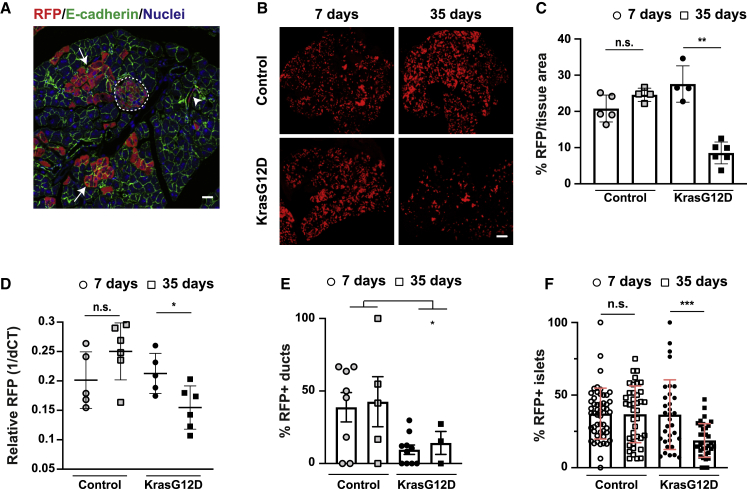
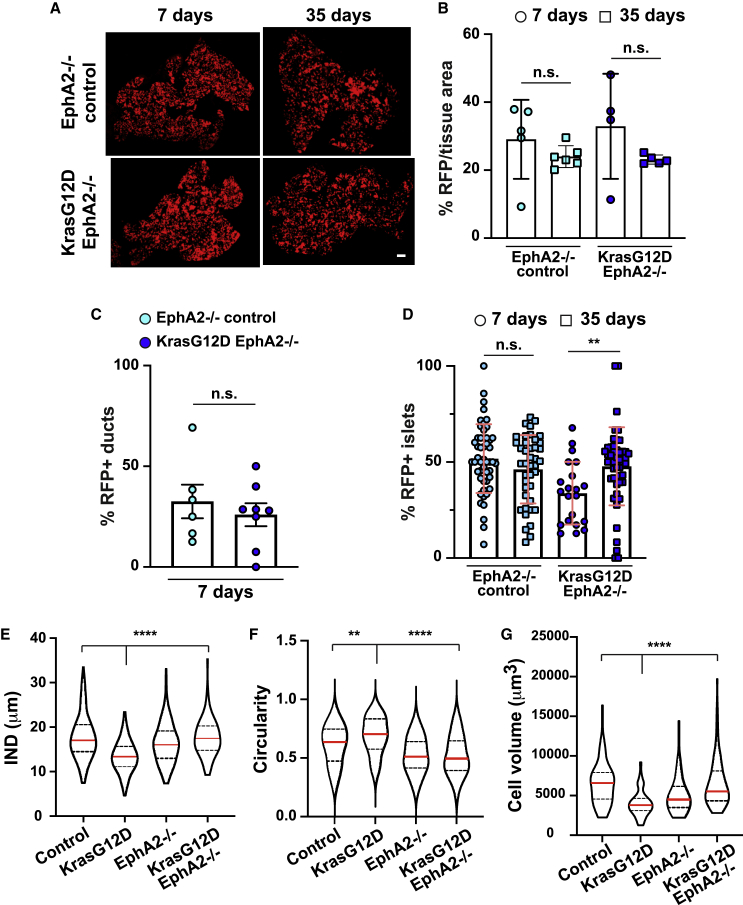
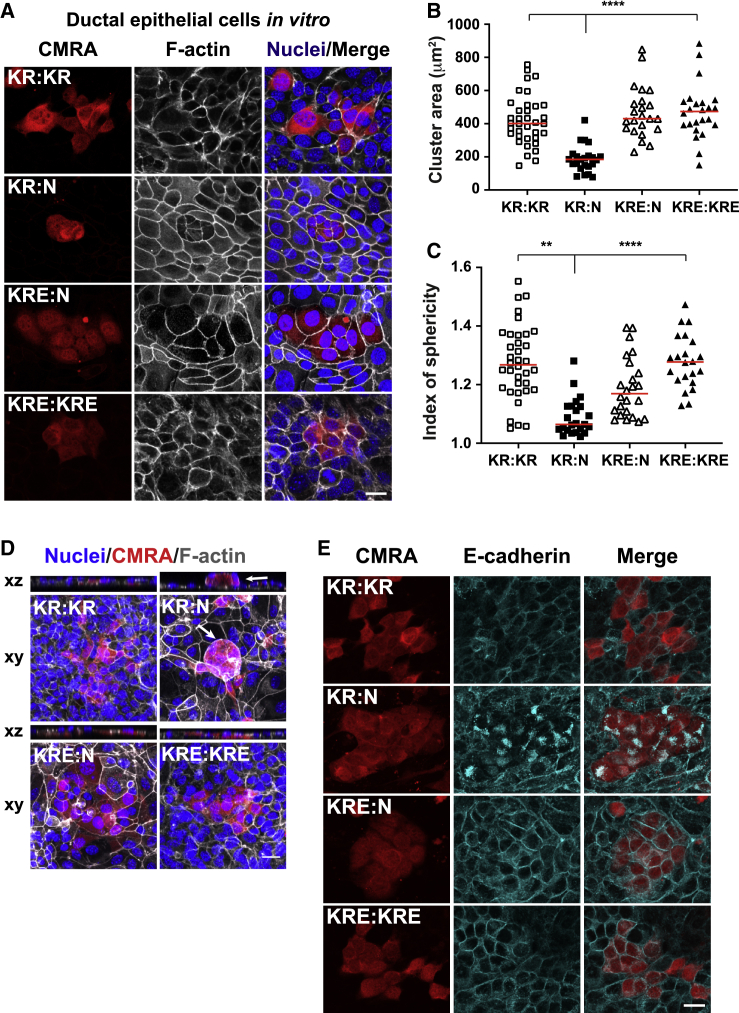
As we age, our tissues are repeatedly challenged by mutational insult, yet cancer occurrence is a relatively rare event. Cells carrying cancer-causing genetic mutations compete with normal neighbors for space and survival in tissues. However, the mechanisms underlying mutant-normal competition in adult tissues and the relevance of this process to cancer remain incompletely understood. Here, we investigate how the adult pancreas maintains tissue health in vivo following sporadic expression of oncogenic Kras (KrasG12D), the key driver mutation in human pancreatic cancer. We find that when present in tissues in low numbers, KrasG12D mutant cells are outcompeted and cleared from exocrine and endocrine compartments in vivo. Using quantitative 3D tissue imaging, we show that before being cleared, KrasG12D cells lose cell volume, pack into round clusters, and E-cadherin-based cell-cell adhesions decrease at boundaries with normal neighbors. We identify EphA2 receptor as an essential signal in the clearance of KrasG12D cells from exocrine and endocrine tissues in vivo. In the absence of functional EphA2, KrasG12D cells do not alter cell volume or shape, E-cadherin-based cell-cell adhesions increase and KrasG12D cells are retained in tissues. The retention of KRasG12D cells leads to the early appearance of premalignant pancreatic intraepithelial neoplasia (PanINs) in tissues. Our data show that adult pancreas tissues remodel to clear KrasG12D cells and maintain tissue health. This study provides evidence to support a conserved functional role of EphA2 in Ras-driven cell competition in epithelial tissues and suggests that EphA2 is a novel tumor suppressor in pancreatic cancer.

Keywords: E-cadherin; EphA2; PanINs; cell competition; early tumorigenesis; epithelial tissue; homeostasis; oncogenic KRAS; pancreas; pancreatic cancer.


Conflict of interest statement

Declarations of interests The authors declare no competing interests.

Figures

None
Graphical abstract
Figure 1
Figure 1
RFP-labeled KrasG12D cells are cleared from pancreas tissue compartments in vivo (A) Pancreas tissue (Kras WT) fixed at 7 days p.i. and stained with anti-RFP (red), anti-E-cadherin (green) antibodies, and Hoescht (blue). White arrows, RFP-labeled acinar cells; white arrowhead, RFP-labeled ductal epithelial cells; dashed white line, RFP-labeled islet. (B) RFP fluorescence in tissues harvested from Kras WT (control) or KrasG12D mice. Scale bars, 500 μm. (C) Percentage RFP fluorescence/tissue area over time. Each data point represents average RFP fluorescence per mouse. ∗∗p < 0.002, unpaired Student’s t test using Welch correction. Kras WT controls, n = 5 mice (7, 35 days); KrasG12D, n = 4 (7 days), n = 6 mice (35 days). (D) RFP expression in genomic DNA relative to housekeeping gene/tissue/mouse. p = 0.024, unpaired Student’s t test using Welch correction; n = 5 (7 days); n = 6 (35 days) mice/genotype. (E) Percentage RFP+ ducts in Kras WT control and KrasG12D tissues over time. Data are means ± SEMs. p = 0.04, one-way ANOVA. Kras WT controls, n = 8 (7 days), n = 5 mice (35 days); KrasG12D, n = 10 (7 days), n = 3 mice (35 days). (F) Percentage RFP+ islet cells/total islet cells in Kras WT control and KrasG12D tissues over time. Data represent mean ± SD islets pooled from n = 4 mice/genotype. ∗∗∗p = 0.0008, non-parametric Student’s t test. Kras WT controls, n = 52 islets (7 days), n = 40 islets (35 days); KrasG12D, n = 33 islets (7 days), n = 35 islets (35 days). See also Figures S1 and S2.
Figure 2
Figure 2
KrasG12D cells are retained in EphA2 knockout tissues (A) RFP fluorescence in EphA2−/− control or KrasG12D/+ EphA2−/− tissues. Scale bars, 500 μm. (B) Percentage of RFP fluorescence/tissue area over time. Each data point represents average RFP fluorescence per mouse. EphA2−/− controls, n = 5 (7 days), n = 6 mice (35 days); KrasG12D EphA2−/−, n = 4 (7 days), n = 5 mice (35 days). (C) Percentage of RFP+ ducts in EphA2−/− control and KrasG12D EphA2−/− tissues at 7 days p.i. EphA2−/− control, n = 6 mice; KrasG12D EphA2−/−, n = 8 mice. Data are means ± SEMs. (D) Percentage of RFP+ islet cells/total islet cells in EphA2−/− control and KrasG12D EphA2−/− tissues over time. Data represent mean ± SD islets pooled from n = 4 mice/genotype at 7 days, n = 6 mice/genotype at 35 days. n.s., not significant. ∗∗p = 0.0035, non-parametric Student’s t test. EphA2−/− controls, n = 49 islets (7 days), n = 41 (35 days) islets; KrasG12D EphA2−/−, n = 21 islets (7 days), n = 47 islets (35 days). (E) Violin plots of internuclear distance (IND, μm) between neighboring RFP+ cells. (F) Circularity of RFP clusters in tissues. (G) RFP+ cell volume (μm3). Red line, median. Dashed lines, quartiles. ∗∗p < 0.01, ∗∗∗∗p < 0.0001, non-parametric Kruskal-Wallis ANOVA with post hoc test comparing KrasG12D to controls and KrasG12D to KrasG12D EphA2−/−. Data represent values pooled from 3 mice (Kras WT controls, KrasG12D EphA2−/−, and EphA2−/− controls) or 4 mice (KrasG12D). See STAR Methods for n numbers. See also Figures S2–S4 and Video S1.
Figure 3
Figure 3
EphA2 expressed on KrasG12D cells drives cell segregation and apical extrusion of mutant cells from normal tissues in vitro (A, D, and E) Transformed tumor-derived epithelial cells (KR, KrasG12D; KRE, KrasG12D EphA2−/−) prelabeled with cell tracker dye (CMRA, red) and mixed with non-labeled, non-transformed PDECs (N) (KR:N, KRE:N) or non-labeled transformed cells (KR:KR, KRE:KRE) at 1:50 ratios. Cells were fixed at 48 h. (A) Images of pancreatic ductal epithelial cell (PDEC) coculture assays. (D) KrasG12D cells are apically extruded in an EphA2-dependent manner. White arrows label apically extruded cells. (A and D) Gray, F-actin; blue, Hoescht. (E) Cyan, anti-E-cadherin antibodies; blue, Hoescht. Scale bars, 20 μm. (B and C) Scatterplots of (B) transformed cell cluster area (μm2) in coculture assays and (C) index of sphericity of normal mutant boundaries. Red lines denote median. Data represent counts from n = 3 repeats. ∗∗p < 0.01, ∗∗∗∗p < 0.0001, non-parametric Kruskal-Wallis ANOVA with post hoc test comparing KR:N to KR:KR and KR:N to KRE:N. See STAR Methods for n numbers.
Figure 4
Figure 4
Adherens junctions are remodeled at mutant-normal cell-cell contacts in exocrine and endocrine tissues in an EphA2-dependent manner (A, C, and E) Images of exocrine/endocrine tissues from each genotype fixed at 7 days p.i. and stained with anti-RFP (red), anti-E-cadherin (cyan; A and C), or p120-catenin (gray; D) antibodies and Hoescht (blue). Area in yellow dashed box in merged image: digital enlarged (“digital zoom”) image. Scale bars, 20 μm. See also Video S1. (B, D, and F) Scatterplots of E-cadherin (B and D) or p120-catenin (F) fluorescence at cell-cell interfaces between RFP+-RFP cells in Kras WT control, KrasG12D, EphA2−/−, or KrasG12D EphA2−/− tissues. Red bar denotes the mean. Data represent cell-cell contacts pooled from n = 3 mice (Kras WT controls, KrasG12D EphA2−/−, EphA2−/− controls), n = 4 mice (KrasG12D). See STAR Methods for n numbers. p < 0.05, ∗∗p < 0.005, ∗∗∗∗p < 0.0001, non-parametric Kruskal-Wallis ANOVA with post hoc test comparing KrasG12D to control and KrasG12D to KrasG12D EphA2−/−, or control to EphA2−/−.
Figure 5
Figure 5
Normal cells directly neighboring KrasG12D cells increase in cell volume in vivo in an EphA2-dependent manner (A) Pancreas tissue fixed at 7 days p.i. and stained with anti-RFP (red), anti-E-cadherin (green) antibodies, and Hoescht (blue). Segmentation analysis in 3D labels normal cells (pseudo-colored) neighboring RFP+ mutant cells (dashed line). Scale bar, 20 μm. (B and C) Cell volume (μm3) of RFP+ and unlabeled normal cells, adjacent or non-adjacent to RFP+ cells in (B) KrasG12D (KC) and (C) KrasG12D EphA2−/− (KCE) tissues. Red line, median; dashed lines, quartiles. n.s., not significant. ∗∗∗∗p < 0.0001, non-parametric Student’s t tests. Data represent volume of individual cells pooled from n = 3 mice KrasG12D EphA2−/− (KCE); n = 4 mice KrasG12D (KC). See STAR Methods for n numbers. See also Video S1.
Figure 6
Figure 6
Early appearance of premalignant PanIN lesions in KrasG12D EphA2−/− tissues (A) Pancreas tissues fixed at 140 days p.i. and stained for mucin (blue). Scale bar, 100 μm. (B) Premalignant lesion density (PanIN/mm2) in KrasG12D (KC) or KrasG12D EphA2−/− (KCE) tissues over time. Data represent means ± SDs of average number of lesions per tissue area from 4 tissue sections/mouse. n.s., not significant. ∗∗p = 0.0029, non-parametric Student’s t test. KrasG12D (KC), n = 7 (35 days), n = 9 mice (140 days); KrasG12D EphA2−/− (KCE), n = 6 (35, 140 days).

References

    1. Eisenhoffer G.T., Loftus P.D., Yoshigi M., Otsuna H., Chien C.B., Morcos P.A., Rosenblatt J. Crowding induces live cell extrusion to maintain homeostatic cell numbers in epithelia. Nature. 2012;484:546–549. - PMC - PubMed
    1. Rosenblatt J., Raff M.C., Cramer L.P. An epithelial cell destined for apoptosis signals its neighbors to extrude it by an actin- and myosin-dependent mechanism. Curr. Biol. 2001;11:1847–1857. - PubMed
    1. Brown S., Pineda C.M., Xin T., Boucher J., Suozzi K.C., Park S., Matte-Martone C., Gonzalez D.G., Rytlewski J., Beronja S., Greco V. Correction of aberrant growth preserves tissue homeostasis. Nature. 2017;548:334–337. - PMC - PubMed
    1. Hogan C., Dupré-Crochet S., Norman M., Kajita M., Zimmermann C., Pelling A.E., Piddini E., Baena-López L.A., Vincent J.P., Itoh Y. Characterization of the interface between normal and transformed epithelial cells. Nat. Cell Biol. 2009;11:460–467. - PubMed
    1. Kajita M., Hogan C., Harris A.R., Dupre-Crochet S., Itasaki N., Kawakami K., Charras G., Tada M., Fujita Y. Interaction with surrounding normal epithelial cells influences signalling pathways and behaviour of Src-transformed cells. J. Cell Sci. 2010;123:171–180. - PMC - PubMed

Publication types