. 2021 May 3;56(9):1238-1252.e5.
doi: 10.1016/j.devcel.2021.04.001. Epub 2021 Apr 22.

Human placental cytotrophoblast epigenome dynamics over gestation and alterations in placental disease

Affiliations

Human placental cytotrophoblast epigenome dynamics over gestation and alterations in placental disease

Bo Zhang et al. Dev Cell. .

Abstract

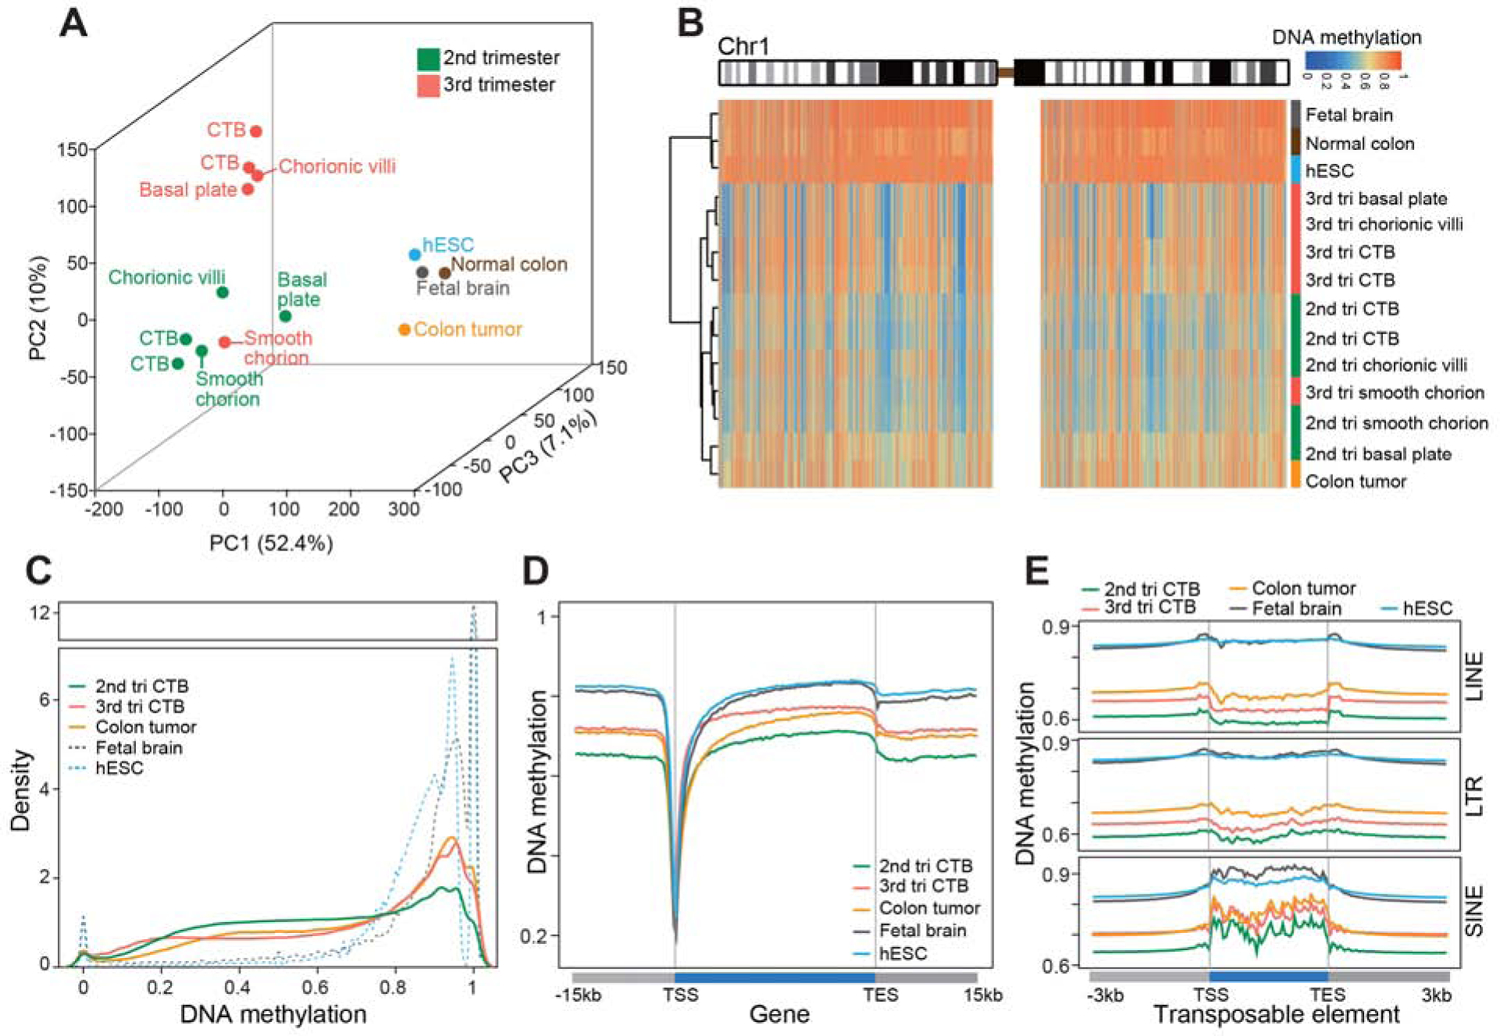
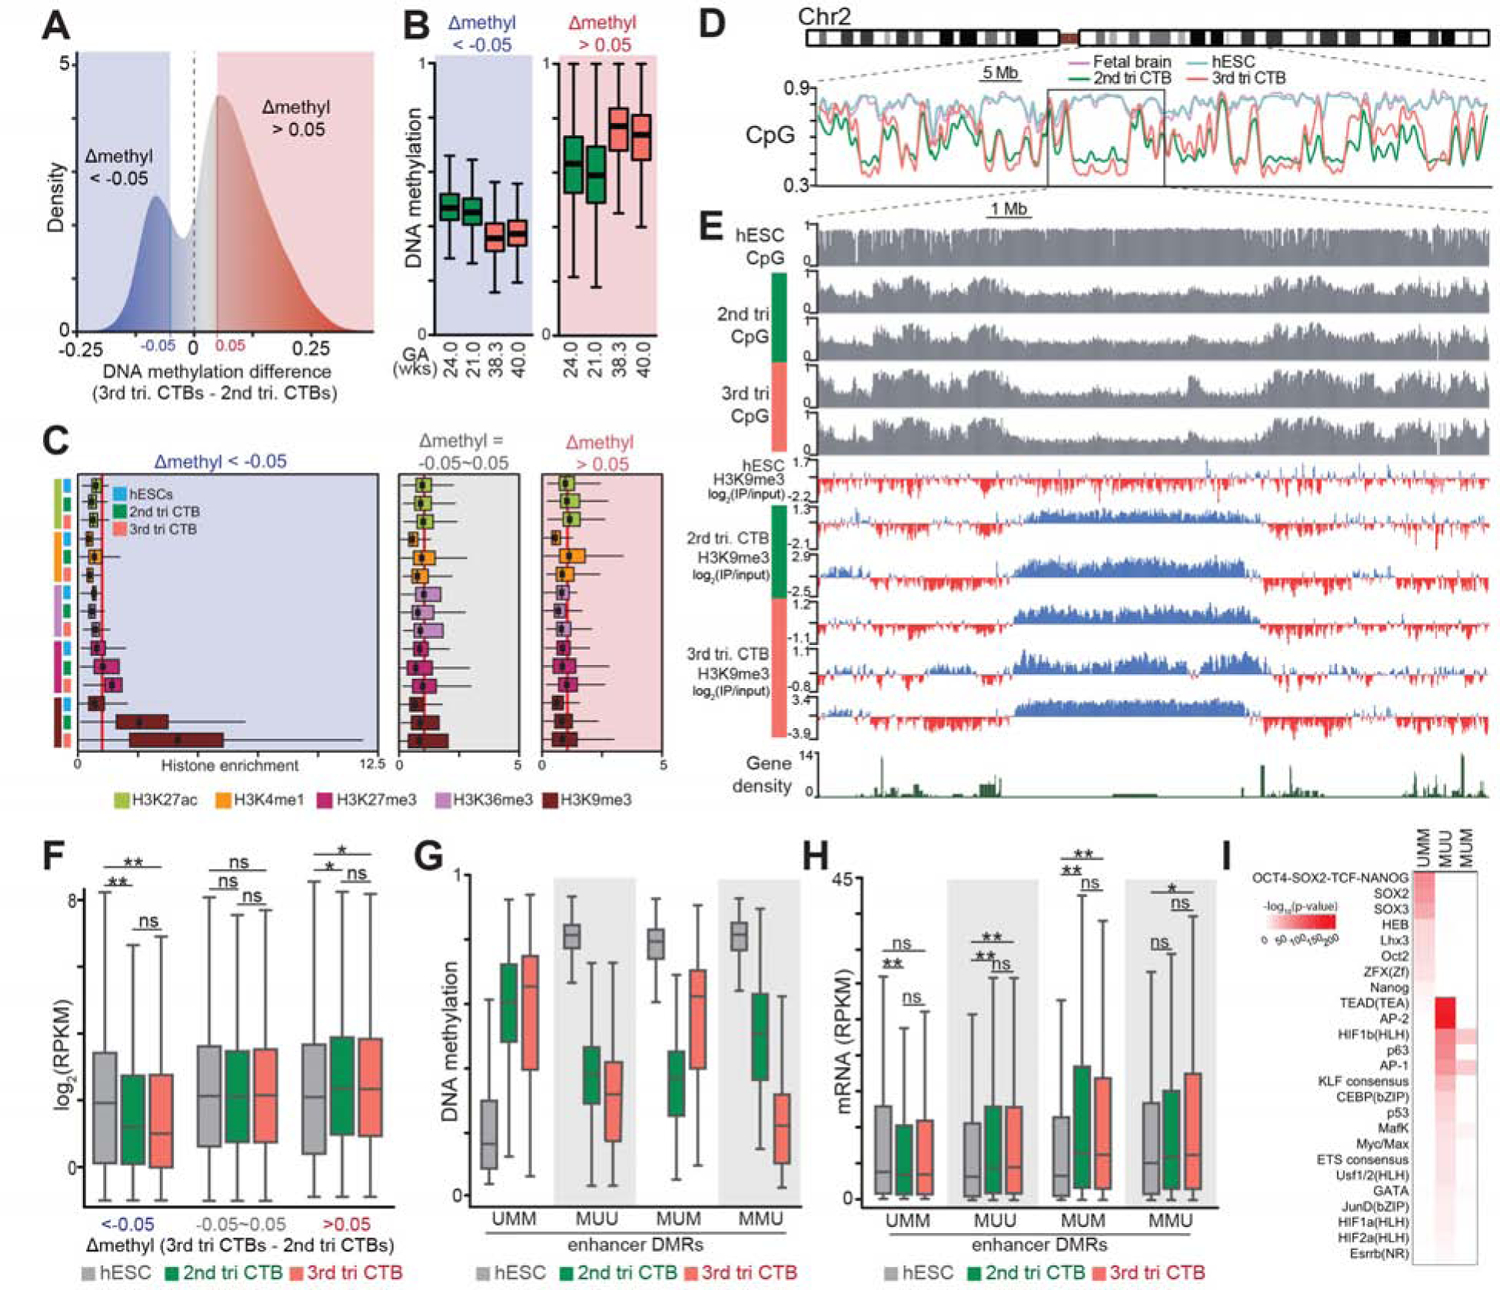
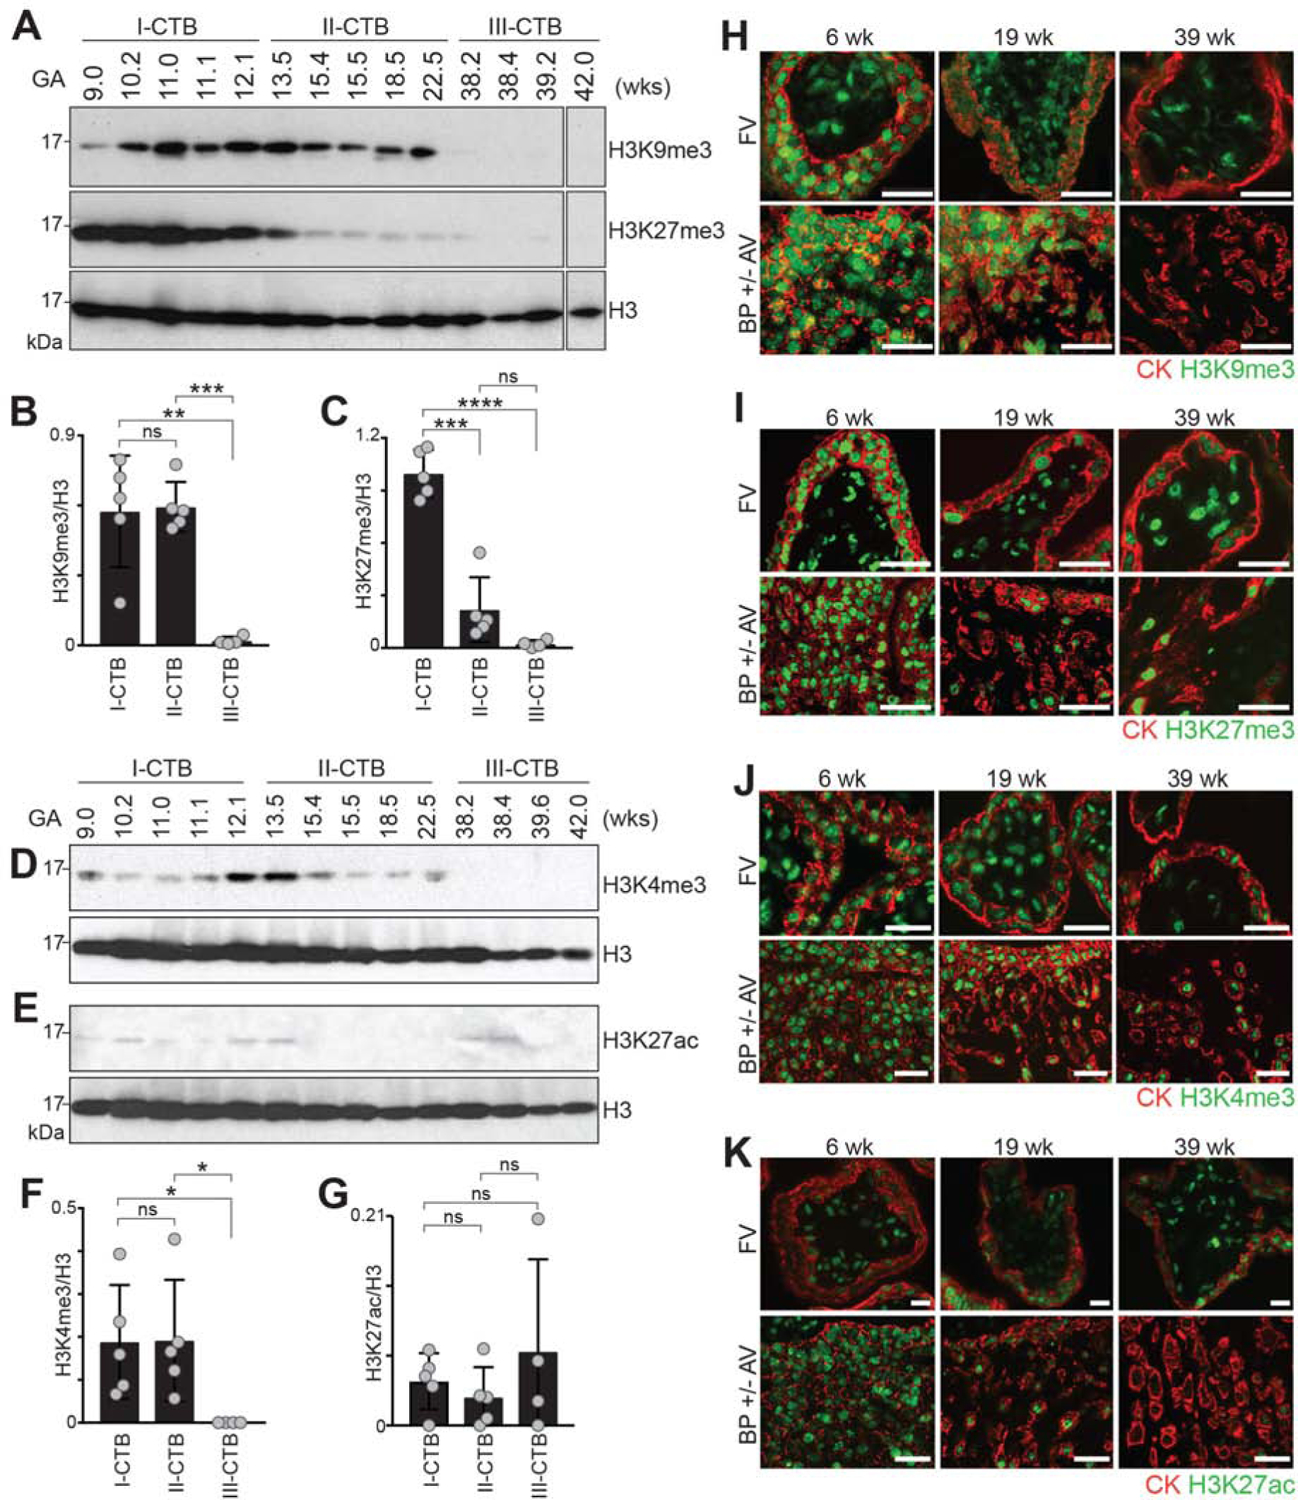
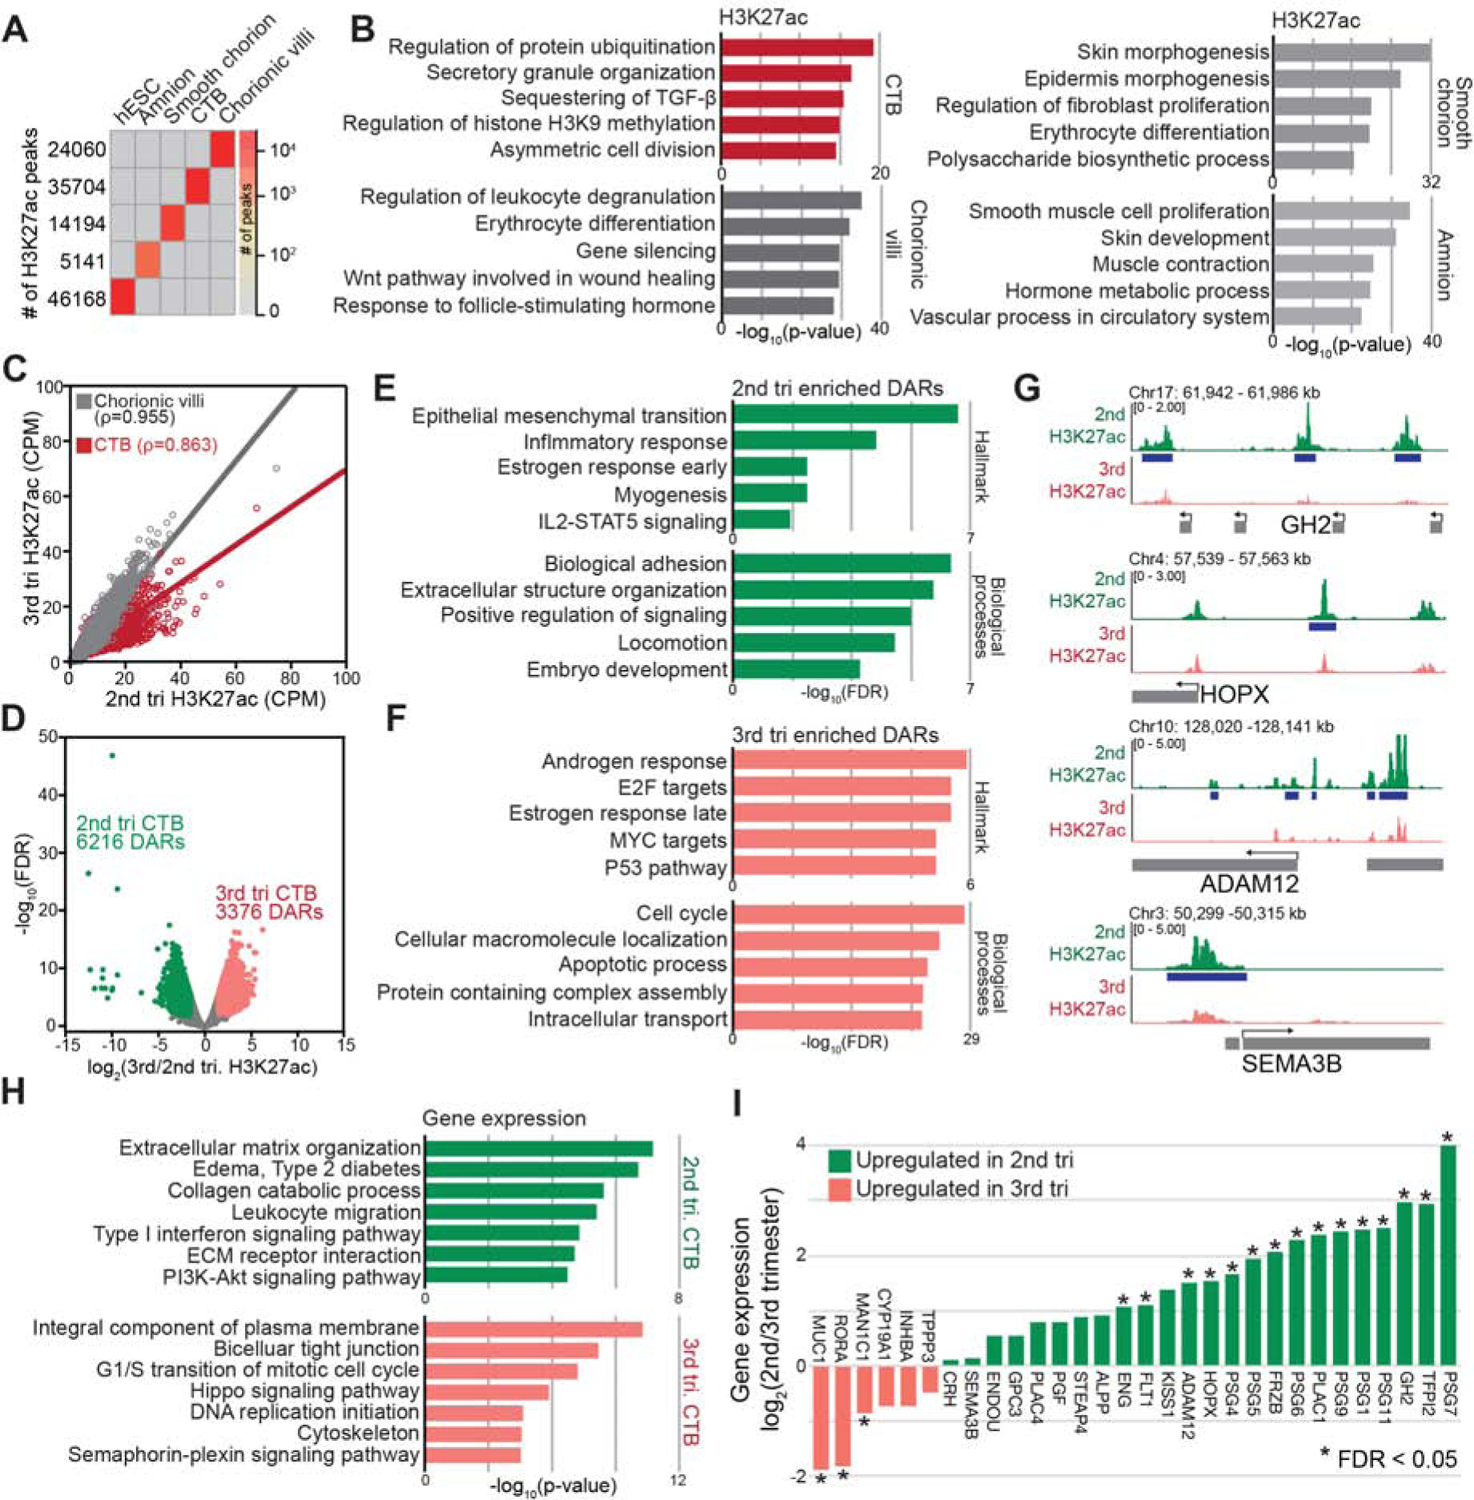
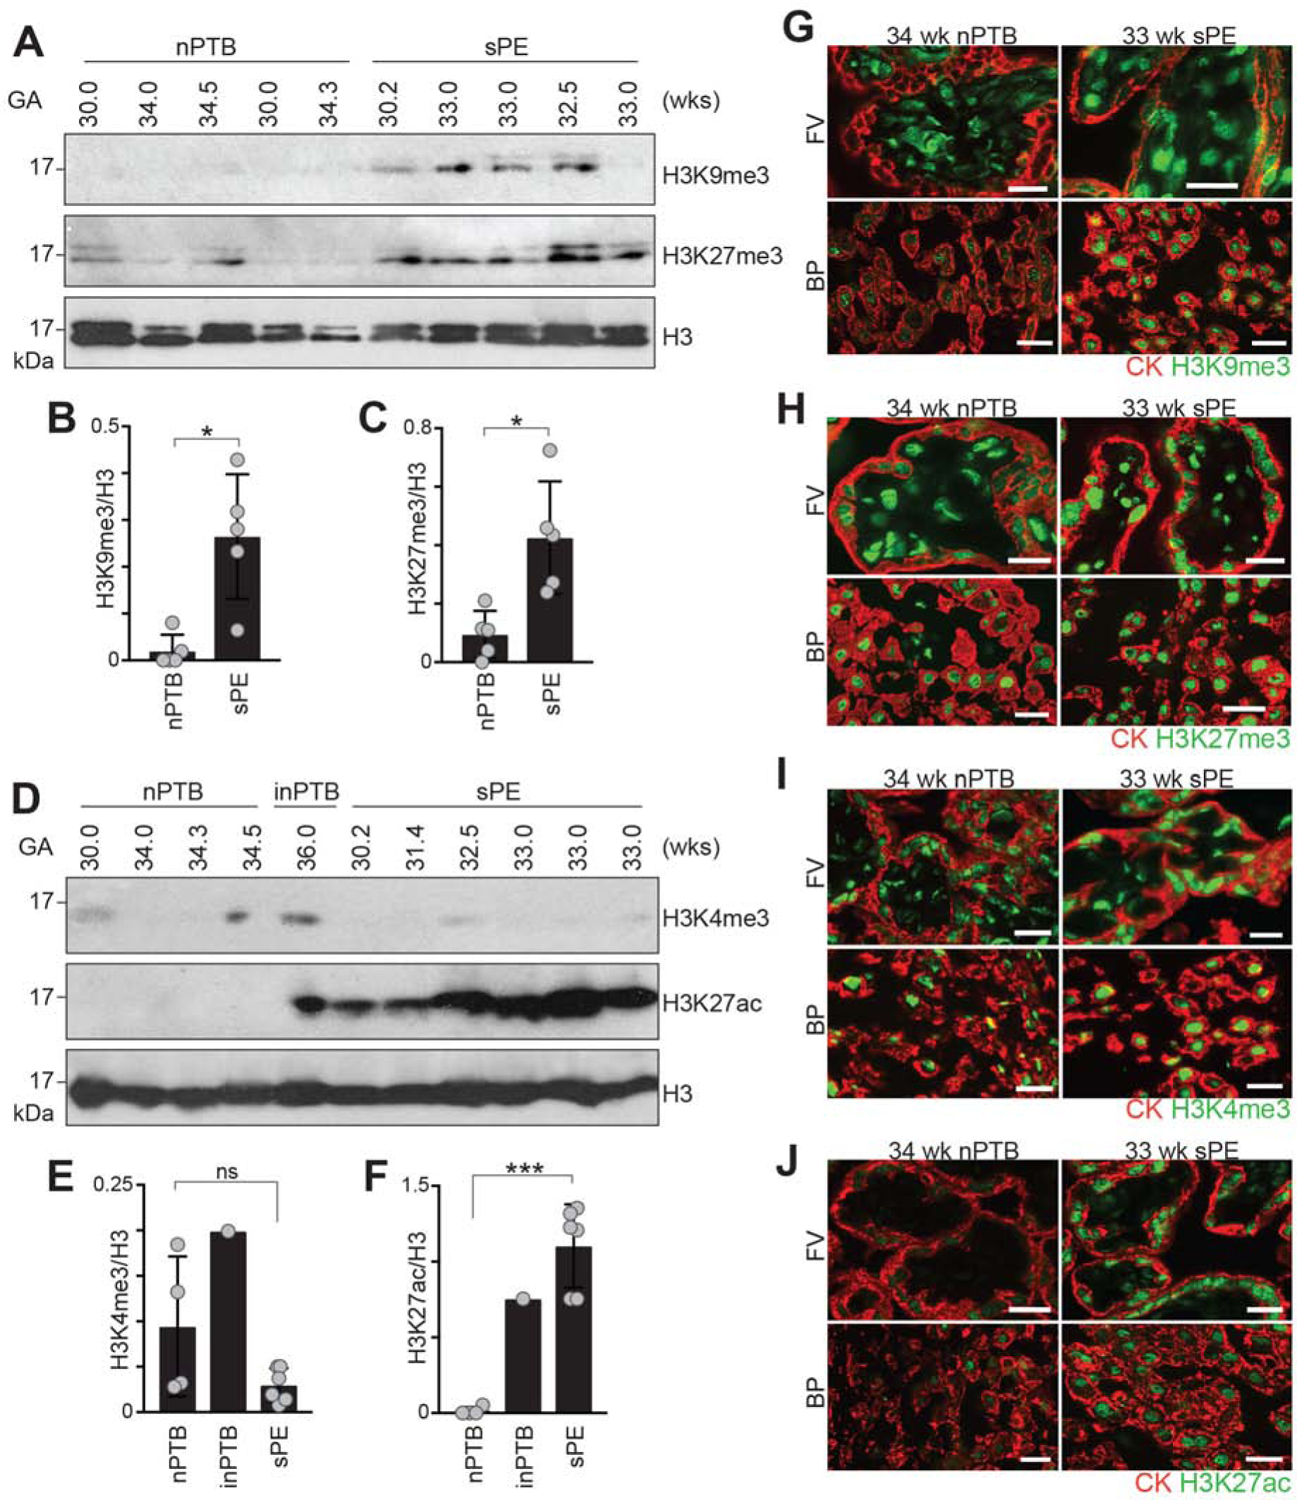
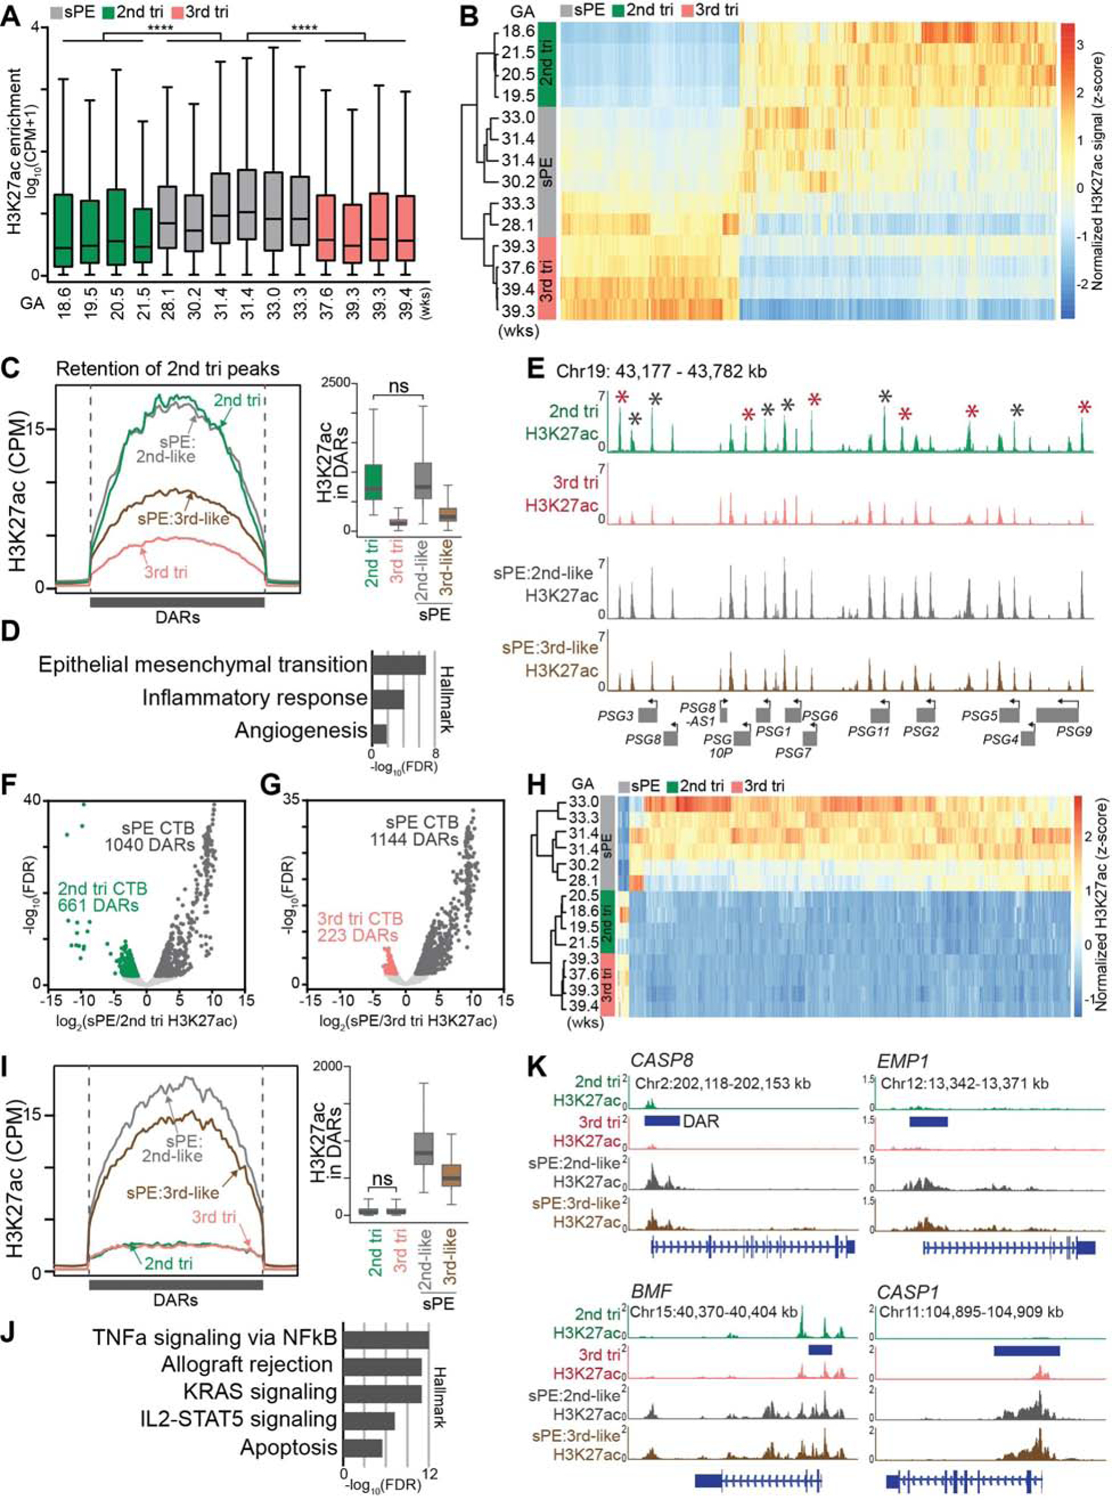
The human placenta and its specialized cytotrophoblasts rapidly develop, have a compressed lifespan, govern pregnancy outcomes, and program the offspring's health. Understanding the molecular underpinnings of these behaviors informs development and disease. Profiling the extraembryonic epigenome and transcriptome during the 2nd and 3rd trimesters revealed H3K9 trimethylation overlapping deeply DNA hypomethylated domains with reduced gene expression and compartment-specific patterns that illuminated their functions. Cytotrophoblast DNA methylation increased, and several key histone modifications decreased across the genome as pregnancy advanced. Cytotrophoblasts from severe preeclampsia had substantially increased H3K27 acetylation globally and at genes that are normally downregulated at term but upregulated in this syndrome. In addition, some cases had an immature pattern of H3K27ac peaks, and others showed evidence of accelerated aging, suggesting subtype-specific alterations in severe preeclampsia. Thus, the cytotrophoblast epigenome dramatically reprograms during pregnancy, placental disease is associated with failures in this process, and H3K27 hyperacetylation is a feature of severe preeclampsia.

Keywords: DNA methylation; H3K27ac; H3K9me3; chorionic villi; cytotrophoblast; gestational regulation; histone modification; human placenta; placental disease; preeclampsia.


Conflict of interest statement

Declaration of interests S.J.F. and M.M. are consultants for Novo Nordisk. The other authors declare no competing interests.

Figures

Figure 1
Figure 1. Extraembryonic DNA: Hypomethylation and Gestational Age Regulation.
Whole genome bisulfite sequencing enabled quantitative single base-resolution DNA methylation profiling of the extraembryonic compartment. The data were compared to equivalent analyses of embryonic, fetal, and adult (normal and cancer) samples. (A) Principal component analysis segregated the extraembryonic samples from all others primarily along PC1. Within the extraembryonic group, the samples separated according to type and gestational age. The exception was the smooth chorion, which contains a cytotrophoblast progenitor population pregnancy. (B) Chromosome-level (Chr1) view of DNA methylation in the same samples as shown in (A). Compared to the other genomes, extraembryonic DNA showed a unique pattern of global hypomethylation interspersed among megabase domains of deeper hypomethylation. Similarly, colon tumor DNA was hypomethylated, but in a different pattern. (C) As compared to the other embryonic and fetal samples, 2nd trimester CTBs had an intermediate level of DNA methylation. At term, the cells acquired higher levels of methylation similar to the colon tumor. (D–E) Averaged DNA methylation levels over +/− 15 kb regions of gene bodies (RefSeq) and +/− 3 kb regions of transposable elements showed the same trends as in (C). 2nd/3rd trimester CTBs, n=2; 2nd/3rd chorionic villi, smooth chorion, and basal plate, n=1; tri., trimester; TSS, transcription/transposon start site; TES, transcription/transposon end site.
Figure 2
Figure 2. The Cytotrophoblast Epigenome Gained DNA Methylation at Term While the Local Deeply Hypomethylated Domains Remained Occupied by H3K9me3, which Repressed Transcription.
(A) Genome-wide cytotrophoblast (CTB) DNA methylation over 10 kb windows revealed increases as gestational age advanced. (B-C) Regions of the CTB genome that were deeply hypomethylated (B) had strongly enriched signals for H3K9me3 regardless of gestational age (C). (D–E) A chromosome-level (Chr2) view showed deeply hypomethylated domains of the 2nd and 3rd trimester CTB genomes (vs. human embryonic stem cells (hESCs) and fetal brain) had increased levels of H3K9me3 (vs. hESCs) in relatively gene poor regions. (F) Transcription of genes in the deeply hypomethylated valleys was repressed. *, P<0.01; **, P<0.001 (ANOVA); ns, not significant. (G-H) Enhancer DMRs (eDMRs, identified as described in Supplementary Materials) increased the transcription of nearby hESC or CTB genes. (I) eDMRs were significantly enriched for binding motifs of transcription factor with important cell type-specific functions. *, P<0.05; **, P<0.001 (ANOVA). tri, trimester; GA, gestational age; wks, weeks; U, unmethylated; M, methylated. The colored bodies of the box plots represent the first and third quartiles of loci, the middle line represents the median, and the whiskers extend to minimum and maximum data points.
Figure 3
Figure 3. Loss of a subset of cytotrophoblast histone modifications with advancing gestational age.
Immunoblotting (A-G) assessed the relative abundance of histone modifications in lysates of freshly isolated 1st (I), 2nd (II) or 3rd trimester (term, III) cytotrophoblasts (CTBs). An immunolocalization (H to K) approach was used to assess expression of the same histone modifications in tissue sections of floating villi (FV) and the basal plate (BP), which includes anchoring villi (AV) and their uterine attachments (diagrammed in Figure S1). (A) The strong signal for H3K9me3 in 1st and 2nd trimester samples were lost at term. H3K27me3 immunoreactivity followed the same pattern with loss beginning in early 2nd trimester. (B-C) quantification of the results relative to the H3 loading control (Welch’s t-test). (D–E) The H3K4me3 signal (D) varied from the 1st to the 2nd trimesters and was lost at term. The H3K27ac signal (E) was weak and fluctuated among the samples. (F-G) Quantification (Welch’s t-test) of H3K4me3 (F) and H3K27ac (G). (H) (upper panels), In FV, the nuclei of cytokeratin-positive villous CTBs and syncytiotrophoblasts (STBs) reacted with anti-H3K9me3 in the 1st to the 2nd trimester samples. Much of the immunoreactivity was lost at term. (lower panels), In AV, invasive CTBs showed a similar pattern of down-regulated H3K9me3 at term. (I-J) In FV and BP ± AV, CTB (and STB) signals for H3K27me3 and H3K4me3 were also diminished at term. (K) Compared to the immunoblot (Figure 3E), relatively strong H3K27ac signals were observed in association with trophoblasts in floating and anchoring villi and the staining was again reduced at term. The error bars represent the standard deviations. *, P<0.05; **, P<0.01; ***, P<0.001; ****, P<0.0001. GA, gestational age; wk, week. Bar = 50 μm.
Figure 4
Figure 4
Changes in H3K27ac Occupancy and mRNA Expression (2nd to 3rd trimester) Involved Cytotrophoblast Genes Upregulated in Severe Preeclampsia. (A) H3K27ac peaks that were unique to cytotrophoblasts (CTBs) or other extraembryonic compartments. (B) GO enrichment analysis highlighted the distinct biological processes that were associated with each set of H3K27ac peaks and their relevance to sample-specific functions. (C) Comparison of H3K27ac levels (10 kb windows) in CTBs and chorionic villi (2nd trimester vs. 3rd trimester) showed gestational age-related changes were confined to CTBs. Gray and red linear regression lines and Pearson’s rho shows the H3K27ac correlation between 2nd and 3rd trimester. (D) In CTBs, as gestational age advanced, about twice as many peaks were lost as gained at term. (E) GO enrichment analysis showed 2nd trimester CTB differentially acetylated regions (DARs) were enriched for genes involved in processes integral to placental development. (F) Regions that gained H3K27ac at term were enriched for hormone responses and cell cycle or apoptotic regulators. (G) Sites that lost H3K27ac at term were associated with the promoters of CTB genes we previously showed were upregulated in severe preeclampsia (sPE) (Zhou et al., 2013). (H) GO enrichment (Biological processes and Disease ontology) of genes highly expressed in 2nd (upper panel) vs. 3rd trimester CTBs (lower panel). (I) Transcripts that were upregulated in sPE (Zhou et al., 2013) were overrepresented in the gene set with higher expression in 2nd vs. 3rd trimester CTBs. tri, trimester.
Figure 5
Figure 5
Dysregulation of Cytotrophoblast Histone Modifications in Placenta-associated Pregnancy Complications. Immunoblotting (A-F) or immunolocalization (G-J) enabled analyses of the relative abundance of histone modifications in cytotrophoblast (CTB) lysates from gestational age-matched placentas following delivery due to preterm birth with no signs of infection (nPTB), PTB with a documented infection (inPTB), or severe preeclampsia (sPE). (A) In the majority of samples, CTBs isolated from sPE placentas had a stronger signal for H3K9me3 and H3K27me3 than the equivalent population of cells isolated from nPTB placentas. (B and C) Quantification of H3K9me3 or H3K27me3, respectively, relative to H3 (Welch’s t-test). (D) anti-H3K4me3 reactivity was low-to-undetectable. The H3K27ac signal was significantly increased in sPE and in an inPTB sample relative to nPTB. (E-F) Quantification of H3K4me3 or H3K27ac signals, respectively, relative to H3 (Welch’s t-test). (G) In floating villi (FV) and within the basal plate (BP), sPE was associated with relatively more intense CTB and syncytiotrophoblast (STB) anti-H3K9me3 immunoreactivity than was observed in the nPTB samples. (H) The trophoblast-associated H3K27me3 signal also tended to be stronger in the sPE group. (I) H3K4me3 immunostaining gave a stronger signal than in the immunoblot format and showed similar patterns in the nPTB and sPE groups. (J) Expression of H3K27ac, which was nearly undetectable in the nPTB group, was strongly increased in association with CTBs and STBs in sPE. The error bars represent the standard deviations. *, P< 0.05; ***, P<0.001. Bar = 50 μm.
Figure 6
Figure 6
Enhanced H3K27ac Occupancy of Cytotrophoblast DNA in Severe Preeclampsia. (A) Box plots of H3K27ac genome-wide enrichment from ChIP-seq in merged MACS2 peaks across the samples. Consistent with the immunoblot analyses (Figure 5D), cytotrophoblasts (CTBs) from severe preeclampsia (sPE) pregnancies had significantly higher average H3K27ac levels compared to control 2nd or 3rd trimester samples (****, P<0.0001, Mann-Whitney test). (B) Hierarchical clustering based on 2nd vs 3rd trimester differentially acetylated regions (DARs; FDR <0.01, FC >1.5) showed that 4/6 severe preeclampsia (sPE) samples were more similar to 2nd trimester cytotrophoblasts (CTBs); 2 sPE samples, including cells from the earliest gestational age (GA) (28 wks), clustered with 3rd trimester CTBs. (C) sPE H3K27ac peaks with a 2nd trimester pattern. Unless marked ns (not significant), the values were significantly different from one another (Mann-Whitney test, P<0.0001). (D) The overlapping peaks between sPE and 2nd trimester CTBs were near genes with syndrome-relevant hallmarks. (E) Specific loci in all the sPE samples with a 2nd trimester-like H3K27ac peak pattern included the PSG cluster, a highly related family that is strongly downregulated at term and upregulated in sPE CTBs. Red asterisks: FDR <0.01, FC >1.5; Black asterisks: FDR <0.05. (F-G) Volcano plots of differentially acetylated regions (DARs; FDR <0.01, FC>1.5) between 2nd trimester and sPE (F) and 3rd trimester and sPE (G). (H) Hierarchical clustering of sPE-specific DARs, the overlapping sites identified in (F) and (G). (I) Unique sPE H3K27ac peaks. Unless marked ns (not significant), the values were significantly different from one another (Mann-Whitney test, P<0.0001). (J) The unique sPE peaks were near genes with hallmarks of signaling pathways, allograft rejection and apoptosis. (K) Genes associated with unique sPE H3K27ac peaks included several that are involved in apoptosis such as the “initiator” CASP8, EMP1, BMF and CASP1. tri, trimester; wks, weeks. The colored bodies of the box plots represent the first and third quartiles of loci, the middle line represents the median, and the whiskers extend to the last data point within 1.5 times the interquartile range.

Comment in

References

    1. ACOG Committee on Practice Bulletins--Obstetrics (2002). ACOG practice bulletin. Diagnosis and management of preeclampsia and eclampsia. Number 33, January 2002. Obstet. Gynecol 99, 159–167. - PubMed
    1. American College of Obstetricians and Gynecologists, Task Force on Hypertension in Pregnancy (2013). Hypertension in pregnancy. Report of the American College of Obstetricians and Gynecologists’ Task Force on Hypertension in Pregnancy. pp. 1122–1131. - PubMed
    1. Au Yeung WK, Brind’Amour J, Hatano Y, Yamagata K, Feil R, Lorincz MC, Tachibana M, Shinkai Y, and Sasaki H (2019). Histone H3K9 Methyltransferase G9a in Oocytes Is Essential for Preimplantation Development but Dispensable for CG Methylation Protection. Cell Rep 27, 282–293.e284. - PubMed
    1. Barker DJ, Winter PD, Osmond C, Margetts B, and Simmonds SJ (1989). Weight in infancy and death from ischaemic heart disease. Lancet 2, 577–580. - PubMed
    1. Bárcena A, Muench MO, Kapidzic M, and Fisher SJ (2009). A new role for the human placenta as a hematopoietic site throughout gestation. Reprod Sci 16, 178–187. - PMC - PubMed

Publication types