. 2021 Jun:169:283-293.
doi: 10.1016/j.freeradbiomed.2021.04.018. Epub 2021 Apr 20.

PPARα agonist WY-14,643 enhances ethanol metabolism in mice: Role of catalase

Affiliations

PPARα agonist WY-14,643 enhances ethanol metabolism in mice: Role of catalase

Xue Chen et al. Free Radic Biol Med. 2021 Jun.

Abstract

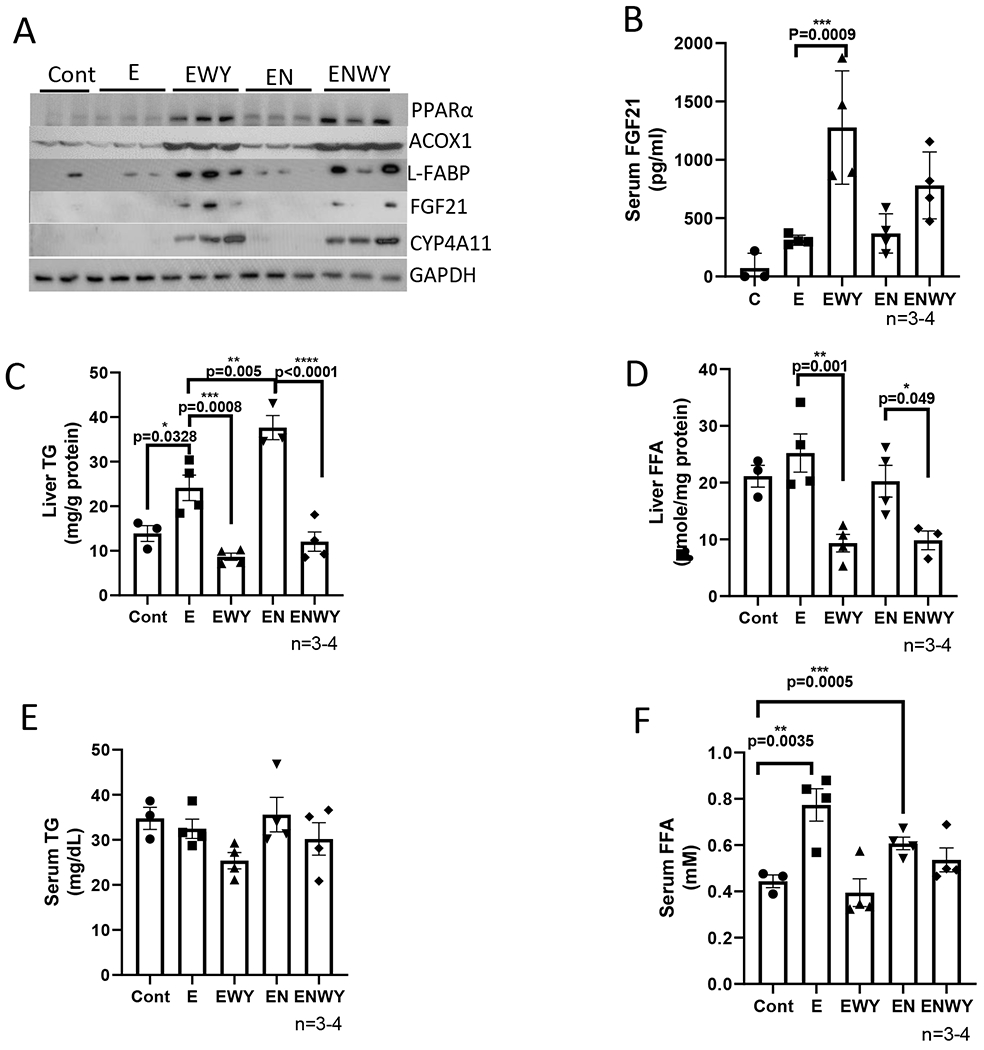
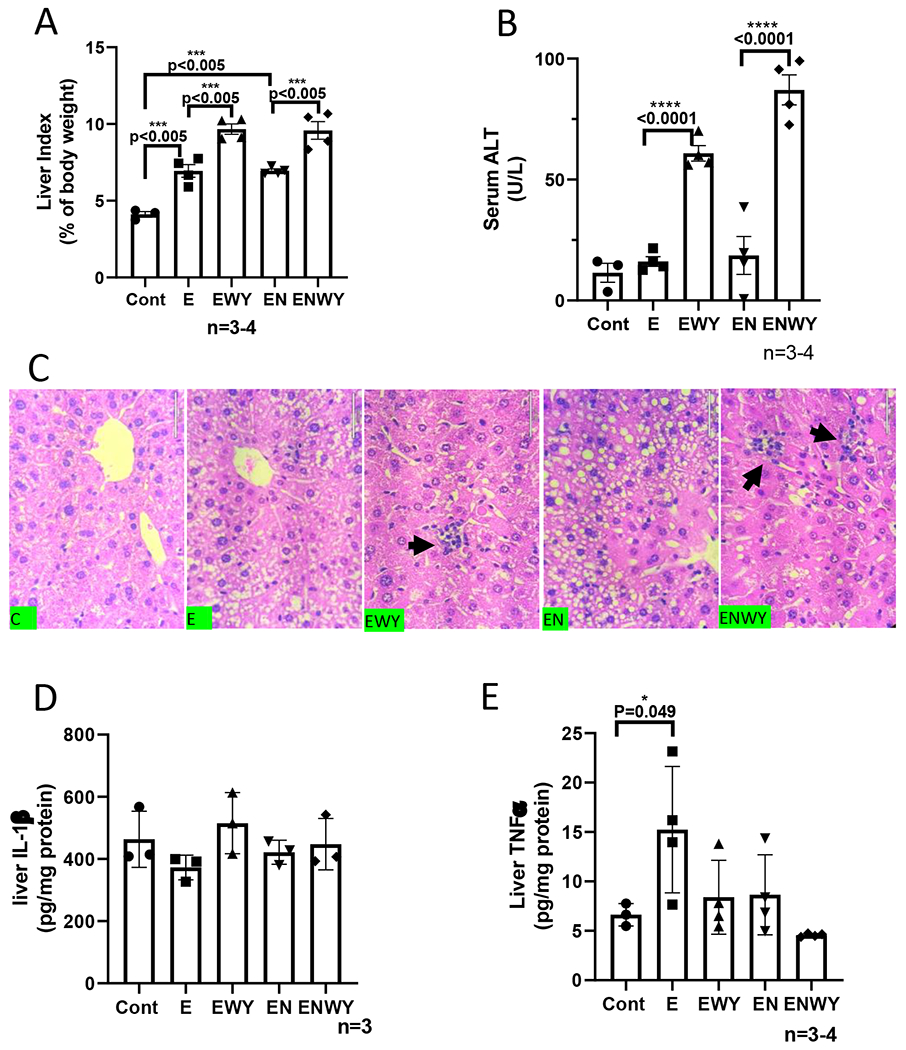
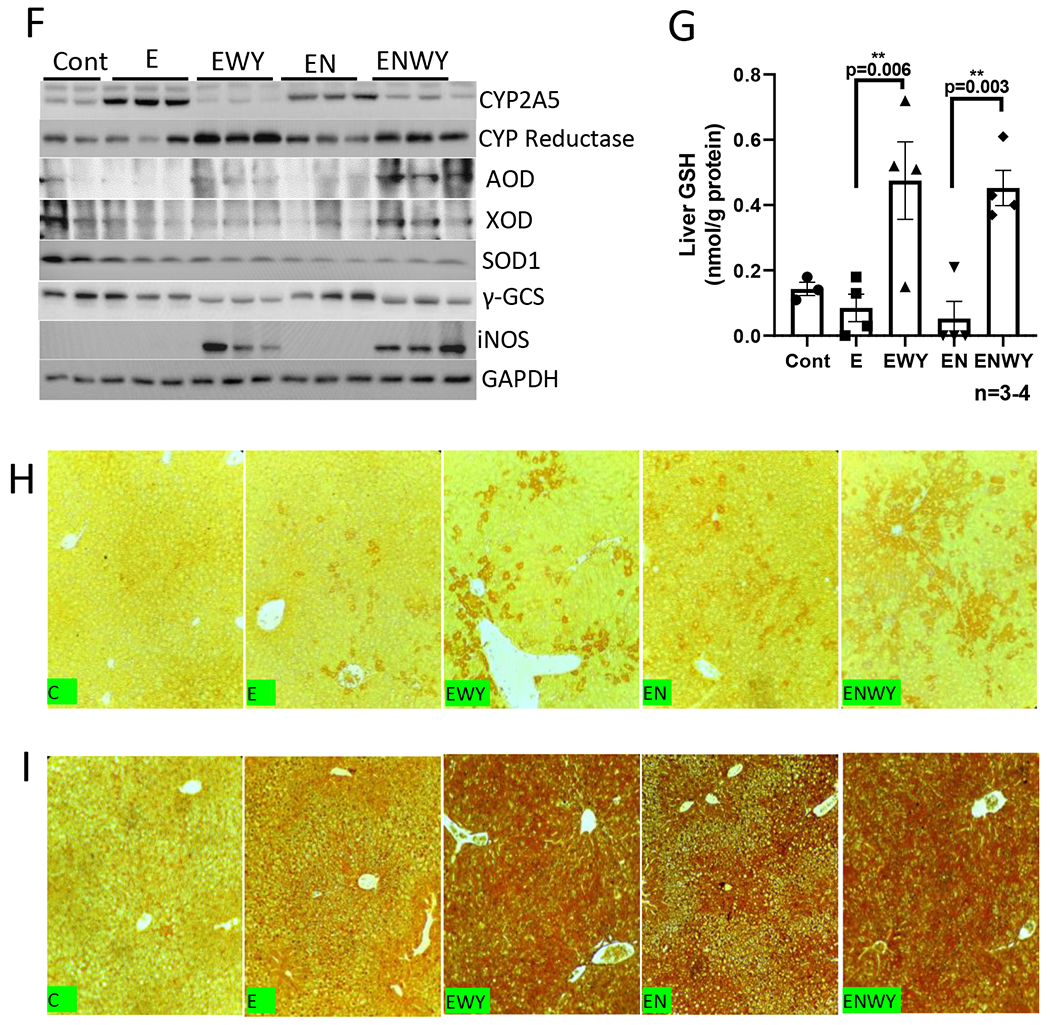
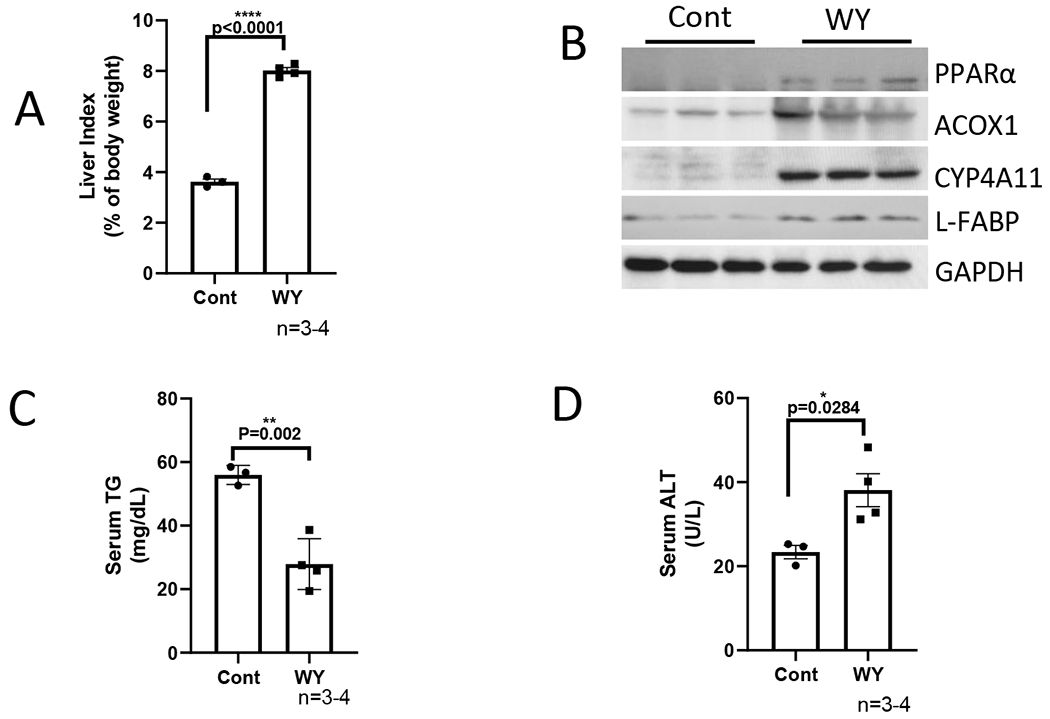
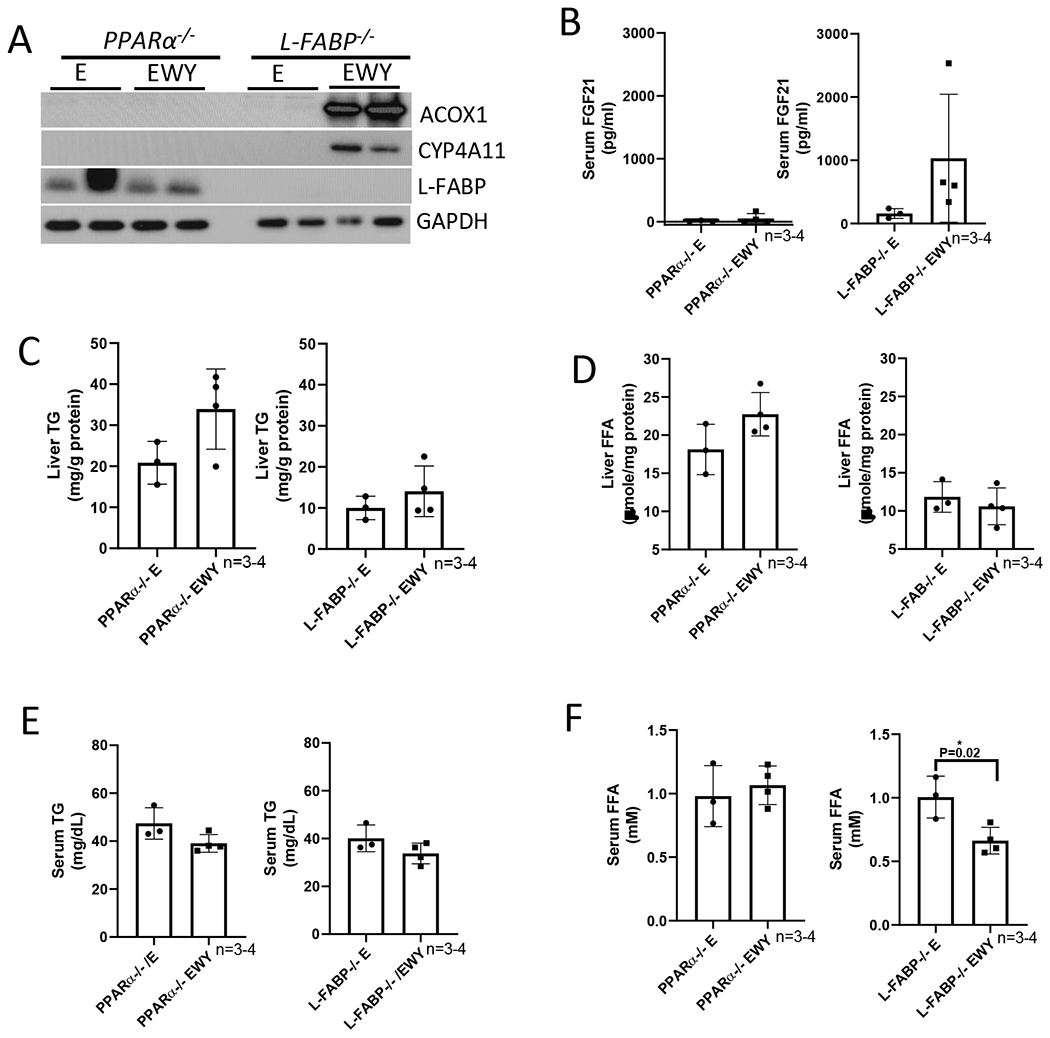
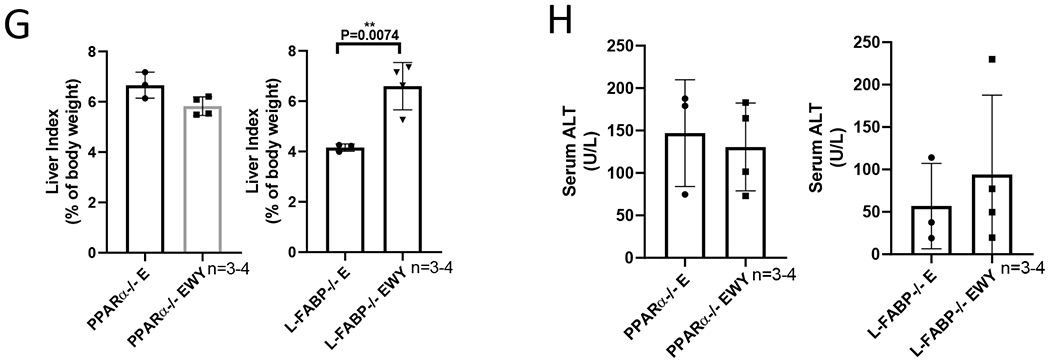
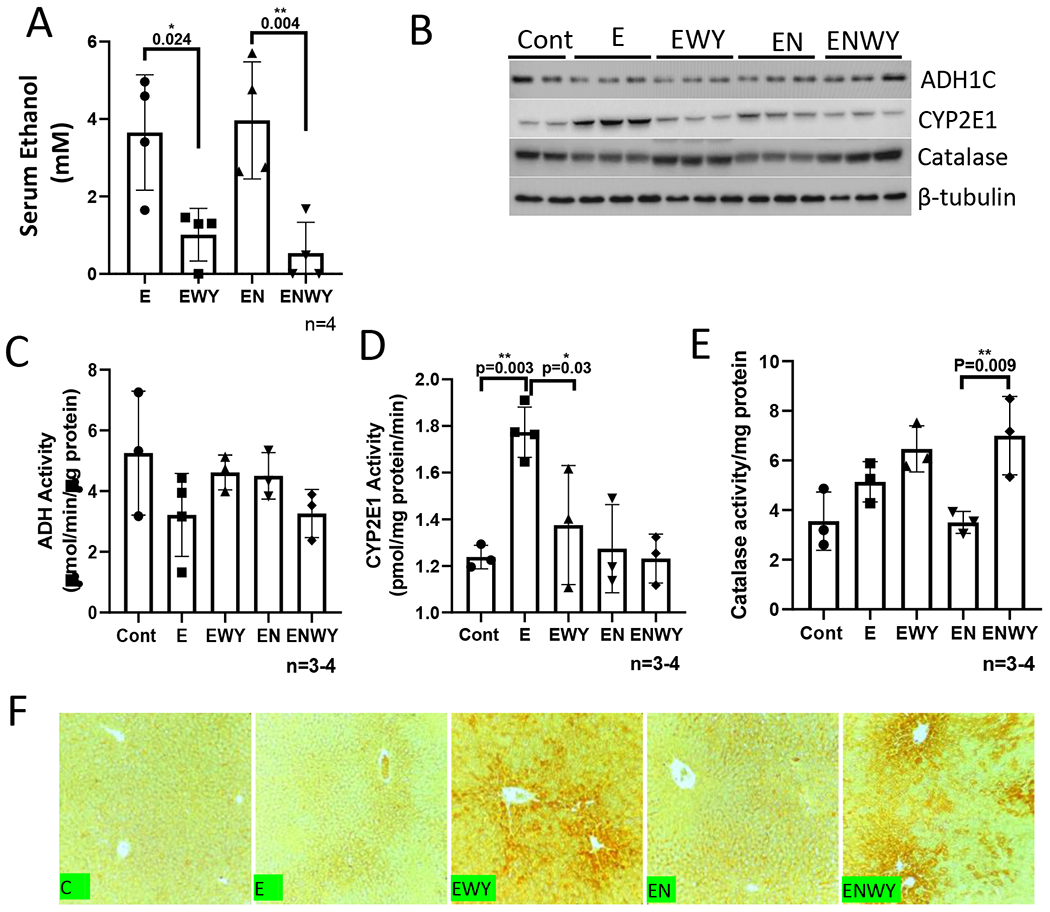
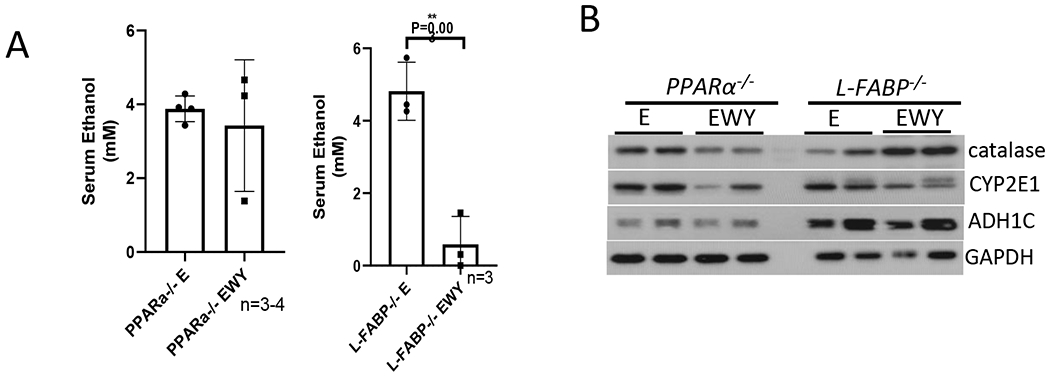
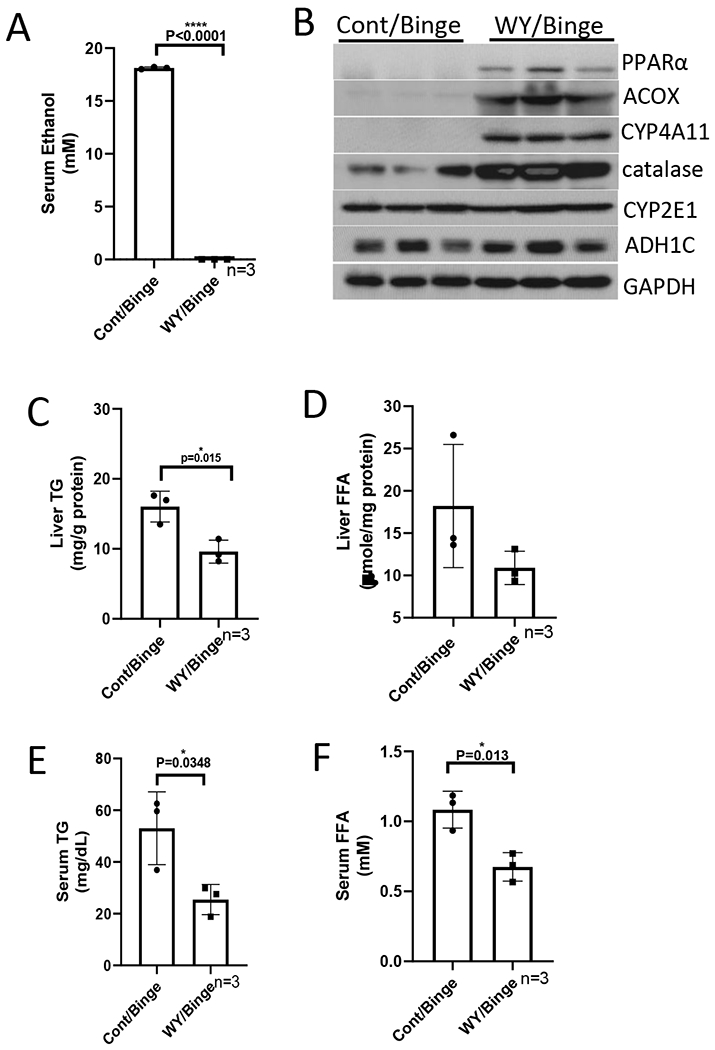
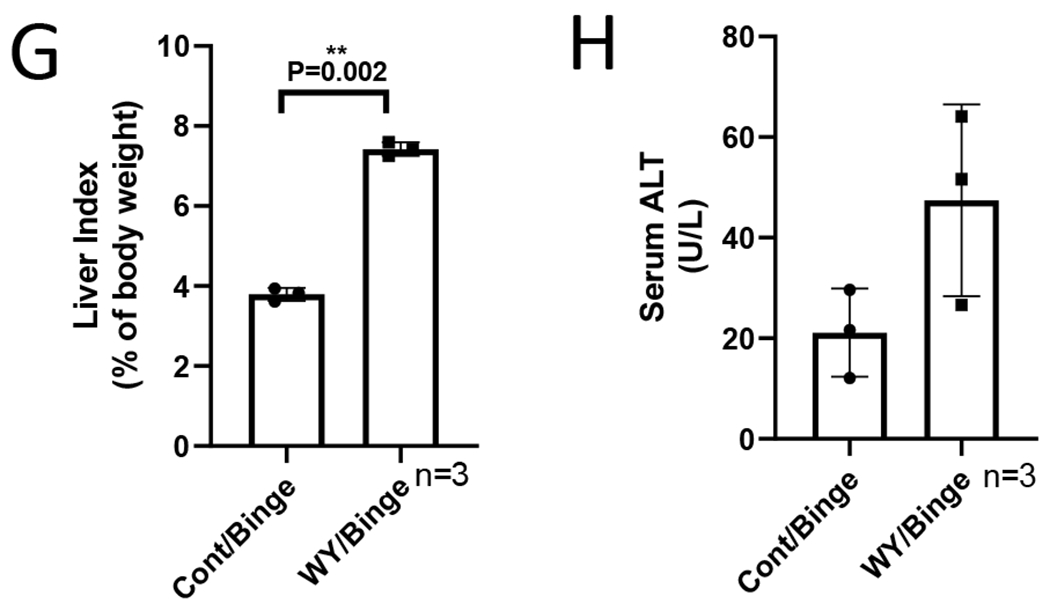
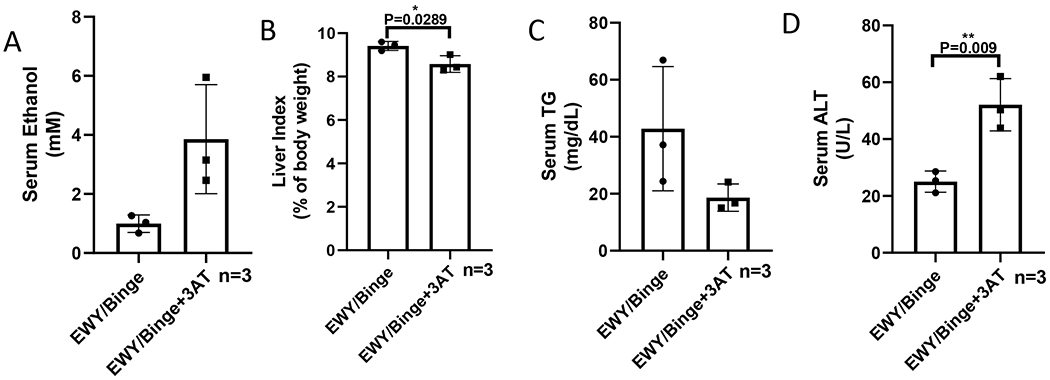
Peroxisome proliferator-activated receptor α (PPARα), a fatty acid oxidation regulator, inhibits alcohol-induced fatty liver (AFL). PPARα agonist WY-14,643 ameliorates AFL. Nicotine enhances AFL. In this study, we investigated whether PPARα activation also blocks nicotine-enhanced AFL. Mice were fed liquid diets containing ethanol in the presence or absence of nicotine, WY-14,643 was added to the above diets at 10 mg/L. The results showed that WY-14,643 blunted AFL and nicotine-enhanced AFL, which was paralleled with striking induction of PPARα target genes. However, serum ALT was dramatically increased by the ethanol/WY-14,643 feeding and was further increased by nicotine/ethanol/WY-14,643 feeding, which was confirmed by necro-inflammation and elevated oxidative stress. Interestingly, serum alcohol levels were dramatically decreased by WY-14,643. Ethanol is mainly metabolized by alcohol dehydrogenase (ADH), cytochrome P450 2E1 (CYP2E1) and catalase. ADH and CYP2E1 were not increased by WY-14,643, but catalase was induced. What is more, injection of catalase inhibitor increased serum ethanol. Decreased serum alcohol, attenuated fatty liver, and enhanced liver injury were not induced by WY-14,643 in mice lacking PPARα. In conclusion, PPARα activation by WY-14,643 attenuates alcohol/nicotine-induced fatty liver but deteriorates ethanol/nicotine-induced liver injury; WY-14,643 enhances ethanol metabolism via induction of catalase.

Keywords: CYP2E1; Fatty liver; Hydrogen peroxide; Inducible nitric oxide synthase (iNOS); Nicotine; Nitrotyrosine (3-NT); Peroxisomal fatty acid oxidation.


Conflict of interest statement

Conflict of Interest: None

Figures

Figure 1
Figure 1
WY-14,643 mixed in ethanol diets induces PPARα pathway and inhibits hepatic TG accumulation induced by ethanol alone or in combination with nicotine. (A) Western blotting analyses for PPARα-regulated ACOX, L-FABP, FGF21, and CYP4A expression in liver. (B) Serum levels of FGF21. (C) Liver contents of TG. (D) liver contents of FFA. (E) Serum levels of TG. (F) Serum levels of FFA. Cont, Control group; E, Ethanol group; EWY, Ethanol/WY-14,643 group; EN, Ethanol/nicotine; ENWY, Ethanol/nicotine/WY-14,643.
Figure 2
Figure 2
WY-14,643 enhances liver injuries induced by ethanol alone or in combination with nicotine. (A) Liver index. (B) Serum levels of ALT. (C) Liver sections with H&E staining. Black arrows indicating necroinflammation foci. (D) Liver contents of IL-1β. (E) Liver contents of TNFα. (F) Western blotting analyses for hepatic expression of CYP2A5, CYP reductase, AOD, XOD, SOD1, γ-GCS and iNOS, (G) Liver contents of total glutathione (GSH). (H) IHC for 3-NT adduct formation. (I) IHC for 4-HNE adduct formation.
Figure 2
Figure 2
WY-14,643 enhances liver injuries induced by ethanol alone or in combination with nicotine. (A) Liver index. (B) Serum levels of ALT. (C) Liver sections with H&E staining. Black arrows indicating necroinflammation foci. (D) Liver contents of IL-1β. (E) Liver contents of TNFα. (F) Western blotting analyses for hepatic expression of CYP2A5, CYP reductase, AOD, XOD, SOD1, γ-GCS and iNOS, (G) Liver contents of total glutathione (GSH). (H) IHC for 3-NT adduct formation. (I) IHC for 4-HNE adduct formation.
Figure 3
Figure 3
WY-14,643 mixed in control diets induces similar levels of hepatomegaly but less levels of serum ALT. (A) Liver index. (B) Western blotting analyses for PPARα-regulated ACOX, L-FABP, and CYP4A expression in liver. (C) Serum levels of TG. (D) Serum levels of ALT.
Figure 4
Figure 4
WY-14,643 feeding-induced changes are not observed in pparα−/− mice and L-fabp−/− mice. (A) Western blotting analyses for PPARα-regulated ACOX, L-FABP, and CYP4A expression in liver. (B) Serum levels of FGF21. (C) Liver contents of TG. (D) Liver contents of FFA. (E) Serum levels of TG. (F) Serum levels of FFA. (G) Liver index. (H) Serum levels of ALT. E, Ethanol diets; EWY, Ethanol diets plus WY-14,643.
Figure 4
Figure 4
WY-14,643 feeding-induced changes are not observed in pparα−/− mice and L-fabp−/− mice. (A) Western blotting analyses for PPARα-regulated ACOX, L-FABP, and CYP4A expression in liver. (B) Serum levels of FGF21. (C) Liver contents of TG. (D) Liver contents of FFA. (E) Serum levels of TG. (F) Serum levels of FFA. (G) Liver index. (H) Serum levels of ALT. E, Ethanol diets; EWY, Ethanol diets plus WY-14,643.
Figure 5
Figure 5
WY-14,643 decreases serum levels of alcohol and induces catalase. (A) Serum levels of ethanol. (B) Western blotting analysis for expression of CYP2E1, catalase, and ADH in liver. (C) Liver ADH activities. (D) Liver CYP2E1 activities. (E) Liver catalase activities. (F) IHC for catalase in liver sections.
Figure 6
Figure 6
WY-14,643 diet-induced alcohol metabolism is observed in L-fabp−/− mice but not in pparα−/− mice. (A) Serum levels of ethanol. (B) Western blotting analysis for liver expression of ADH, CYP2E1, and catalase.
Figure 7
Figure 7
WY-14,643 feeding also escalates serum alcohol clearance in a binge alcohol model. (A) Serum levels of ethanol. (B) Western blotting analyses for PPARα-regulated ACOX, CYP4A, ADH, CYP2E1, and catalase expression in liver. (C) Liver contents of TG. (D) Liver contents of FFA. (E) Serum levels of TG. (F) Serum levels of FFA. (G) Liver index. (H) Serum levels of ALT.
Figure 7
Figure 7
WY-14,643 feeding also escalates serum alcohol clearance in a binge alcohol model. (A) Serum levels of ethanol. (B) Western blotting analyses for PPARα-regulated ACOX, CYP4A, ADH, CYP2E1, and catalase expression in liver. (C) Liver contents of TG. (D) Liver contents of FFA. (E) Serum levels of TG. (F) Serum levels of FFA. (G) Liver index. (H) Serum levels of ALT.
Figure 8
Figure 8
Catalase inhibitor 3-AT elevates serum alcohol and ALT in an acute-on-chronic model. (A) Serum levels of ethanol. (B) Liver index. (C) Serum levels of TG. (D) Serum levels of ALT.
Figure 9
Figure 9
Scheme for peroxisomal oxidation of ethanol. For details, please see the texts in Discussion.

References

    1. Lieber CS. (2005). Metabolism of alcohol. Clin Liver Dis. 9, 1–35. - PubMed
    1. Lu Y, Cederbaum AI. (2008). CYP2E1 and oxidative liver injury by alcohol. Free Radio Biol Med. 44, 723–738. - PMC - PubMed
    1. Lu Y, Zhuge J, Wang X, Bai J, Cederbaum AI. Cytochrome P450 2E1 contributes to ethanol-induced fatty liver in mice. Hepatology. 2008. May;47(5): 1483–94 - PubMed
    1. Lu Y, Wu D, Wang X, Ward SC, Cederbaum AI. Chronic alcohol-induced liver injury and oxidant stress are decreased in cytochrome P4502E1 knockout mice and restored in humanized cytochrome P4502E1 knock-in mice. Free Radio Biol Med. 2010. November 15;49(9): 1406–16. - PMC - PubMed
    1. Lu Y, Zhang XH, Cederbaum AI. (2012). Ethanol induction of CYP2A5: role of CYP2E1-ROS-Nrf2 pathway. Toxicol Sci. 128, 427–438. - PMC - PubMed

Publication types