. 2021 Apr 23;13(1):68.
doi: 10.1186/s13073-021-00864-4.

Finding associations in a heterogeneous setting: statistical test for aberration enrichment

Affiliations

Finding associations in a heterogeneous setting: statistical test for aberration enrichment

Aziz M Mezlini et al. Genome Med. .

Abstract

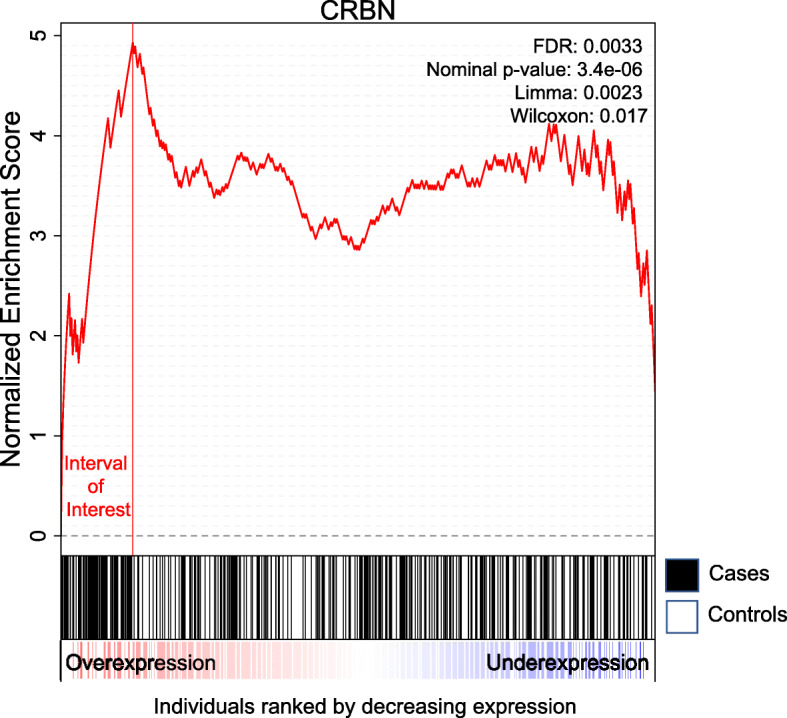
Most two-group statistical tests find broad patterns such as overall shifts in mean, median, or variance. These tests may not have enough power to detect effects in a small subset of samples, e.g., a drug that works well only on a few patients. We developed a novel statistical test targeting such effects relevant for clinical trials, biomarker discovery, feature selection, etc. We focused on finding meaningful associations in complex genetic diseases in gene expression, miRNA expression, and DNA methylation. Our test outperforms traditional statistical tests in simulated and experimental data and detects potentially disease-relevant genes with heterogeneous effects.


Conflict of interest statement

The authors declare that they have no competing interests.

Figures

Fig. 1
Fig. 1
Example of a computed enrichment score. All individuals were ranked by decreasing expression of the CRBN gene. The x axis corresponds to the ranked individuals. In the second panel, cases correspond to black vertical bars and controls are white vertical bars. The enrichment score goes up whenever we encounter a case and goes down whenever we encounter a control. The maximum standardized score reached is 4.93 and corresponds to an uncorrected p value of 3.4E −06 and FDR of 0.003 for our test. There are 52 cases (19% of all cases) and 9 controls (4% of all controls) among the individuals to the left of the maximum. This was taken from the Alzheimer data in the “Alzheimer and Parkinson disease” section and it corresponds to the CRBN expression distribution. Note that Limma and Wilcoxon do not detect this gene as significant when simultaneously testing all 25,000 genes (uncorrected p values are respectively 0.002 and 0.01)
Fig. 2
Fig. 2
Examples of considered scenarios for aberration enrichment pattern. r controls the proportion of individuals affected among the cases and d is the magnitude of the effect within those individuals. a r=0.05, d=3, n=500b r=0.15, d=1.5, n=500. Note that the aberration enrichment pattern often appears as a heavier tail for cases rather than a secondary cluster of cases especially for lower values of r. Intuitively, d affects the location of the red area relative to the mean of the distribution while r more specifically affects the size of the red area
Fig. 3
Fig. 3
Ability of the different tests to detect the association, depending on simulations parameters n (sample size) and r (proportion of affected cases). In a, a nominal p value threshold of 0.05 is used. In b, a lower p value threshold of 2×10⁻⁶ was used to mimic a realistic data analysis scenario where correction for multiple tests is required. We compare our test (O), the Levene test (L), t-test (T), and Wilcoxon (W). A method is able to detect the signal if the p value is lower than the threshold in the majority of 200 reruns. Here we show the results for d=3. White is for the set of experiments where no method detected the signal, vermillion (red-orange) is when only our test detected the signal, light blue is when our test and the Levene test both detected it, gray is when our method, the t-test and the Levene test detected it and black is when all considered methods can detect the signal (including the Wilcoxon test)
Fig. 4
Fig. 4
Comparison of the p value magnitude between our test and at-test test, b Levene test, c Wilcoxon test, depending on the simulation parameters n (sample size) and r (proportion of affected cases). Here we show the results for d=3. The colors indicate the difference in log10 between the p values returned by both method. For example b indicates that our test’s p value is two orders of magnitude smaller (×10−2) than that of the Levine test. We capped the maximal difference at 4 for visual clarity. We ran 108 permutations to compute the p values for our test; therefore, we set the minimal p value to 10−7 for all methods in order to avoid artifacts of p values estimation accuracy
Fig. 5
Fig. 5
Ability of different tests to detect the simulated association, depending on simulations parameters n (sample size), r (proportion of affected cases), and d. p value threshold of 2×10⁻⁶. A method is able to detect the signal if the p value is lower than the threshold in the majority of 200 reruns. We compare our test (O), the Levene test (L), t-test (T), and Wilcoxon (W) test
Fig. 6
Fig. 6
Results under less heterogeneity, i.e. higher values of r.a Ability of the different tests to detect the association for higher values of r. A method is able to detect the signal if the p value is lower than the threshold in the majority of 200 reruns. Here we show the results for d=3. We compare our test (O), the Levene test (L), t-test (T), and Wilcoxon (W) test. b Comparison of the p value magnitude between our test and the best out oft-test, Levene test, and Wilcoxon test, depending on simulations parameters n (sample size) and r (proportion of affected cases). Here we show the results for d=3. The colors indicate the difference in log10 between the p values returned by both method. For example b indicates that our test’s p value is two orders of magnitude (100 times) smaller than that of the Levine test. We capped the maximal difference at 4 for visual clarity
Fig. 7
Fig. 7
Results on Alzheimer’s disease. a Genes differentially expressed or aberration enriched in Alzheimer versus healthy controls, discovered using our test versus Limma. The genes that have FDR≤0.1 for either method are plotted. Gene names are added for all the significant genes by our method and the top 10 heterogeneous associations (r≤0.3). Red lines correspond to the Bonferroni significance threshold. b Distribution of expression levels in cases and controls for the gene CRBN discovered by our test. c QQ plot of the p values returned by our test on the Alzheimer data. d QQ plot of the p values returned by our test after randomly permuting the samples
Fig. 8
Fig. 8
Gene expression associations in IBD, inflamed versus non-inflamed samples, discovered using our test versus Limma. The genes that have FDR ≤0.1 for either method are plotted. Gene names are added for all the significant genes by our method and the top 10 heterogeneous associations (r≤0.3). Red lines correspond to the Bonferroni significance threshold

References

    1. Minn AJ, Gupta GP, Siegel PM, Bos PD, Shu W, Giri DD, Viale A, Olshen AB, Gerald WL, Massagué J. Genes that mediate breast cancer metastasis to lung. Nature. 2005;436(7050):518. doi: 10.1038/nature03799. - DOI - PMC - PubMed
    1. Chen R, Morgan AA, Dudley J, Deshpande T, Li L, Kodama K, Chiang AP, Butte AJ. Fitsnps: highly differentially expressed genes are more likely to have variants associated with disease. Genome Biol. 2008;9(12):170. doi: 10.1186/gb-2008-9-12-r170. - DOI - PMC - PubMed
    1. Zhao J, Yang T-H, Huang Y, Holme P. Ranking candidate disease genes from gene expression and protein interaction: a katz-centrality based approach. PloS ONE. 2011;6(9):e24306. doi: 10.1371/journal.pone.0024306. - DOI - PMC - PubMed
    1. Ritchie ME, Phipson B, Wu D, Hu Y, Law CW, Shi W, Smyth GK. Limma powers differential expression analyses for rna-sequencing and microarray studies. Nucleic Acids Res. 2015;43(7):47–47. doi: 10.1093/nar/gkv007. - DOI - PMC - PubMed
    1. Vogelstein B, Kinzler KW. The multistep nature of cancer. Trends Genet. 1993;9(4):138–41. doi: 10.1016/0168-9525(93)90209-Z. - DOI - PubMed

Publication types

LinkOut - more resources