. 2021 Apr 23;7(17):eabg4038.
doi: 10.1126/sciadv.abg4038. Print 2021 Apr.

Disrupting tumor onset and growth via selective cell tagging (SeCT) therapy

Affiliations

Disrupting tumor onset and growth via selective cell tagging (SeCT) therapy

Kenward Vong et al. Sci Adv. .

Abstract

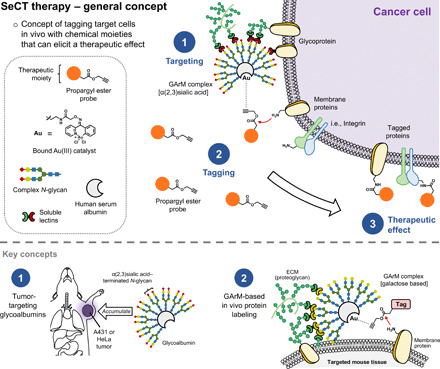
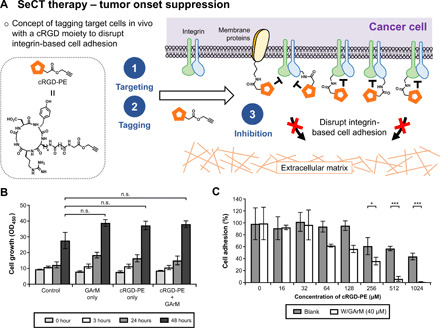
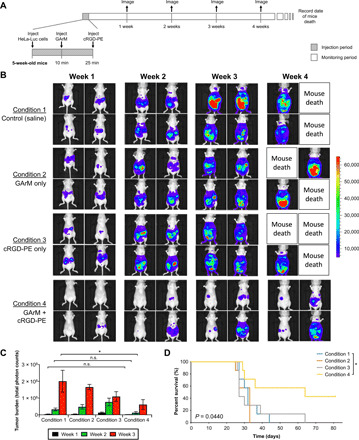
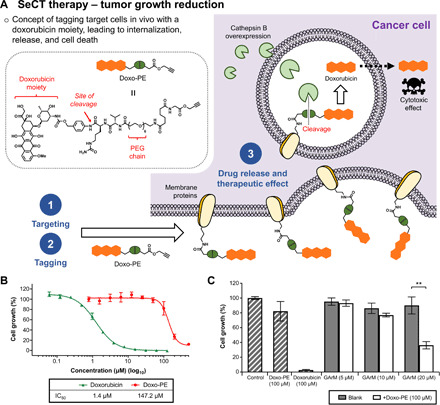
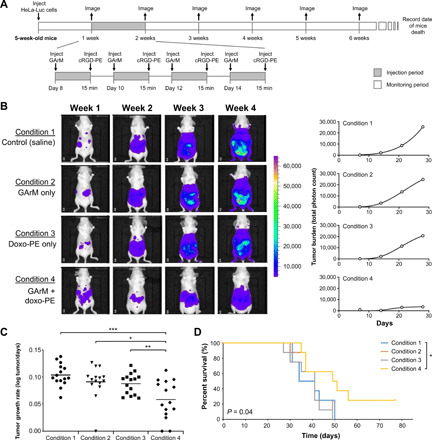
This study presents the early framework of selective cell tagging (SeCT) therapy, which is the concept of preferentially labeling specific cells in vivo with chemical moieties that can elicit a therapeutic response. Using glycosylated artificial metalloenzyme (GArM)-based protein labeling, this study reports two separate functional strategies. In one approach, early tumor onset can be suppressed by tagging cancer cells in living mice with an integrin-blocking cyclic-Arg-Gly-Asp (cRGD) moiety, thereby disrupting cell adhesion onto the extracellular matrix. In another approach, tumor growth in mice can be reduced by tagging with a cytotoxic doxorubicin moiety. Subsequent cell death occurs following internalization and drug release. Overall, experiments have shown that mouse populations receiving the mixture of SeCT labeling reagents exhibited a significant delay/reduction in tumor onset and growth compared with controls. Highlighting its adaptability, this work represents a foundational step for further development of SeCT therapy and its potential therapeutic applications.


Figures

Fig. 1
Fig. 1. SeCT therapy is a concept based on tagging specific cells in vivo with chemical moieties of therapeutic benefit.
The approach presented in this study is based on two key areas of research. The first is the development of tumor-targeting glycoalbumins. Proteins decorated with certain assemblies of complex N-glycans (i.e., α(2,3)sialic acid–terminated glycans) have been shown to exhibit preferential accumulation to certain tumor types in mice. The second is the development of gold-mediated, PE-based protein labeling. This reaction has allowed GArM complexes to be used for in vivo protein labeling.
Fig. 2
Fig. 2. Fluorescence-activated cell-sorting studies to validate the ability of the GArM complex to selectively accumulate toward HeLa cancer cells over peritoneal macrophages.
(A) Flow cytometry histograms of HeLa cells treated with and without GArM. (B) Flow cytometry histograms of macrophages (extracted from mice abdominal cavities) treated with and without GArM. (C) Flow cytometry histograms for the mixture of HeLa-V and macrophages cells incubated with and without GArM. For all flow cytometry studies, GArM is bound with a coumarin-linked Au catalyst, which forms a fluorescent protein complex that can be measured at λEx = 405 nm/λEm = 470 nm. Venus (V) protein can be measured at λEx = 515 nm/λEm = 528 nm.
Fig. 3
Fig. 3. Tumor onset suppression via cRGD-based SeCT therapy.
(A) Using the cRGD-PE reagent, this application is based on the indiscriminate tagging of cancer cell surface proteins with a cRGD moiety. Overexpressed integrins on cell surfaces will be exposed to a higher localized concentration of the inhibitor, leading to the disruption of integrin-based cell adhesion and the reduction in tumor onset and progression. (B) HeLa cell proliferation assay showing the nontoxic nature of the SeCT labeling reagents at various time points (0, 3, 24, and 48 hours) compared with a negative control. P values were determined by one-way analysis of variance (ANOVA). (C) Cell adhesion assay of HeLa cells to fibronectin-coated plates treated with SeCT labeling reagents. P values were determined by paired t test. All numerical data are presented as means ± SEM of three replicates. *P < 0.05, **P < 0.01, and ***P < 0.001; n.s., not significant.
Fig. 4
Fig. 4. Tumor onset suppression via cRGD-based SeCT therapy in mice.
(A) Experimental timeline that details the injection schedule of HeLa-Luc cells and the labeling reagents. (B) IVIS imaging results showing a representative set of mice monitored for the onset and progression of HeLa tumors over a period of 4 weeks. (C) Comparison and quantification of bioluminescent signals emitted by HeLa-Luc cancer cells in IVIS imaging of mice (n = 7) over a period of 3 weeks. P values were determined by one-way ANOVA. (D) Comparison of mice survival for various conditions monitored over a period of 81 days. P values were determined using the log-rank test. All numerical data are presented as means ± SEM. *P < 0.05, **P < 0.01, and ***P < 0.001.
Fig. 5
Fig. 5. Tumor growth reduction via doxorubicin-based SeCT therapy.
(A) Using the doxo-PE reagent, this application is based on the indiscriminate tagging of cancer cell surface proteins with a doxorubicin moiety. Following internalization, the Val-Cit-PAB linker is designed to be cleaved by overexpressed cathepsin B, leading to drug release and eventual cell death. (B) Cytotoxicity assay against HeLa cells showed that doxo-PE is roughly 100-fold less toxic than its active agent, doxorubicin. (C) Cytotoxicity assay that shows the combination of the SeCT labeling reagents (doxo-PE/GArM) causes significantly higher HeLa cell death compared with the addition of individual reagents (doxo-PE only or GArM only). P values were determined by paired t test. All numerical data are presented as means ± SEM of three replicates. *P < 0.05, **P < 0.01, and ***P < 0.001. IC50, median inhibitory concentration.
Fig. 6
Fig. 6. Tumor growth reduction via doxorubicin-based SeCT therapy in mice.
(A) Experimental timeline that details tumor development and the injection schedule of the labeling reagents. (B) IVIS imaging results to highlight tumor growth for a representative mouse from each group. Detected bioluminescent signals were then used to construct tumor growth curves over time, where the mean slope can be used to represent the rate of tumor growth. (C) Comparison of the calculated tumor growth rates for mice (n = 15) over a period of 3 weeks. P values were determined using a paired sample t test. (D) Comparison of mice survival for various conditions monitored over a period of 77 days. P values were determined using the log-rank test. *P < 0.05, **P < 0.01, and ***P < 0.001.

References

    1. Yan Q., Bruchez M. P., Advances in chemical labeling of proteins in living cells. Cell Tissue Res. 360, 179–194 (2015). - PMC - PubMed
    1. Ernst R. J., Krogager T. P., Maywood E. S., Zanchi R., Beránek V., Elliott T. S., Barry N. P., Hastings M. H., Chin J. W., Genetic code expansion in the mouse brain. Nat. Chem. Biol. 12, 776–778 (2016). - PMC - PubMed
    1. Chen Y., Ma J., Lu W., Tian M., Thauvin M., Yuan C., Volovitch M., Wang Q., Holst J., Liu M., Vriz S., Ye S., Wang L., Li D., Heritable expansion of the genetic code in mouse and zebrafish. Cell Res. 27, 294–297 (2017). - PMC - PubMed
    1. Tsukiji S., Miyagawa M., Takaoka Y., Tamura T., Hamachi I., Ligand-directed tosyl chemistry for protein labeling in vivo. Nat. Chem. Biol. 5, 341–343 (2009). - PubMed
    1. Tamura T., Kioi Y., Miki T., Tsukiji S., Hamachi I., Fluorophore labeling of native FKBP12 by ligand-directed tosyl chemistry allows detection of its molecular interactions in vitro and in living cells. J. Am. Chem. Soc. 135, 6782–6785 (2013). - PubMed

Publication types