. 2021 Apr 23;7(17):eabf6106.
doi: 10.1126/sciadv.abf6106. Print 2021 Apr.

The structural plasticity of nucleic acid duplexes revealed by WAXS and MD

Affiliations

The structural plasticity of nucleic acid duplexes revealed by WAXS and MD

Weiwei He et al. Sci Adv. .

Abstract

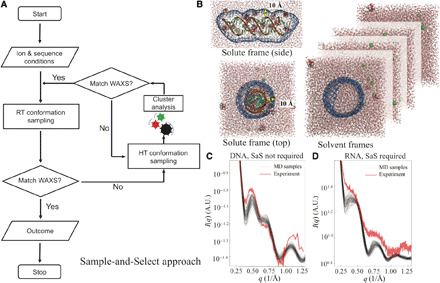
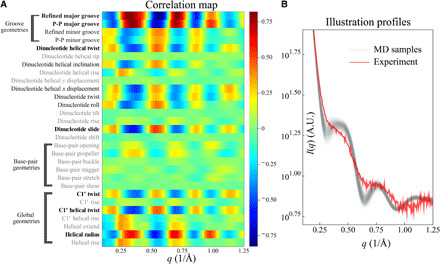
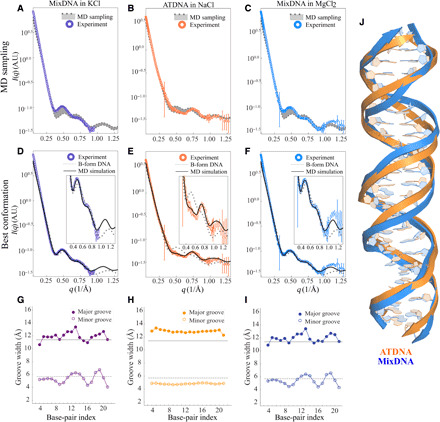
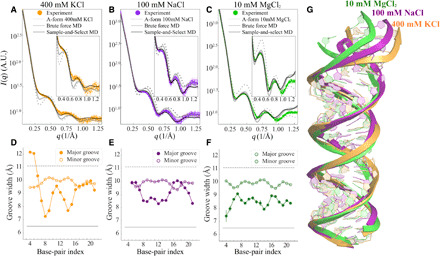
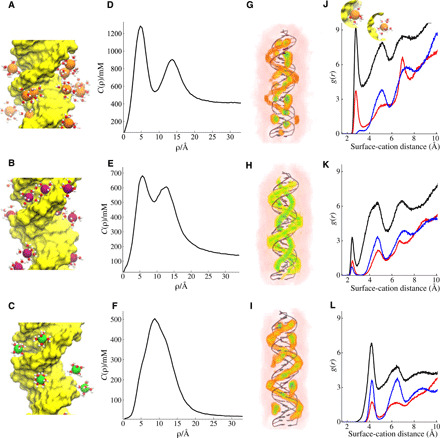
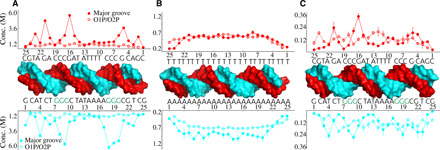
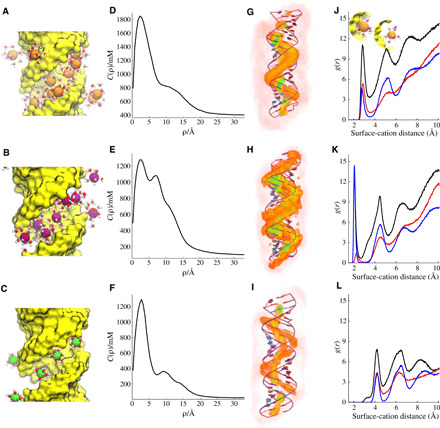
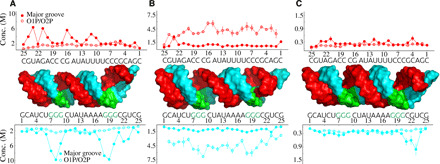
Double-stranded DNA (dsDNA) and RNA (dsRNA) helices display an unusual structural diversity. Some structural variations are linked to sequence and may serve as signaling units for protein-binding partners. Therefore, elucidating the mechanisms and factors that modulate these variations is of fundamental importance. While the structural diversity of dsDNA has been extensively studied, similar studies have not been performed for dsRNA. Because of the increasing awareness of RNA's diverse biological roles, such studies are timely and increasingly important. We integrate solution x-ray scattering at wide angles (WAXS) with all-atom molecular dynamics simulations to explore the conformational ensemble of duplex topologies for different sequences and salt conditions. These tightly coordinated studies identify robust correlations between features in the WAXS profiles and duplex geometry and enable atomic-level insights into the structural diversity of DNA and RNA duplexes. Notably, dsRNA displays a marked sensitivity to the valence and identity of its associated cations.


Figures

Fig. 1
Fig. 1. The computational approach used to resolve the structures of nucleic acid duplexes.
(A) SaS approach with enhanced sampling at higher temperature and selection based on agreement with experimental WAXS profiles. The feedback loop is triggered when the customized metric in Eq. 6 of all the sampled conformations is greater than 10.0. (B) Illustration of the molecular envelope constructed from a 3D probability density isosurface 10 Å from the RNA surface to encompass the solvent/ion shell. The same envelope was applied to solvent systems to compute the scattering amplitudes to be subtracted. (C) The WAXS profiles from experiment (red) and MD simulations with starting B-form conformation (black) of DNA duplex. Here, the sampling captures features of the experimental data. The selection feedback is not necessary. (D) Same as (C) for an RNA duplex. Here, none of the WAXS profiles from MD simulations (black) agree with experimental data (red). The SaS approach is required to enhance sampling to identify a plausible starting conformation.
Fig. 2
Fig. 2. Mapping WAXS features to real space structural details.
(A) The correlation map between RNA duplex geometries and normalized deviations between experiment and simulation (Eq. 11). The helical parameters with high correlations (∣ρ∣ > 0.5) are highlighted in boldface. (B) WAXS profiles of intermediate MD conformations and experimental data for interpreting the correlation map. Using the correlation map, we qualitatively interpret conformations that correspond to experimental data, despite the mismatch at this intermediate stage. For the profiles shown, the models clearly do not accurately recapitulate features at q values near 0.25 and 0.6 Å−1, suggesting that the intermediate simulations do not capture the correct groove geometries and more rounds of SaS are required. See the main text for details. A.U., arbitrary units.
Fig. 3
Fig. 3. Solution x-ray scattering profiles of DNA duplexes from experiment and simulation at different salt conditions.
(A) MixDNA duplex in 400 mM KCl, (B) ATDNA in 100 mM NaCl, and (C) MixDNA in 10 mM MgCl2. Conformations sampled from MD simulations (without SaS approach) are shown in the shaded area. (D) to (F) are the same comparison when the experimental profile is compared against the best-fitting conformation (black) and canonical B-form DNA duplex (gray dashed line), respectively. The insets highlight the differences between the profiles at the wide angle. The widths of the major and minor grooves for MixDNA in KCl, ATDNA in NaCl, and MixDNA in MgCl2 are shown in (G) to (I), respectively. In these panels, the solid gray and dashed gray lines correspond to the canonical B-form major and minor GWs, respectively. The x axis gives the residue positions. (J) The comparison of dsDNA conformations obtained from the best-matching models highlights structural variations.
Fig. 4
Fig. 4. Solution x-ray scattering profiles of MixRNA duplexes from experiment and simulation at different salt conditions.
(A) The duplex in 400 mM KCl, (B) 100 mM NaCl, and (C) 10 mM MgCl2, respectively. The dashed gray curve represents the computed profiles from canonical A-form RNA, while the solid gray curve represents the best agreement from MD sampled pool, where the starting conformation is A-form. The black curves show the agreement after SaS approach is used. Traces of major/minor GWs computed from best-fitted conformations for each salt condition, (D) 400 mM KCl, (E) 100 mM NaCl, and (F) 10 mM MgCl2, respectively. The x axis gives the residue positions. The major GW exhibits residue specificity that affects overall RNA duplex conformation. This feature is detectable to WAXS because of its disruption of the structural periodicity in duplex topology. (G) The alignment of conformations in different salt conditions shows structural variations.
Fig. 5
Fig. 5. Cation distributions around DNA duplexes computed from simulations.
(A to C) A snapshot from each simulation setup where only the cations in the vicinity of the DNA with their first solvation shell water molecules are shown. (A) MixDNA in 400 mM KCl, (B) ATDNA in 120 mM NaCl, and (C) MixDNA in 10 mM MgCl2. The average distribution of cations is monitored by cylindrical concentration profiles along the long axis of dsDNA. The solid line represents c(ρ) as a function of the distance from the central axis of the duplex. (D) KCl, (E) NaCl, and (F) MgCl2. 3D ion density plots colored from white (low) to red to green (high) and shown in the same order as (G) KCl, (H) NaCl, and (I) MgCl2, respectively. (J) Radial distribution function of K+ ions from the duplex surface. Different colors represent correlation of cations with different parts of the duplex; (black) with the whole duplex atoms, (red) with major groove, and (blue) with backbone phosphates. The inset in (J) depicts dehydrated (left, first peak) and hydrated (right, second peak) bound states. (K and L) Same as (J), but this time for Na+ and Mg2+, respectively.
Fig. 6
Fig. 6. Analysis of the localization of cations to individual residues computed for dsDNA duplexes at different salt conditions.
The binding is partitioned into two groups: binding to the major groove and binding to phosphate group oxygens, O1P and O2P (see Materials and Methods for details). (A) MixDNA in KCl, (B) ATDNA in NaCl, and (C) MixDNA in MgCl2.
Fig. 7
Fig. 7. Cation distributions around the MixRNA duplex computed from simulations.
(A to C) A snapshot from each simulation setup where only the cations in the vicinity of the RNA are shown with their first solvation shell water molecules. (A) 400 mM KCl, (B) 100 mM NaCl, and (C) 10 mM MgCl2. The average distribution of cations is monitored by cylindrical concentration profiles along the long axis of dsRNA. The solid line represents c(ρ) as a function of the distance from the central axis of the duplex with the same order. (D) KCl, (E) NaCl, and (F) MgCl2. 3D ion density plots colored from white (low) to red to green (high) and shown in the same order as (G) KCl, (H) NaCl, and (I) MgCl2, respectively. (J) Radial distribution function of K+ ions from the duplex surface. Different colors represent correlation of cations with different parts of the duplex: (black) with the whole duplex atoms, (red) with major groove, and (blue) with backbone phosphate. The inset in (J) depicts dehydrated (left, first peak) and hydrated (right, second peak) bound states. (K to L) Same as (J), but this time for Na+ and Mg2+, respectively.
Fig. 8
Fig. 8. Analysis of the localization of cations to individual residues computed for MixRNA at different salt conditions.
The binding is partitioned between two groups: major groove binding and binding to phosphate group oxygens. (A) KCl, (B) NaCl, and (C) MgCl2.
Fig. 9
Fig. 9. Nucleobase-level bound cation analysis for MixRNA.
(A) RNA in KCl, (B) NaCl, and (C) MgCl2. (D) The binding strength comparison of monovalent ions to G tracts (solid bars) and non–G tracts (empty bars). ρmax represents the relative binding strength of cation obtained from the maximum of radial distribution function.

Similar articles

Cited by

References

    1. Holbrook S. R., Sussman J. L., Warrant R. W., Church G. M., Kim S.-H., RNA-ligand interactions:(I) magnesium binding sites in yeast tRNAPhe. Nucleic Acids Res. 4, 2811–2820 (1977). - PMC - PubMed
    1. Conn G. L., Draper D. E., Lattman E. E., Gittis A. G., Crystal structure of a conserved ribosomal protein-RNA complex. Science 284, 1171–1174 (1999). - PubMed
    1. Bukhman Y. V., Draper D. E., Affinities and selectivities of divalent cation binding sites within an RNA tertiary structure. J. Mol. Biol. 273, 1020–1031 (1997). - PubMed
    1. Pastor N., The B- to A-DNA transition and the reorganization of solvent at the DNA surface. Biophys. J. 88, 3262–3275 (2005). - PMC - PubMed
    1. Lu X.-J., Shakked Z., Olson W. K., A-form conformational motifs in ligand-bound DNA structures. J. Mol. Biol. 300, 819–840 (2000). - PubMed

Publication types

LinkOut - more resources