Human Nasal and Lung Tissues Infected Ex Vivo with SARS-CoV-2 Provide Insights into Differential Tissue-Specific and Virus-Specific Innate Immune Responses in the Upper and Lower Respiratory Tract
- PMID: 33893170
- PMCID: PMC8223920
- DOI: 10.1128/JVI.00130-21
Human Nasal and Lung Tissues Infected Ex Vivo with SARS-CoV-2 Provide Insights into Differential Tissue-Specific and Virus-Specific Innate Immune Responses in the Upper and Lower Respiratory Tract
Abstract
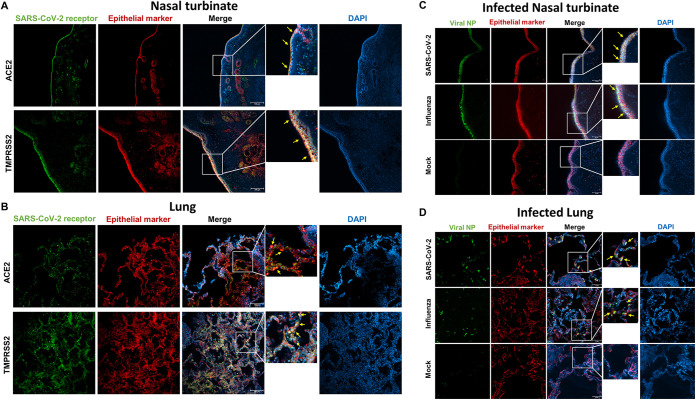
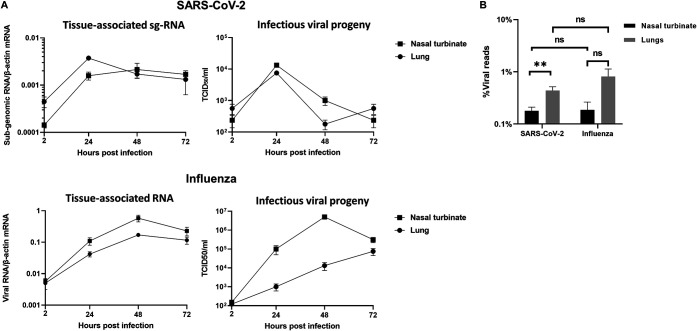
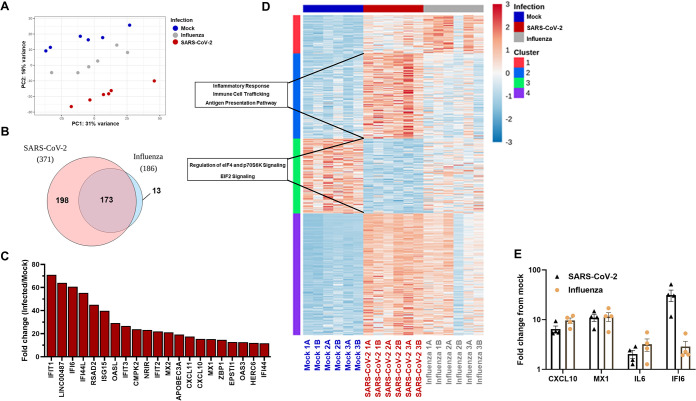
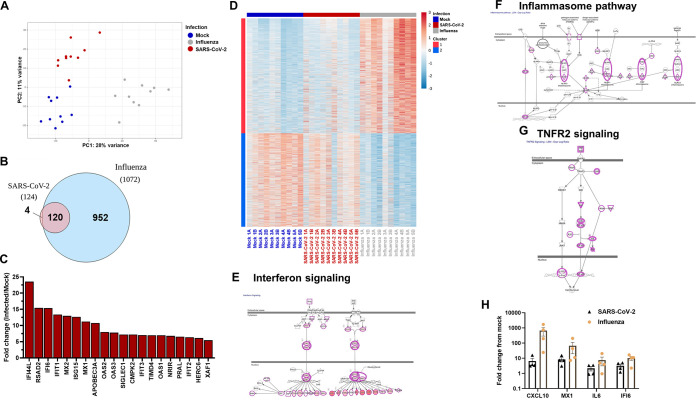
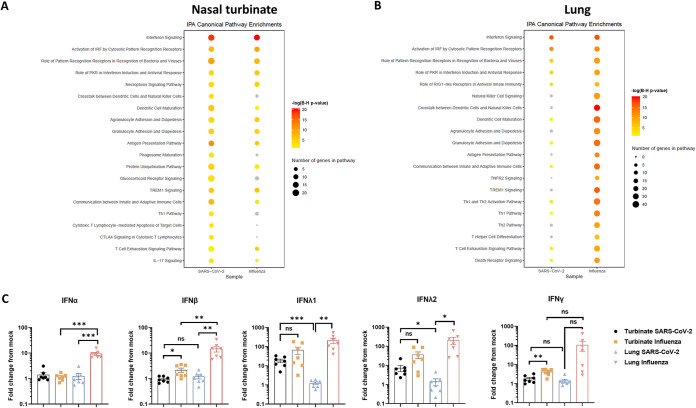
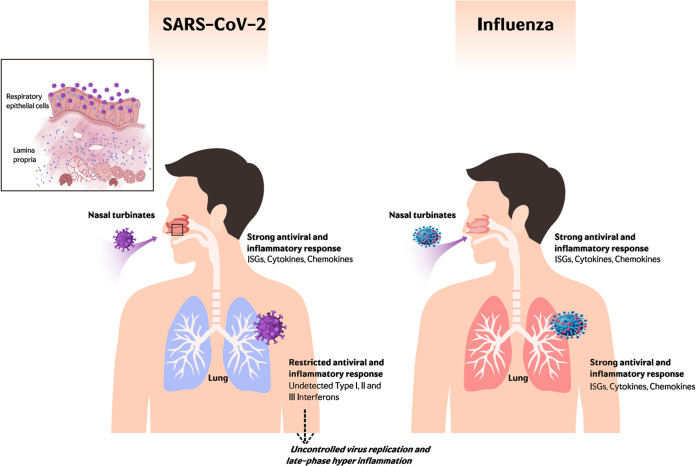
The nasal mucosa constitutes the primary entry site for respiratory viruses, including severe acute respiratory syndrome coronavirus 2 (SARS-CoV-2). While the imbalanced innate immune response of end-stage coronavirus disease 2019 (COVID-19) has been extensively studied, the earliest stages of SARS-CoV-2 infection at the mucosal entry site have remained unexplored. Here, we employed SARS-CoV-2 and influenza virus infection in native multi-cell-type human nasal turbinate and lung tissues ex vivo, coupled with genome-wide transcriptional analysis, to investigate viral susceptibility and early patterns of local mucosal innate immune response in the authentic milieu of the human respiratory tract. SARS-CoV-2 productively infected the nasal turbinate tissues, predominantly targeting respiratory epithelial cells, with a rapid increase in tissue-associated viral subgenomic mRNA and secretion of infectious viral progeny. Importantly, SARS-CoV-2 infection triggered robust antiviral and inflammatory innate immune responses in the nasal mucosa. The upregulation of interferon-stimulated genes, cytokines, and chemokines, related to interferon signaling and immune-cell activation pathways, was broader than that triggered by influenza virus infection. Conversely, lung tissues exhibited a restricted innate immune response to SARS-CoV-2, with a conspicuous lack of type I and III interferon upregulation, contrasting with their vigorous innate immune response to influenza virus. Our findings reveal differential tissue-specific innate immune responses in the upper and lower respiratory tracts that are specific to SARS-CoV-2. The studies shed light on the role of the nasal mucosa in active viral transmission and immune defense, implying a window of opportunity for early interventions, whereas the restricted innate immune response in early-SARS-CoV-2-infected lung tissues could underlie the unique uncontrolled late-phase lung damage of advanced COVID-19. IMPORTANCE In order to reduce the late-phase morbidity and mortality of COVID-19, there is a need to better understand and target the earliest stages of SARS-CoV-2 infection in the human respiratory tract. Here, we have studied the initial steps of SARS-CoV-2 infection and the consequent innate immune responses within the natural multicellular complexity of human nasal mucosal and lung tissues. Comparing the global innate response patterns of nasal and lung tissues infected in parallel with SARS-CoV-2 and influenza virus, we found distinct virus-host interactions in the upper and lower respiratory tract, which could determine the outcome and unique pathogenesis of SARS-CoV-2 infection. Studies in the nasal mucosal infection model can be employed to assess the impact of viral evolutionary changes and evaluate new therapeutic and preventive measures against SARS-CoV-2 and other human respiratory pathogens.
Keywords: COVID-19; SARS-CoV-2; human respiratory viruses; nasal mucosa; organ culture; tissue innate immune response.
Figures
Similar articles
-
Oral Bacteria Combined with an Intranasal Vaccine Protect from Influenza A Virus and SARS-CoV-2 Infection.mBio. 2021 Aug 31;12(4):e0159821. doi: 10.1128/mBio.01598-21. Epub 2021 Aug 17. mBio. 2021. PMID: 34399617 Free PMC article.
-
Human Nasal Turbinate Tissues in Organ Culture as a Model for Human Cytomegalovirus Infection at the Mucosal Entry Site.J Virol. 2020 Sep 15;94(19):e01258-20. doi: 10.1128/JVI.01258-20. Print 2020 Sep 15. J Virol. 2020. PMID: 32727881 Free PMC article.
-
RIG-I triggers a signaling-abortive anti-SARS-CoV-2 defense in human lung cells.Nat Immunol. 2021 Jul;22(7):820-828. doi: 10.1038/s41590-021-00942-0. Epub 2021 May 11. Nat Immunol. 2021. PMID: 33976430
-
Innate Immune Signaling and Proteolytic Pathways in the Resolution or Exacerbation of SARS-CoV-2 in Covid-19: Key Therapeutic Targets?Front Immunol. 2020 May 28;11:1229. doi: 10.3389/fimmu.2020.01229. eCollection 2020. Front Immunol. 2020. PMID: 32574272 Free PMC article. Review.
-
The immune response to SARS-CoV-2 and COVID-19 immunopathology - Current perspectives.Pulmonology. 2021 Sep-Oct;27(5):423-437. doi: 10.1016/j.pulmoe.2021.03.008. Epub 2021 Apr 9. Pulmonology. 2021. PMID: 33867315 Free PMC article. Review.
Cited by
-
Longitudinal Assessment of Nasopharyngeal Biomarkers Post-COVID-19: Unveiling Persistent Markers and Severity Correlations.J Proteome Res. 2024 Nov 1;23(11):5064-5084. doi: 10.1021/acs.jproteome.4c00536. Epub 2024 Oct 11. J Proteome Res. 2024. PMID: 39392878 Free PMC article.
-
Review of Immunologic Manifestations of COVID-19 Infection and Vaccination.Heart Fail Clin. 2023 Apr;19(2):177-184. doi: 10.1016/j.hfc.2022.08.006. Heart Fail Clin. 2023. PMID: 36863809 Free PMC article. Review.
-
Innate antiviral responses in porcine nasal mucosal explants inoculated with influenza A virus are comparable with responses in respiratory tissues after viral infection.Immunobiology. 2022 May;227(3):152192. doi: 10.1016/j.imbio.2022.152192. Epub 2022 Feb 22. Immunobiology. 2022. PMID: 35255458 Free PMC article.
-
Boosting maternal and neonatal humoral immunity following SARS-CoV-2 infection using a single messenger RNA vaccine dose.Am J Obstet Gynecol. 2022 Sep;227(3):486.e1-486.e10. doi: 10.1016/j.ajog.2022.04.010. Epub 2022 Apr 14. Am J Obstet Gynecol. 2022. PMID: 35430228 Free PMC article.
-
Type I interferons and SARS-CoV-2: from cells to organisms.Curr Opin Immunol. 2022 Feb;74:172-182. doi: 10.1016/j.coi.2022.01.003. Epub 2022 Jan 25. Curr Opin Immunol. 2022. PMID: 35149239 Free PMC article. Review.
References
-
- Huang C, Wang Y, Li X, Ren L, Zhao J, Hu Y, Zhang L, Fan G, Xu J, Gu X, Cheng Z, Yu T, Xia J, Wei Y, Wu W, Xie X, Yin W, Li H, Liu M, Xiao Y, Gao H, Guo L, Xie J, Wang G, Jiang R, Gao Z, Jin Q, Wang J, Cao B. 2020. Clinical features of patients infected with 2019 novel coronavirus in Wuhan, China. Lancet 395:497–506. 10.1016/S0140-6736(20)30183-5. - DOI - PMC - PubMed
-
- Bradley BT, Maioli H, Johnston R, Chaudhry I, Fink SL, Xu H, Najafian B, Deutsch G, Lacy JM, Williams T, Yarid N, Marshall DA. 2020. Histopathology and ultrastructural findings of fatal COVID-19 infections in Washington State: a case series. Lancet 396:320–332. 10.1016/S0140-6736(20)31305-2. - DOI - PMC - PubMed
-
- Wauters E, Thevissen K, Wouters C, Bosisio FM, De Smet F, Gunst J, Humblet-Baron S, Lambrechts D, Liston A, Matthys P, Neyts J, Proost P, Weynand B, Wauters J, Tejpar S, Garg AD. 2020. Establishing a unified COVID-19 “immunome”: integrating coronavirus pathogenesis and host immunopathology. Front Immunol 11:1–5. 10.3389/fimmu.2020.01642. - DOI - PMC - PubMed
-
- Xu Z, Shi L, Wang Y, Zhang J, Huang L, Zhang C, Liu S, Zhao P, Liu H, Zhu L, Tai Y, Bai C, Gao T, Song J, Xia P, Dong J, Zhao J, Wang FS. 2020. Pathological findings of COVID-19 associated with acute respiratory distress syndrome. Lancet Respir Med 8:420–422. 10.1016/S2213-2600(20)30076-X. - DOI - PMC - PubMed
Publication types
MeSH terms
Substances
Grants and funding
LinkOut - more resources
Full Text Sources
Other Literature Sources
Medical
Molecular Biology Databases
Miscellaneous