Clinical Trial
. 2021 May 11;118(19):e2026610118.
doi: 10.1073/pnas.2026610118.

Automated, multiparametric monitoring of respiratory biomarkers and vital signs in clinical and home settings for COVID-19 patients

Affiliations
Clinical Trial

Automated, multiparametric monitoring of respiratory biomarkers and vital signs in clinical and home settings for COVID-19 patients

Xiaoyue Ni et al. Proc Natl Acad Sci U S A. .

Abstract

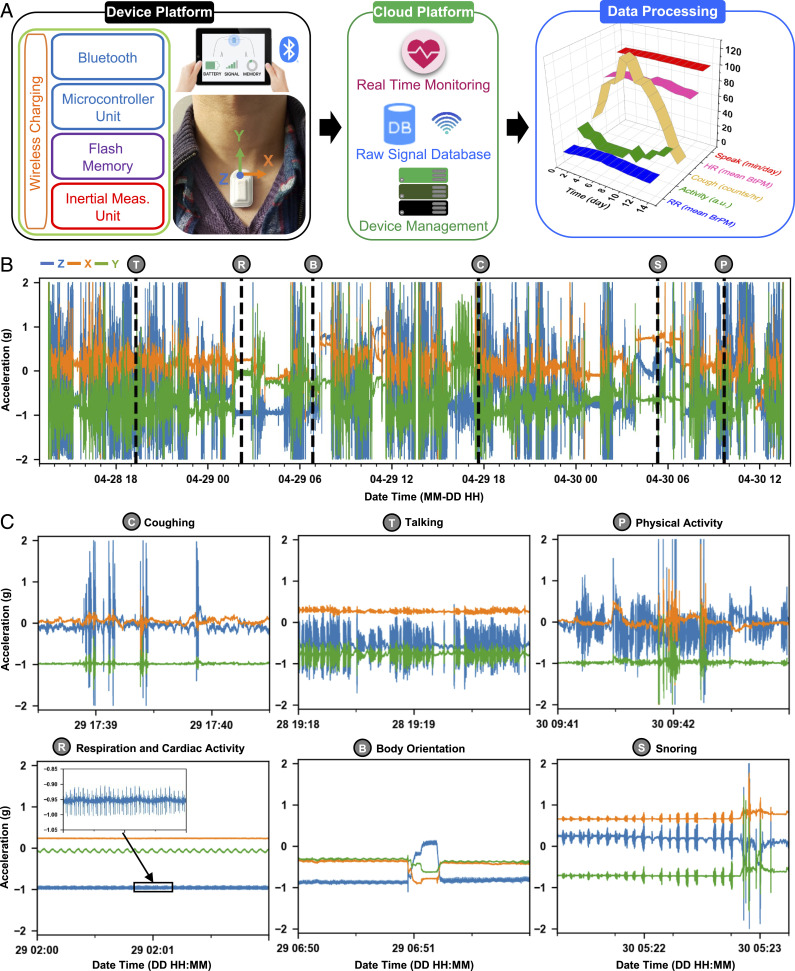
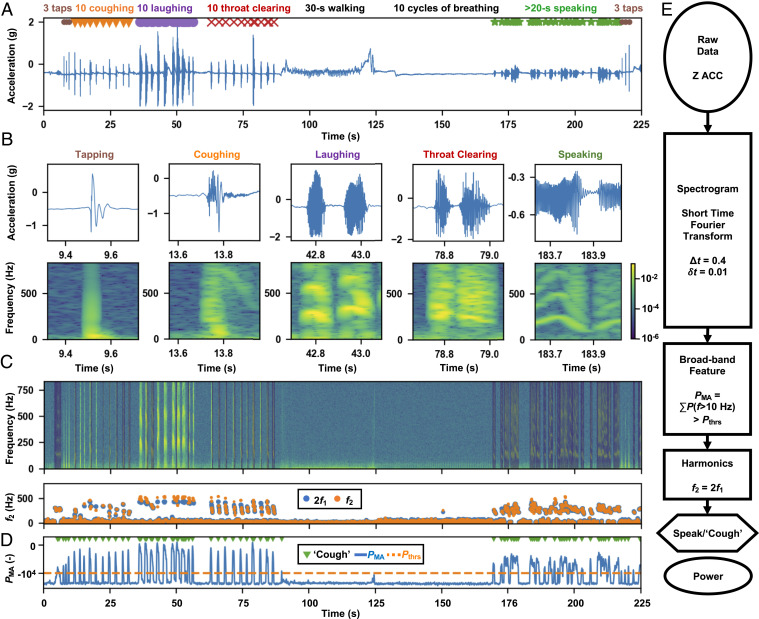
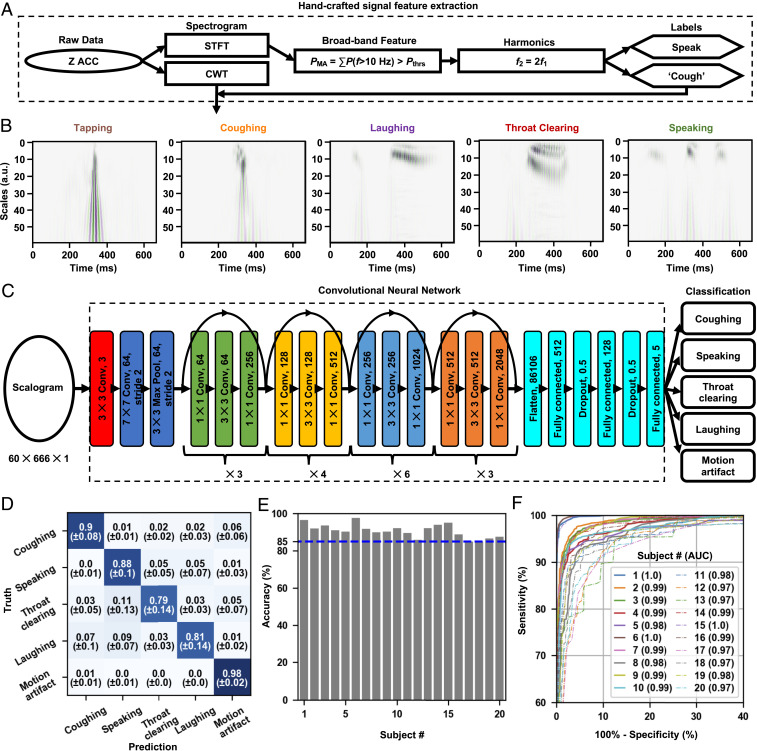
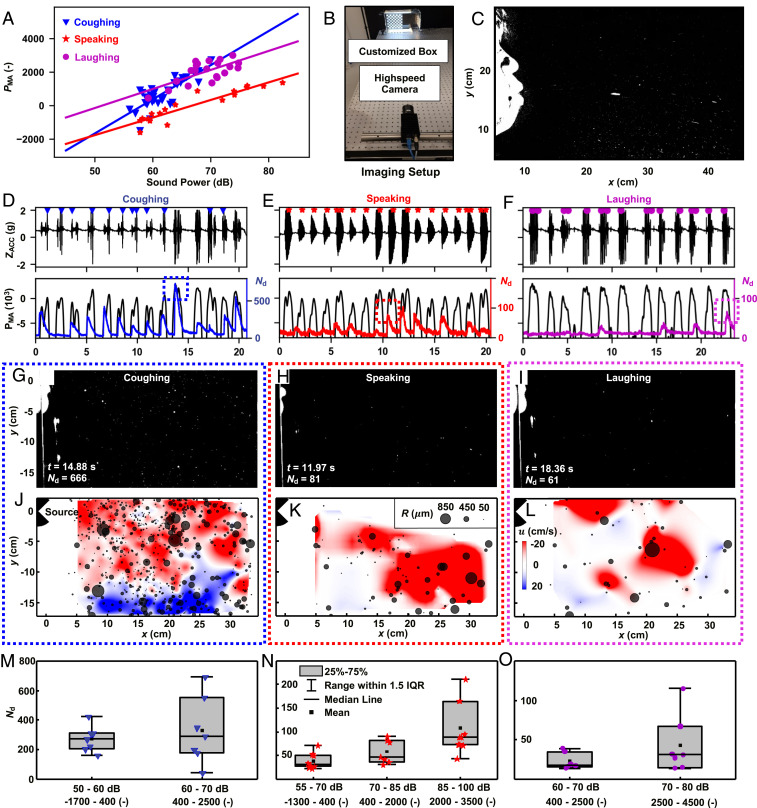
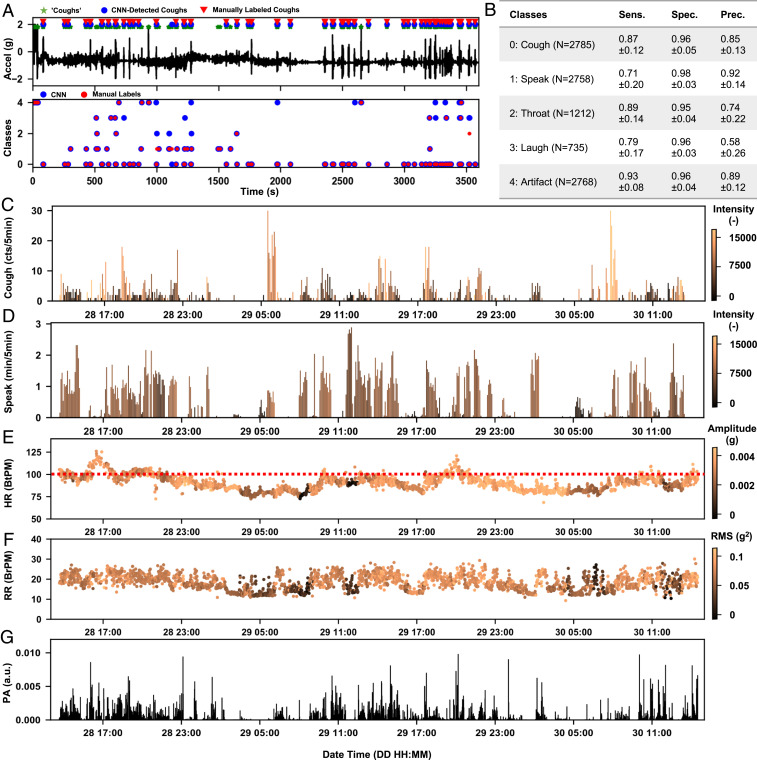
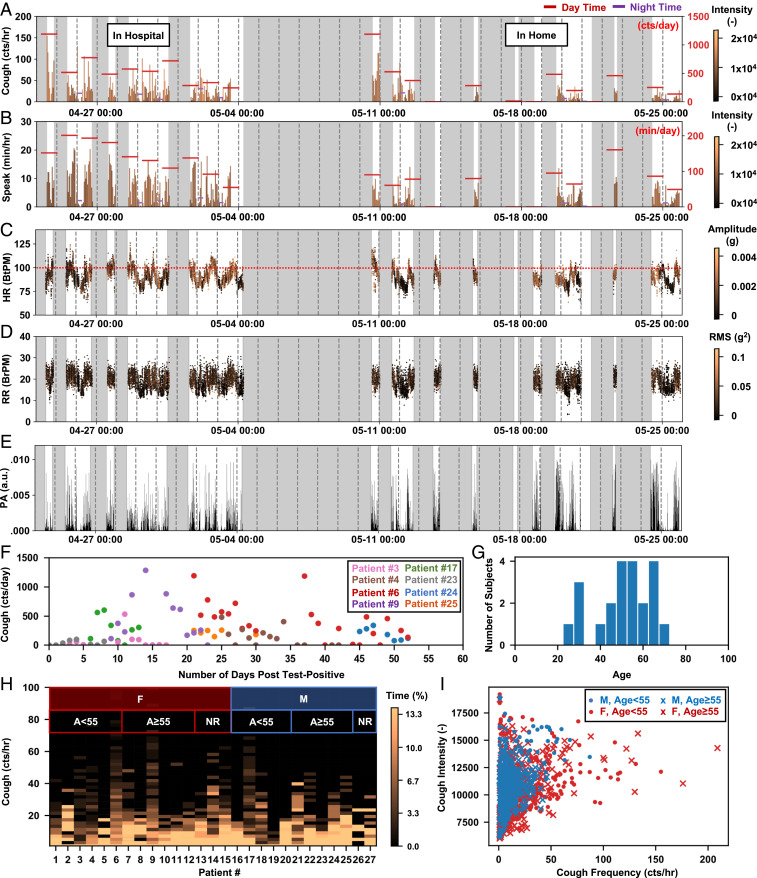
Capabilities in continuous monitoring of key physiological parameters of disease have never been more important than in the context of the global COVID-19 pandemic. Soft, skin-mounted electronics that incorporate high-bandwidth, miniaturized motion sensors enable digital, wireless measurements of mechanoacoustic (MA) signatures of both core vital signs (heart rate, respiratory rate, and temperature) and underexplored biomarkers (coughing count) with high fidelity and immunity to ambient noises. This paper summarizes an effort that integrates such MA sensors with a cloud data infrastructure and a set of analytics approaches based on digital filtering and convolutional neural networks for monitoring of COVID-19 infections in sick and healthy individuals in the hospital and the home. Unique features are in quantitative measurements of coughing and other vocal events, as indicators of both disease and infectiousness. Systematic imaging studies demonstrate correlations between the time and intensity of coughing, speaking, and laughing and the total droplet production, as an approximate indicator of the probability for disease spread. The sensors, deployed on COVID-19 patients along with healthy controls in both inpatient and home settings, record coughing frequency and intensity continuously, along with a collection of other biometrics. The results indicate a decaying trend of coughing frequency and intensity through the course of disease recovery, but with wide variations across patient populations. The methodology creates opportunities to study patterns in biometrics across individuals and among different demographic groups.

Keywords: COVID-19; biomarkers; digital health; respiratory disease; wearable electronics.


Conflict of interest statement

Competing interest statement: X.N., H.J., J.Y.L., K.L., A.J., S.X., and J.A.R. report inventorships and potential royalties in patents assigned to Northwestern University. M.K. and J.Y.L. are employees of a small private company with a commercial interest in the technology. A.R.B., S.X., and J.A.R. report equity ownership in a small private company with a commercial interest in the technology.

Figures

Fig. 1.
Fig. 1.
The health monitoring system incorporating an MA sensor, Bluetooth and cloud-based data transmission, automated data processing platform, and a user interface with a minimum need for manual operation. (A) Schematic illustration of the operational flow of the system, which consists of a device, cloud, and data processing platforms. (B) Sample three-axis acceleration raw data acquired continuously over 48 h on a COVID-19 patient. Dashed lines indicate occurrences of various representative body processes of interest, shown in (C) zoomed-in 2-min windows.
Fig. 2.
Fig. 2.
The signal preprocessing steps that identify broadband events of interest from quiet and speaking times from MA measurements. (A) The raw z axis data generated from controlled experiments on healthy normal subjects, with all of the events of interest repeated in sequence following a designed protocol (see Materials and Methods for details). (B) Example 400-ms clips of the raw z axis data and their corresponding spectrogram features. (C) Speaking signals distinct with a clear presence of harmonics (P(f1) and P(f2) of fundamental frequencies f1 in the spectrogram analysis P(f), where 2f1f2; see ref. for details). Detected speaking periods are shaded in blue in the spectrogram. (D) After excluding speaking time, the detection of the high-frequency (f>10 Hz) MA power peaks with a minimum time interval of 0.4 s and a threshold of 10,000 yields time stamps for cough-like events that feature the impulse-like broadband acoustics. (E) A flow diagram summarizing the preprocessing steps that take in the raw z axis data and output the time stamps for cough-like and speaking events, along with their MA power, PMA.
Fig. 3.
Fig. 3.
The machine learning algorithm for the classification of cough-like events extracted by the preprocessing algorithm. (A) Steps of feature scalogram generation from raw data. (B) Representative scalograms of events of interest. (C) The architecture of a CNN that takes in a feature scalogram and outputs its probabilities of classes. (D) The averaged confusion matrix from the iterated 20 leave-one-out testings. (E) The overall testing accuracy on each left-out subject using a model trained on the other 19 subjects. (F) The macroaveraged ROC curves of each left-out subject using a model trained on the other 19 subjects and the corresponding AUC. a.u., arbitrary unit.
Fig. 4.
Fig. 4.
MA sensing to quantify the transmission of droplets. (A) MA power vs. decibel meter measurement for coughing, speaking, and laughing. (B) Experimental setup for optical imaging of droplets. (C) Sample image of coughing. (DF) Time series of MA z axis acceleration (ZACC) in sync with the analysis of MA power and the imaging detection of the number of the particles. (GI) Instantaneous images of coughing, talking, and laughing at the peak of corresponding marked boxes in DF. (JL) Detected particles with sizes indicated by the diameters of the gray circular symbols, overlapped with velocity contour fields at the corresponding instances in GI; the color denotes stream-wise velocity in the horizontal (x axis) direction. (MO) Box and whisker plots showing the number of particles with mean, median, and interquartile range (IQR) for all measured cycles of coughing, speaking, and laughing, respectively. See Materials and Methods for full description.
Fig. 5.
Fig. 5.
Deployment of MA devices on to the COVID-19 patients in clinical settings. (A) Representative z axis acceleration data measured from a female patient. The automated algorithm detects cough-like events and outputs five-way classification for the events to coughing (0), speaking (1), throat clearing (2), laughing (3), and motion artifacts (4). (B) The macroaveraged testing performance (sensitivity/recall, specificity, and precision) of each type of event on the 10 patients with manual labels, which include 10,258 randomly sampled events in total. (C and D) Example results for the detected coughing and talking frequency and intensity (color-coded) in 5-min windows from continuous 48-h monitoring of the same patient (raw acceleration data are shown in Fig. 1 B and C). (EG) The vital signs information includes heart rate (HR) in a unit of beats per minute (BtPM) and respiration rate (RR) in a unit of breaths per minute (BrPM), and physical activity (PA), extracted from the same measurement, with their amplitude information color coded. a.u., arbitrary unit.
Fig. 6.
Fig. 6.
Long-term monitoring of coughing and other biometrics of COVID-19 patients. Long-term MA sensing of (A) cough frequency per hour, (B) talk time per hour, (C) heart rate, (D) respiration rate, and (E) physical activity for the same patient shown in Fig. 5 A and CG, with the intensity or amplitude information of the associated events color coded in each time bin. (F) The time series plot of coughing counts organized in days post the test-positive date from eight COVID-19 patients. (G) The age distribution of the 27 patients whose data are not used to build the machine learning model. (H) The histogram of coughing frequency of the 27 patients. Ages for 3 females and 2 males are not reported (NR). (I) The cough intensity versus cough frequency analyzed for each hour of data, clustered by four demographic groups. a.u., arbitrary unit; BrPM, breaths per minute; BtPM, beats per minute.

Similar articles

Cited by

References

    1. Centers for Disease Control and Prevention , Coronavirus disease 2019 (COVID-19). Cases in the U.S. New cases by day. https://covid.cdc.gov/covid-data-tracker/. Accessed 26 December 2020.
    1. West C. P., Montori V. M., Sampathkumar P., COVID-19 testing: The threat of false-negative results. Mayo Clinic Proc. 95, 1127–1129 (2020). - PMC - PubMed
    1. Pettit S. D., et al. , ‘All in’: A pragmatic framework for COVID-19 testing and action on a global scale. EMBO Mol. Med. 12, e12634 (2020). - PMC - PubMed
    1. Menni C., et al. , Real-time tracking of self-reported symptoms to predict potential COVID-19. Nat. Med. 26, 1037–1040 (2020). - PMC - PubMed
    1. Natarajan A., Su H. W., Heneghan C., Assessment of physiological signs associated with COVID-19 measured using wearable devices. NPJ Digit. Med. 3, 156 (2020). - PMC - PubMed

Publication types