. 2021 Apr 23;12(1):2431.
doi: 10.1038/s41467-021-22068-5.

VPS39-deficiency observed in type 2 diabetes impairs muscle stem cell differentiation via altered autophagy and epigenetics

Affiliations

VPS39-deficiency observed in type 2 diabetes impairs muscle stem cell differentiation via altered autophagy and epigenetics

Cajsa Davegårdh et al. Nat Commun. .

Abstract

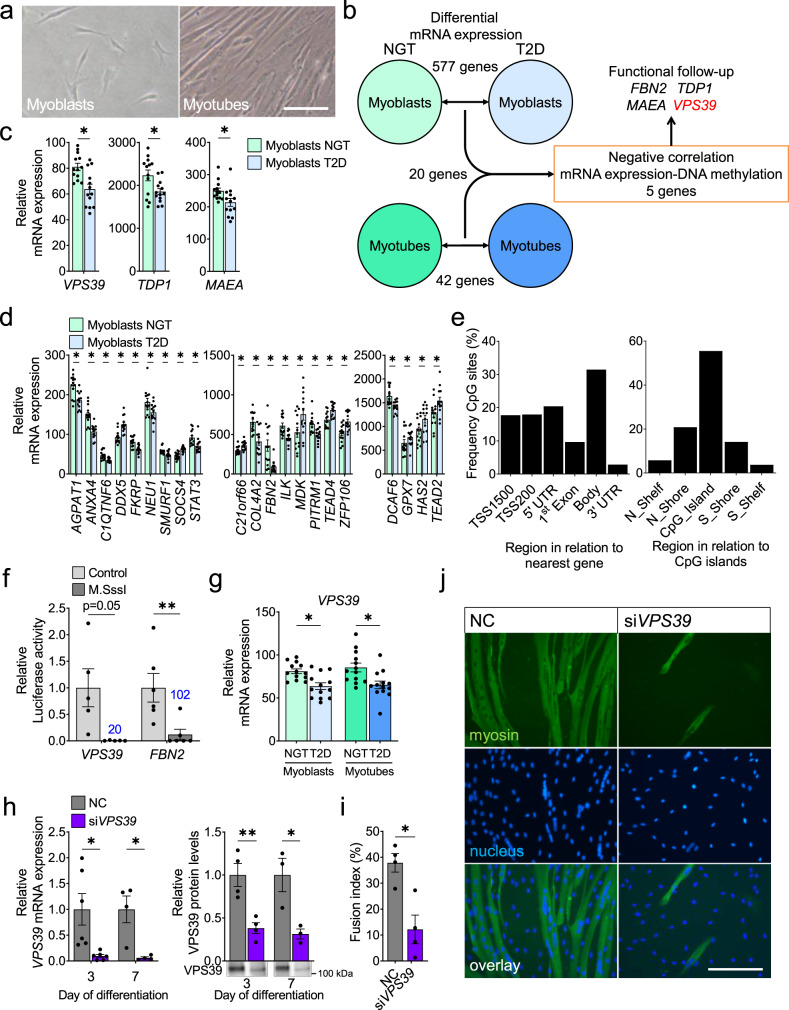
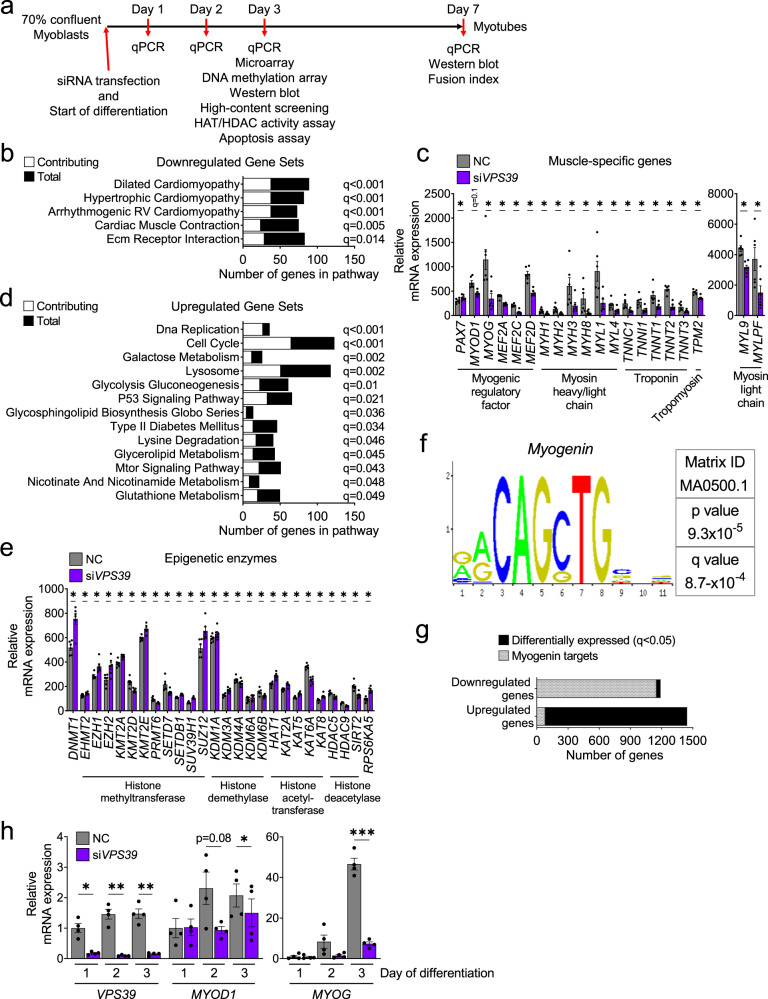
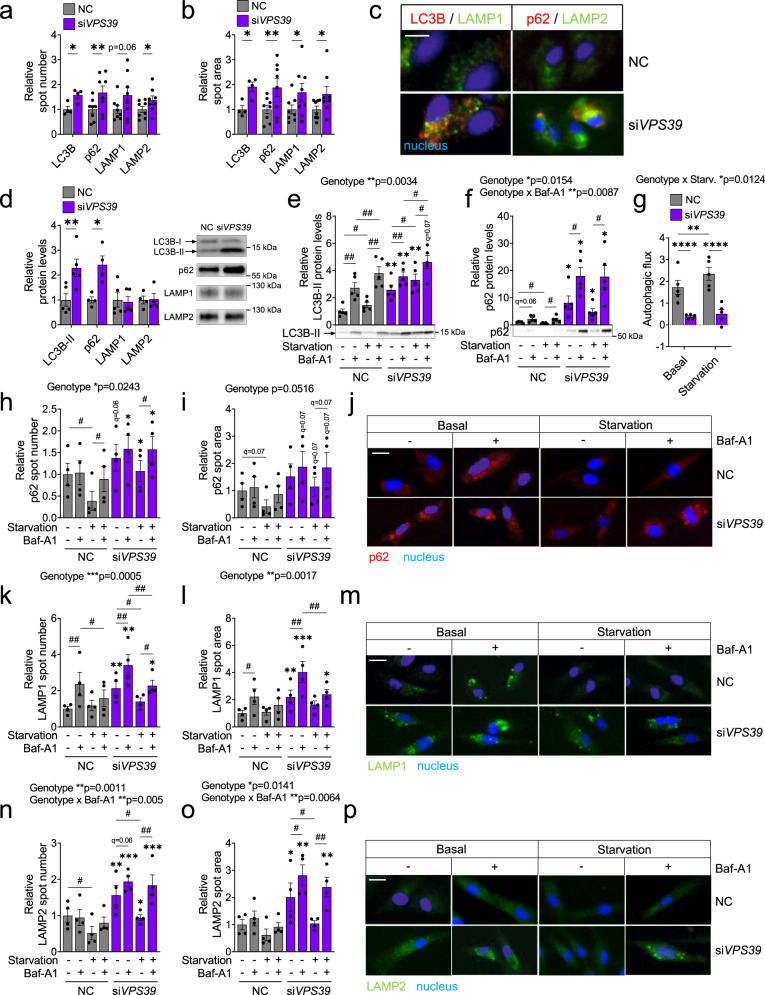
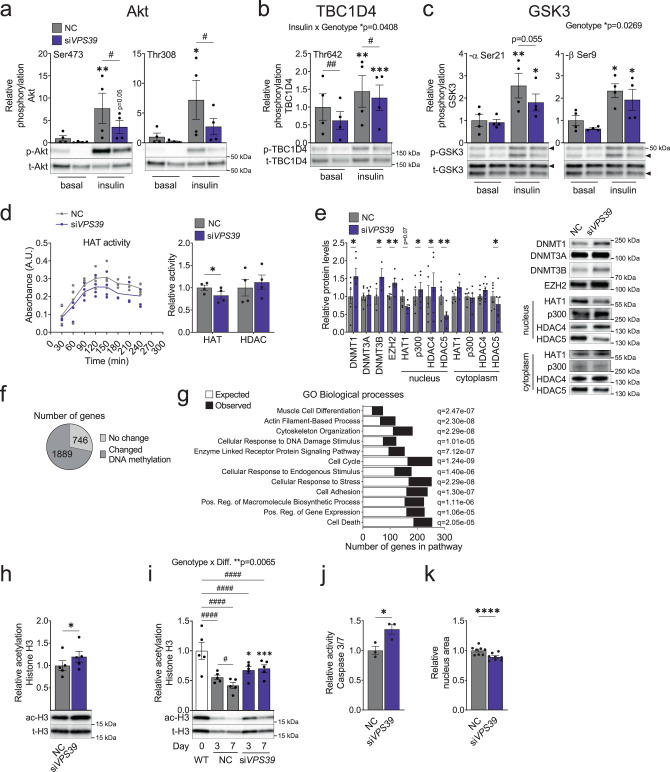
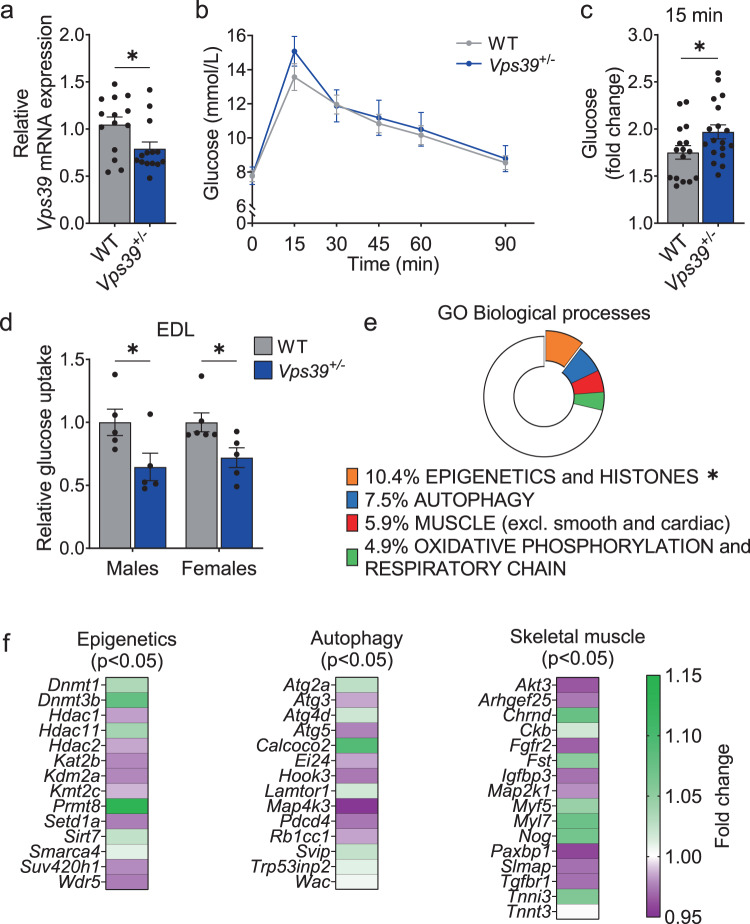
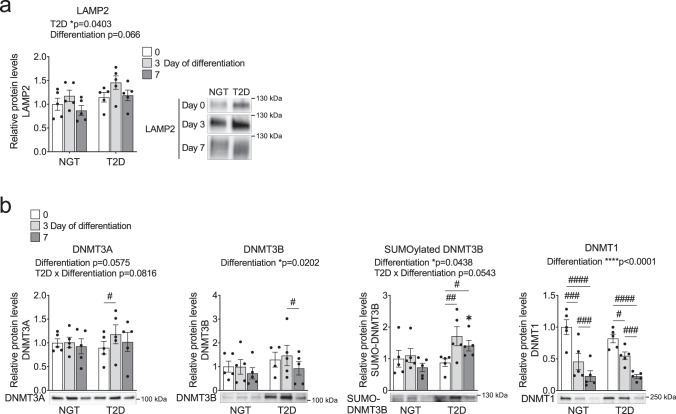
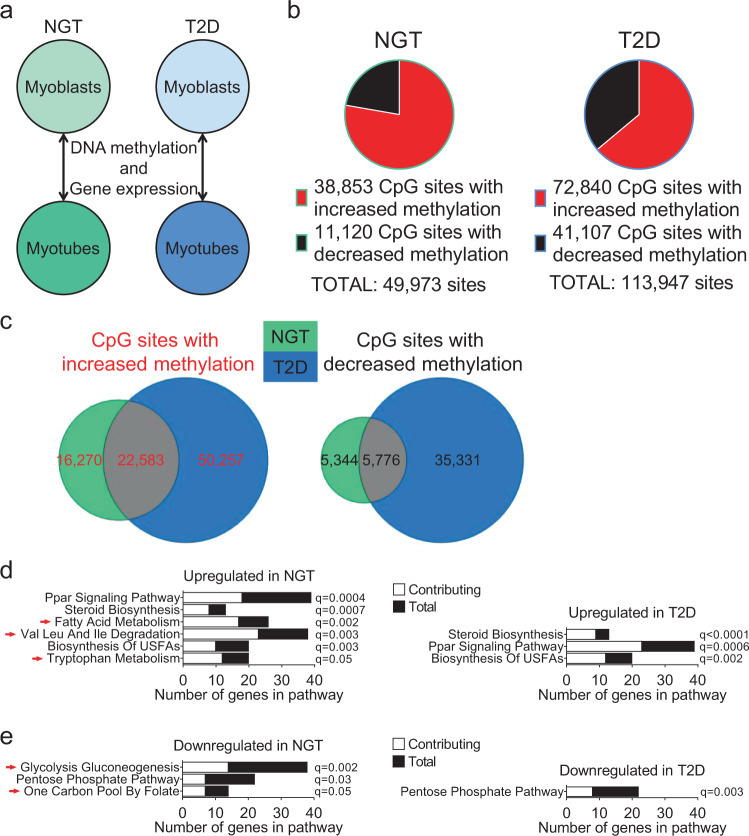
Insulin resistance and lower muscle quality (strength divided by mass) are hallmarks of type 2 diabetes (T2D). Here, we explore whether alterations in muscle stem cells (myoblasts) from individuals with T2D contribute to these phenotypes. We identify VPS39 as an important regulator of myoblast differentiation and muscle glucose uptake, and VPS39 is downregulated in myoblasts and myotubes from individuals with T2D. We discover a pathway connecting VPS39-deficiency in human myoblasts to impaired autophagy, abnormal epigenetic reprogramming, dysregulation of myogenic regulators, and perturbed differentiation. VPS39 knockdown in human myoblasts has profound effects on autophagic flux, insulin signaling, epigenetic enzymes, DNA methylation and expression of myogenic regulators, and gene sets related to the cell cycle, muscle structure and apoptosis. These data mimic what is observed in myoblasts from individuals with T2D. Furthermore, the muscle of Vps39+/- mice display reduced glucose uptake and altered expression of genes regulating autophagy, epigenetic programming, and myogenesis. Overall, VPS39-deficiency contributes to impaired muscle differentiation and reduced glucose uptake. VPS39 thereby offers a therapeutic target for T2D.


Conflict of interest statement

The authors declare no competing interests.

Figures

Fig. 1
Fig. 1. Differential gene expression in myoblasts and myotubes from 13 individuals with type 2 diabetes versus 13 controls, and identification of VPS39 as a regulator of human myogenesis.
a Representative light microscope images of human proliferating myoblasts and differentiated myotubes. Images were taken for 14 individuals with type 2 diabetes and 14 controls. Scale bar 100 µm. b Schematic overview of analyses performed in human myoblasts and myotubes from individuals with type 2 diabetes (T2D) vs. controls (NGT, normal glucose tolerance). cd mRNA expression (microarray) of genes previously not described in relation to myogenesis (VPS39, TDP1, and MAEA) (c), and genes known to be involved in muscle regeneration (d) that exhibit differential expression in myoblasts from individuals with T2D (blue bars) vs. NGT (green bars). n = 13 individuals per group. *q < 0.05 for T2D vs. NGT. For exact q-values see Supplementary Data 1, Sheet A. e Frequency distribution (%) of CpG sites (n = 832) in relation to gene regions (left panel) and CpG islands (right panel). CpG sites for which a negative correlation between DNA methylation and expression of annotated genes was established are included. TSS, transcription start site; TSS200 and TSS1500, proximal promoter, defined as 1–200 bp (base pairs) or 201–1500 bp upstream of the TSS, respectively; UTR, untranslated region; CpG island, 200 bp (or more) stretch of DNA with a C + G content of > 50% and an observed/expected CpG ratio of > 0.6; Shore, regions flanking CpG islands, 0–2000 bp; Shelf, regions flanking island shores, 0–2000 bp. f Reporter gene transcription measured by luciferase activity (firefly/renilla-ratio) after in vitro methylation with M.SssI (dark gray bars) or mock-methylation (Control, light gray bars) of the VPS39 and FBN2 promoters cloned into a CpG-free vector and transfected into C2C12 myoblasts. n = 5 (VPS39) and n = 6 (FBN2) independent experiments. Numbers in blue above the bars represent the number of target CpG sites in the respective promoter sequence. The Control for each promoter is set to 1. **p < 0.01 for M.SssI vs. Control. p = 0.0501 (VPS39), p = 0.0068 (FBN2). g mRNA expression (microarray) of VPS39 in myoblasts and myotubes from individuals with T2D (blue bars) and NGT (green bars). n = 13 individuals per group. *q < 0.05 for T2D vs. NGT. For exact q-values see Supplementary Data 1, Sheets A and B. h Knockdown efficiency of VPS39 mRNA (left panel, n = 6 [Day 3] and n = 4 [Day 7] independent experiments) and VPS39 protein (right panel, n = 4 [Day 3] and n = 3 [Day 7] independent experiments) after siRNA silencing of VPS39 (siVPS39, purple bars) throughout cell differentiation. Negative control (NC, gray bars) at each time point is set to 1. Representative blots are shown. *p < 0.05, **p < 0.01 for siVPS39 vs. NC. p = 0.0302 (VPS39 mRNA Day 3), p = 0.0379 (VPS39 mRNA Day 7), and p = 0.004 (VPS39 protein Day 3), p = 0.0389 (VPS39 protein Day 7). ij Assessment of myotube formation (fusion index) at day 7 of differentiation in siVPS39 and NC (i). n = 4 independent experiments, *p < 0.05 for siVPS39 vs. NC, p = 0.0266. j Representative images from the assay, showing reduced myotube formation after VPS39-silencing. Scale bar 200 µm. Bars represent mean values and error bars display SEM (cd, fi). Statistical significance determined by linear regression adjusted for age, BMI and sex for T2D vs. NGT (cd, g). P-values were adjusted for multiple comparisons with false discovery rate (FDR) analysis (cd, g). Statistical significance determined by paired two-tailed t-test (f, hi).
Fig. 2
Fig. 2. VPS39 knockdown results in reduced expression of key myogenic genes in human myoblasts.
a Study design for VPS39-silencing and analyses performed in human myoblasts and myotubes. HAT histone acetyltransferase, HDAC histone deacetylase. be Microarray expression analysis in VPS39-silenced myoblasts (siVPS39) and negative control (NC) at day 3 of differentiation. Gene set enrichment analysis (GSEA) enriched gene sets (FDR < 5%) that were downregulated (b) or upregulated (d) (see also Supplementary Data 3, Sheet B). Bars represent the number of differentially expressed genes contributing to each gene set (white bars), and the total number of genes in each gene set (black bars). mRNA expression (microarray) of myogenic regulatory factors and muscle-specific genes (c), and genes encoding epigenetic enzymes (e) in siVPS39 (purple bars) and NC (gray bars). n = 6 independent experiments. *q < 0.05 for siVPS39 vs. NC. For exact q-values see Supplementary Data 3, Sheet A. RV right ventricular. f Using PSCAN analysis, the binding motif for myogenin (Myog), presented here, was found to be significantly enriched in the promoter region of genes downregulated after VPS39-silencing. For full PSCAN analysis, see Supplementary Data 3, Sheet C. g The number of down- or upregulated genes with the myogenin binding motif in their promoter region (gray bars) in relation to all differentially expressed genes (black bars) for siVPS39 vs. NC. h Relative expression (qPCR) of VPS39, MYOD1, and MYOG at day 1 (24 h), day 2 (48 h), and day 3 (72 h) after the start of siVPS39 transfection and differentiation. n = 4 independent experiments. NC at day 1 for each gene is set to 1. *p < 0.05, **p < 0.01, ***p < 0.001 for siVPS39 vs. NC. p = 0.0114 (VPS39 Day 1), p = 0.0033 (VPS39 Day 2), p = 0.0022 (VPS39 Day 3), and p = 0.0819 (MYOD1 Day 2), p = 0.0211 (MYOD1 Day 3), and p = 0.0009 (MYOG Day 3). Bars represent mean values and error bars display SEM (c, e, h). Statistical significance was determined by paired two-tailed t-test (c, e, h). P-values were adjusted for multiple comparisons with false discovery rate (FDR) analysis (b, c, d, e, f).
Fig. 3
Fig. 3. VPS39-silencing impairs autophagic flux in human myoblasts.
ac High-content screening (HCS) analysis using spot detection application to identify autophagy markers LC3B, p62, LAMP1, and LAMP2 in VPS39-silenced myoblasts (siVPS39, purple bars) and negative control (NC, gray bars) at day 3 of differentiation. n = 4 (LC3B) and n = 8 (p62, LAMP1/2) independent experiments. Graphs show a relative number of detected spots per cell (a) and area per spot (b) for each marker. NC is set to 1. *p < 0.05, **p < 0.01 for siVPS39 vs. NC. p = 0.0274 (a, LC3B), p = 0.0034 (a, p62), p = 0.0606 (a, LAMP1), p = 0.0112 (a, LAMP2), and p = 0.035 (b, LC3B), p = 0.0059 (b, p62), p = 0.0399 (b, LAMP1), p = 0.0317 (b, LAMP2). c Representative images from the analyses in (ab), showing immunostaining of LC3B (left panel, red) and LAMP1 (left panel, green), and p62 (right panel, red) and LAMP2 (right panel, green). Scale bar 20 µm. d Protein levels of LC3B-II, p62, LAMP1, and LAMP2 in siVPS39 (purple bars) and NC (gray bars) myoblasts at day 3 of differentiation. n = 5 (LC3B-II, p62, LAMP1) and n = 4 (LAMP2) independent experiments. NC is set to 1. Representative blots are shown. *p < 0.05, **p < 0.01 for siVPS39 vs. NC. p = 0.0062 (LC3B-II), p = 0.0137 (p62). ep Autophagic flux measurements in siVPS39 (purple bars) and NC (gray bars) myoblasts at day 3 of differentiation in both the basal state and after starvation (3 h) to induce autophagy, and in the absence or presence of the lysosomal inhibitor Bafilomycin A1 (Baf-A1, 100 nM). NC in the basal, vehicle-treated state is set to 1. eg Protein levels (Western blot) of LC3B-II (e) and p62 (f). n = 5 independent experiments. Representative blots are shown. #q < 0.05, ##q < 0.01 for comparisons between treatments within each genotype, and *q < 0.05, **q < 0.01 for siVPS39 vs. NC for each treatment. For exact q-values see Supplementary Table 1. g Autophagic flux calculated as LC3B-II protein levels in Baf-A1-treated vs. vehicle-treated cells under basal and starvation conditions for each genotype (see also Supplementary Fig. 2g). **p < 0.01, ****p < 0.0001 (Fisher’s LSD test). p = 0.000078 (Basal; siVPS39 vs. NC), p = 0.000022 (Starvation: siVPS39 vs. NC), p = 0.0016 (NC: Basal vs. Starvation). Starv., starvation (hp) HCS analysis using spot detection application to identify p62 (hj), LAMP1 (km), and LAMP2 (np). n = 4 independent experiments. Graphs show the relative number (h, k, n) and area (i, l, o) of detected spots per cell for each marker. #q < 0.05, ##q < 0.01 for comparisons between treatments within each genotype, and *q < 0.05, **q < 0.01, ***q < 0.001 for siVPS39 vs. NC for each treatment. j, m, p Representative images from the analyses, showing immunostaining of p62 (j), LAMP1 (m), and LAMP2 (p). Scale bar 20 µm. Bars represent mean values and error bars display SEM (ab, di, kl, no). Statistical significance determined by paired two-tailed t-test (ab, d). The effects of genotype, starvation, and Baf-A1-treatment stated above the graphs were calculated with repeated measures three-way ANOVA (ef, hi, kl, no) or two-way ANOVA (g). P-values were adjusted for multiple comparisons with false discovery rate (FDR) analysis (ef, hi, kl, no).
Fig. 4
Fig. 4. Reduction of VPS39 levels alters the epigenome and insulin signaling in human myoblasts.
ac Specific phosphorylation (intensity of phosphorylation divided by total levels for each corresponding protein) for Akt at Ser473 (a, left panel) and Thr308 (a, right panel), TBC1D4 at Thr642 (b), GSK3-α at Ser21 (c, left panel) and GSK3-β at Ser9 (c, right panel) in the basal state and after insulin stimulation (100 nM, 30 min) in VPS39-silenced myoblasts (siVPS39, purple bars) and negative control (NC, gray bars) at day 3 of differentiation. n = 4 independent experiments. NC in the basal state is set to 1. Representative blots are shown. #p < 0.05, ##p < 0.01 for siVPS39 vs. NC for each treatment, and *p < 0.05, **p < 0.01, ***p < 0.001 for basal vs. insulin (Fisher’s LSD test). For exact p-values see Supplementary Table 1. d Kinetics of histone acetyltransferase (HAT) activity measurement (left panel). HAT (area under the curve) and histone deacetylase (HDAC) (fixed point) activity in nuclear extracts from siVPS39 (purple) and NC (gray) myoblasts at day 3 of differentiation (right panel). n = 4 independent experiments. NC is set to 1. *p < 0.05 for siVPS39 vs. NC. p = 0.0126 (HAT). e Protein levels (Western blot) of epigenetic enzymes from siVPS39 (purple bars) and NC (gray bars) myoblasts at day 3 of differentiation. Protein levels were measured in whole-cell lysates, or in nuclear and cytosolic fractions as indicated. n = 6 (DNMT1, DNMT3A, HDAC5 [nucleus and cytoplasm]), n = 3 (DNMT3B), n = 5 (EZH2, HAT1 [nucleus], p300 [nucleus and cytoplasm], HDAC4 [nucleus]), n = 4 (HAT1 [cytoplasm]), n = 8 (HDAC4 [cytoplasm]). NC is set to 1. Representative blots are shown. Statistical analysis was performed on log2-transformed values. *p < 0.05, **p < 0.01 for siVPS39 vs. NC. p = 0.0259 (DNMT1), p = 0.0374 (DNMT3B), p = 0.0081 (EZH2), p = 0.0697 (HAT1 [nucleus]), p = 0.0309 (p300 [nucleus]), p = 0.0493 (HDAC4 [nucleus]), p = 0.001 (HDAC5 [nucleus]), p = 0.0463 (HDAC5 [cytoplasm]). DNMT, DNA methyltransferase, HAT histone acetyltransferase, HDAC histone deacetylase. f The number of genes with altered DNA methylation at one or more CpG site (dark gray) or no change (light gray) among the 2635 genes with differential expression in siVPS39 vs. NC myoblasts. g The number of observed (black bars) and expected (white bars) genes for a selection of GO cellular processes enriched among genes with differential DNA methylation and gene expression in siVPS39 vs. NC myoblasts. Bars sorted by ratio (observed/expected). GO gene ontology. hi Western blot analysis of acetylated histone 3 (ac-H3) levels related to the total amount of H3 in siVPS39 (purple bars) and NC (gray bars) myoblasts at day 3 of differentiation (h), and at days 0, 3, and 7 of differentiation (i). n = 5 independent experiments. NC/WT is set to 1. Representative blots are shown. *p < 0.05 for siVPS39 vs. NC in (h). p = 0.012. #q < 0.05, ####q < 0.0001 for comparisons between time points within each genotype, and *q < 0.05, ***q < 0.001 for siVPS39 vs. NC at each time point in (i). For exact q-values see Supplementary Table 1. Diff. differentiation. jk Apoptosis measured as Caspase 3/7 activity (j, n = 3 independent experiments) and nucleus size (area of the DAPI-stain measured in the HCS assay) (k, n = 8 independent experiments) in siVPS39 (purple bars) and NC (gray bars) at day 3 of differentiation. NC is set to 1. *p < 0.05, ****p < 0.0001 for siVPS39 vs. NC. p = 0.0259 (j), p = 0.000051 (k). Bars (in (ac, d), right panel, and (e, hk)) or points (in (d), left panel) represent mean values and error bars display SEM (ae, hk). The effects of genotype, and insulin-treatment or differentiation stated above the graphs were calculated with repeated measures two-way ANOVA (ac, i). P-values were adjusted for multiple comparisons with false discovery rate (FDR) analysis (g, i). Statistical significance determined by paired two-tailed t-test (de, h, jk).
Fig. 5
Fig. 5. Vps39-deficiency alters glucose metabolism and gene expression related to epigenetics, autophagy, and muscle function in mouse skeletal muscle.
a mRNA expression (qPCR) of Vps39 in skeletal muscle (tibialis anterior) from heterozygous (Vps39+/−, n = 14, including six males and eight females, blue bars) and wild type (WT, n = 14, including seven males and seven females, gray bars) mice. *p < 0.05 for Vps39+/− vs. WT. p = 0.0247. bc Oral glucose tolerance test (OGTT) in Vps39+/− mice (n = 18, including ten males and eight females, blue points/bars) and WT mice (n = 16, including ten males and six females, gray points/bars). b Blood glucose levels (mmol/L) at 0–90 min during the OGTT. c Fold change in blood glucose levels during the first 15 min of the OGTT (glucose levels at 15 min relative 0 min). *p < 0.05 for Vps39+/− vs. WT. p = 0.0451. d Relative glucose uptake in the extensor digitorum longus (EDL) muscle from Vps39+/− and WT mice during 45 min after an oral glucose load. Glucose uptake in muscle was measured using 2-[1,2-3H(N)]-Deoxy-D-glucose tracer and normalized to tissue weight. Males: n = 5 WT and n = 5 Vps39+/−, females: n = 6 WT and n = 5 Vps39+/−. WT mice are set to 1. *p < 0.05 for Vps39+/− vs. WT. p = 0.0474 (males), p = 0.0307 (females). ef mRNA expression analysis (microarray) in skeletal muscle (tibialis anterior) from Vps39+/− vs. WT mice (n = 12 per genotype, including six males and six females per genotype). e Frequency of selected GO terms (“Epigenetics and Histones” [orange], “Autophagy” [blue], “Muscle” [red] and “Oxidative phosphorylation and Respiratory chain” [green]) among the differentially expressed genes (p < 0.05 for Vps39+/− vs. WT). Chi2-tests were used to analyze overrepresentation of differentially expressed genes belonging to a GO term compared with all analyzed genes. *p-chi2 < 0.05 compared to all analyzed genes. f Heatmap showing the fold change in expression for some selected differentially expressed genes (p < 0.05 for Vps39+/− vs. WT) related to the GO terms in (e) (“Epigenetics”, “Autophagy” or “Muscle”), based on GO annotation or previously published research. Genes with upregulated expression in Vps39+/− mice displayed in green and downregulated expression displayed in purple. For exact p-values see Supplementary Data 5, Sheet A. GO gene ontology. Bars (in (a, cd)) or points (in (b)) represent mean values and error bars display SEM (ad). Statistical significance determined by unpaired two-tailed t-test (a, cd). Differential gene expression between Vps39+/− and WT mice was analyzed by unpaired two-tailed t-tests (ef).
Fig. 6
Fig. 6. Impact of T2D on LAMP2 and DNMTs during myogenesis in human muscle cells.
ab Protein levels (Western blot) of LAMP2 (a), and DNMT3A, DNMT3B, SUMOylated DNMT3B, and DNMT1 (b) in muscle cells from individuals with type 2 diabetes (T2D) and controls (NGT normal glucose tolerance) at day 0 (white bars), 3 (light gray bars), and 7 (dark gray bars) of differentiation. n = 5 individuals per group (except for DNMT3B, T2D: Day 0 where n = 4). NGT at day 0 is set to 1. Representative blots are shown. #q < 0.05, ##q < 0.01, ###q < 0.001, ####q < 0.0001 for comparisons between time points within each group, and *q < 0.05 for T2D vs. NGT at each time point. DNMT3A: q = 0.0305 (T2D: Day 0 vs. 3), and DNMT3B: q = 0.0323 (T2D: Day 3 vs. 7), and SUMO-DNMT3B: q = 0.0073 (T2D: Day 0 vs. 3), q = 0.0157 (T2D: Day 0 vs. 7), q = 0.0237 (Day 7: T2D vs. NGT), and DNMT1: q = 0.0003 (NGT: Day 0 vs. 3), q = 0.0009 (NGT: Day 3 vs. 7), q = 0.0000005 (NGT: Day 0 vs. 7), q = 0.0457 (T2D: Day 0 vs. 3), q = 0.0003 (T2D: Day 3 vs. 7), q = 0.0000097 (T2D: Day 0 vs. 7). Bars represent mean values and error bars display SEM (ab). The effects of T2D and differentiation stated above the graphs were calculated with two-way ANOVA, or mixed-effects model (DNMT3B), with repeated measures in the factor “Differentiation” (Day 0, 3, and 7). DNMT3B, SUMOylated DNMT3B, and DNMT1 protein values were log2-transformed before statistical analysis. Non-logarithmic values are presented in the graphs. P-values were adjusted for multiple comparisons with false discovery rate (FDR) analysis (ab).
Fig. 7
Fig. 7. Differential changes in DNA methylation and gene expression during differentiation of human muscle cells from individuals with T2D versus controls.
a Schematic representation of the analyses performed to compare the myogenic process in cells from individuals with type 2 diabetes (T2D) and controls (NGT, normal glucose tolerance). b Number of CpG sites with significantly (q < 0.05) increased (red) or decreased (black) DNA methylation before vs. after muscle cell differentiation in individuals with NGT (left panel) and T2D (right panel) (see also Supplementary Data 6, Sheets B and C). n = 14 individuals per group. c Overlap of the CpG sites with significantly (q < 0.05) increased (left panel) or decreased (right panel) methylation in individuals with NGT and T2D in (b). de Significantly enriched gene sets (FDR < 5%) related to glucose, fatty acid, and amino acid metabolism based on gene set enrichment analysis (GSEA) of microarray expression data comparing myoblasts vs. myotubes from individuals with NGT and T2D, respectively (see also Supplementary Fig. 5f–g). Gene sets that were upregulated (d) or downregulated (e) before vs. after muscle cell differentiation. Bars represent the number of differentially expressed genes contributing to each gene set (white bars), and the total number of genes in each gene set (black bars). Red arrows indicate gene sets regulated only in individuals with NGT. n = 13 individuals per group. Val valine, Leu leucine, Ile isoleucine, USFA unsaturated fatty acid.

Comment in

Similar articles

Cited by

References

    1. Park SW, et al. Decreased muscle strength and quality in older adults with type 2 diabetes: the health, aging, and body composition study. Diabetes. 2006;55:1813–1818. doi: 10.2337/db05-1183. - DOI - PubMed
    1. Leenders M, et al. Patients with type 2 diabetes show a greater decline in muscle mass, muscle strength, and functional capacity with aging. J. Am. Med. Dir. Assoc. 2013;14:585–592. doi: 10.1016/j.jamda.2013.02.006. - DOI - PubMed
    1. D’Souza DM, Al-Sajee D, Hawke TJ. Diabetic myopathy: impact of diabetes mellitus on skeletal muscle progenitor cells. Front. Physiol. 2013;4:379. - PMC - PubMed
    1. Mootha VK, et al. PGC-1 alpha-responsive genes involved in oxidative phosphorylation are coordinately downregulated in human diabetes. Nat. Genet. 2003;34:267–273. doi: 10.1038/ng1180. - DOI - PubMed
    1. Petrella JK, Kim JS, Mayhew DL, Cross JM, Bamman MM. Potent myofiber hypertrophy during resistance training in humans is associated with satellite cell-mediated myonuclear addition: a cluster analysis. J. Appl. Physiol. 2008;104:1736–1742. doi: 10.1152/japplphysiol.01215.2007. - DOI - PubMed

Publication types

MeSH terms

Substances