. 2021 Apr 23;12(1):2397.
doi: 10.1038/s41467-021-22651-w.

CRISPR-based genome editing in primary human pancreatic islet cells

Affiliations

CRISPR-based genome editing in primary human pancreatic islet cells

Romina J Bevacqua et al. Nat Commun. .

Abstract

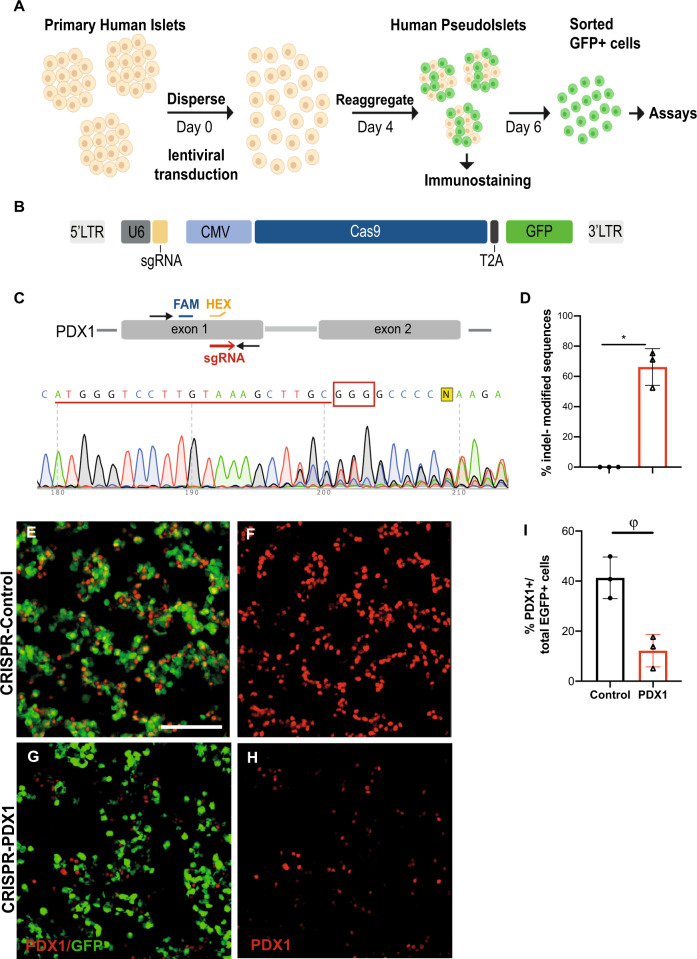
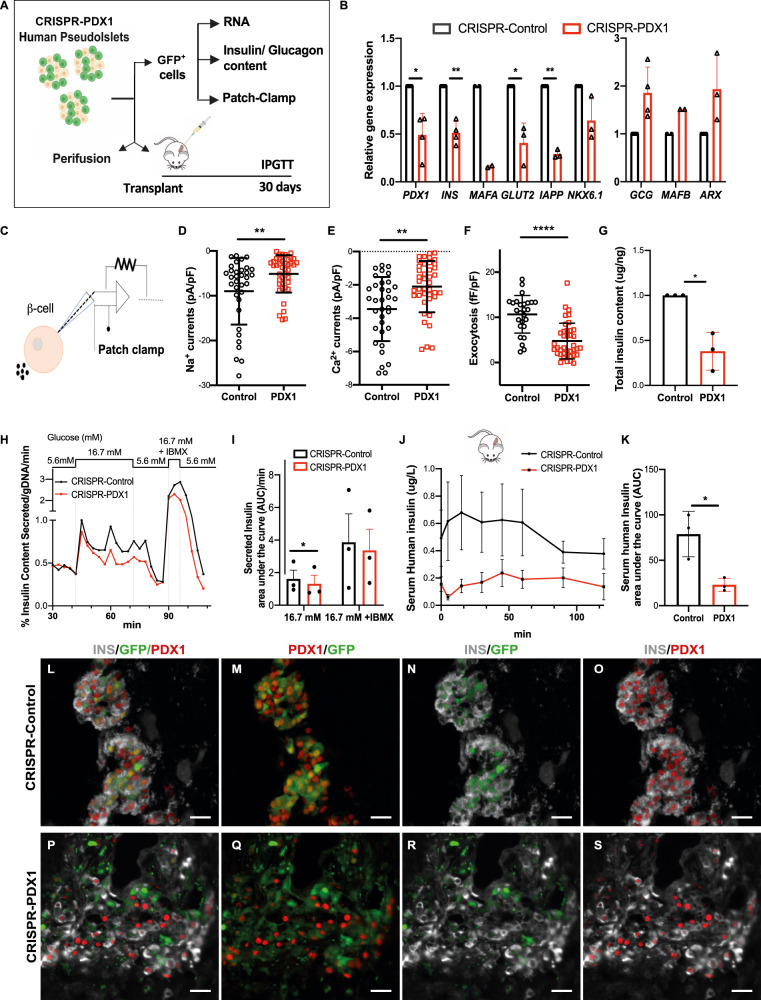
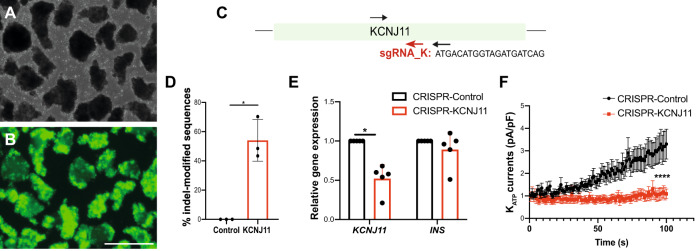
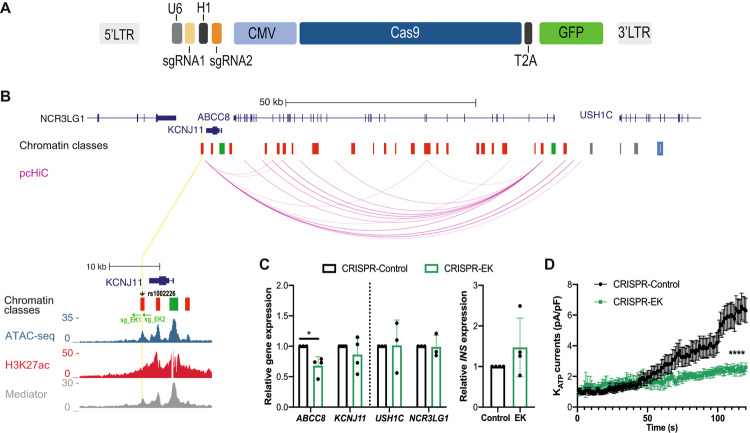
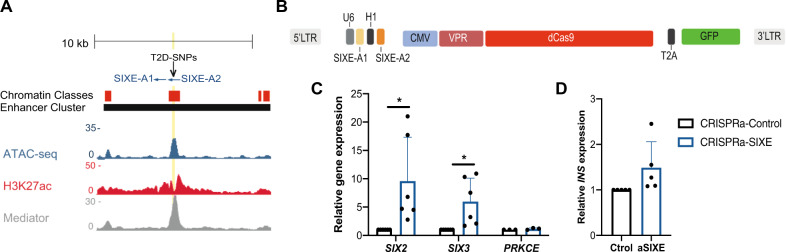
Gene targeting studies in primary human islets could advance our understanding of mechanisms driving diabetes pathogenesis. Here, we demonstrate successful genome editing in primary human islets using clustered regularly interspaced short palindromic repeats (CRISPR) and CRISPR-associated protein 9 (Cas9). CRISPR-based targeting efficiently mutated protein-coding exons, resulting in acute loss of islet β-cell regulators, like the transcription factor PDX1 and the KATP channel subunit KIR6.2, accompanied by impaired β-cell regulation and function. CRISPR targeting of non-coding DNA harboring type 2 diabetes (T2D) risk variants revealed changes in ABCC8, SIX2 and SIX3 expression, and impaired β-cell function, thereby linking regulatory elements in these target genes to T2D genetic susceptibility. Advances here establish a paradigm for genetic studies in human islet cells, and reveal regulatory and genetic mechanisms linking non-coding variants to human diabetes risk.


Conflict of interest statement

The authors declare no competing interests.

Figures

Fig. 1
Fig. 1. CRISPR/Cas9 targeting of PDX1 protein-coding sequence in primary human islets.
A Schematics of the human pseudoislet system. B Scheme of the lentiCRISPR construct used. C PDX1 sequence, showing the sgRNA sequence (underlined in red, PAM sequence recognized by Cas9 in red box). FAM (blue) and HEX (orange) probes used for ddPCR. D Percentage of indel-modified sequences detected by the TIDE algorithm (P = 0.01). EH Immunostaining of CRISPR-Control versus CRISPR-PDX1, showing GFP+ PDX1+ cells (n = 3 independent donor repetitions); scale bar: 50 μm. I Quantification of GFP+ PDX1+ cells for CRISPR-Control versus CRISPR-PDX1(P = 0.07; n = 3 independent donor repetitions). Data are presented as mean values ± SD. Two-tailed t tests were used to generate P-values. *P < 0.05, ϕP < 0.1. Source data are provided as a Source Data file.
Fig. 2
Fig. 2. CRISPR/Cas9 targeting of PDX1 in primary human islets leads to loss-of-function phenotypes.
A Schematics of analyses performed to characterize the phenotype of CRISPR-PDX1 human pseudoislets. B Relative gene expression of known PDX1-targets in CRISPR-PDX1 GFP+ cells relative to CRISPR-Control GFP+ cells (P = 0.0199 for PDX1, P = 0.037 for INS, P = 0.0386 for GLUT2, P = 0.013 for IAPP). C Scheme of β-cell patch clamp. DF β-cells show electrophysiological defects after CRISPR/Cas9 targeting of PDX1, including (D) impaired Na+ (P = 0.057) and (E) Ca2+ currents (P = 0.0012), and (F) reduced glucose-dependent β-cell exocytosis (P < 0.0001). G Total insulin content in CRISPR-PDX1 GFP+ cells relative to CRISPR-Control GFP+ cells (P = 0.036). H Secreted human insulin by CRISPR-Control versus CRISPR-PDX1 pseudoislets in vitro, following perifusion with media containing Glucose at 5.6, 6.7, and 16.7 mM +IBMX. I Area under the curve (AUC) of secreted human insulin by CRISPR-Control versus CRISPR-PDX1 pseudoislets at 16.7 mM (P = 0.0387) and 16.7 mM Glucose +IBMX. J Serum human insulin levels in the blood of NSG mice one-month following transplantation of CRISPR-PDX1 versus CRISPR-Control pseudoislets, following intraperitoneal glucose tolerance tests (IPGTT) (n = 3 independent human islets donors). K Area under the curve of the serum human insulin released by transplanted CRISPR-PDX1 versus CRISPR-Control pseudoislets, shown in (J) (P = 0.049). KS Immunostaining of grafts recovered one-month following transplantation with CRISPR-Control (KO) versus CRISPR-PDX1 (PS) pseudoislets; INS: gray, GFP: green, PDX1: red. Scale bars: 20 um. (n = 3 independent donor repetitions). Data are presented as mean values ± SD for (BG, K) and as mean ± SEM for (I) and (J). Two-tailed t tests were used to generate P-values. *P < 0.05, **P < 0.01, **** P < 0.0001. Source data are provided as a Source Data file.
Fig. 3
Fig. 3. CRISPR/Cas9 targeting of KCNJ11 protein-coding sequence in primary human islets.
A, B Human pseudoislets 5 days post-infection with CRISPR-KCNJ11 lentiviruses (A) bright field, (B) blue light (488 nm), scale bar: 500 μm (n = 3 independent donors). C Schematics of KCNJ11 sequence, showing the sgRNA sequence (sgRNA_K, red). Arrows indicate primers used for PCR. D Percentage of indel-modified sequences detected by TIDE algorithm (n = 3 independent donors; P = 0.0225). E qRT-PCR of GFP+ cells, CRISPR-KCNJ11 (red), CRISPR-Control (Black) (n = 5 independent donors; P = 0.0175). F Patch clamping in single β-cells: measurement of KATP currents in CRISPR-KCNJ11 (n = 19 cells, 3 replicates) and CRISPR-Control (n = 25, 3 replicates) (P < 0.0001). Data are presented as mean values ± SD for (DE) and mean values ± SEM for (F). Two-tailed t tests were used to generate P-values. *P < 0.05, **** P < 0.0001. Source data are provided as a Source Data file.
Fig. 4
Fig. 4. CRISPR/Cas9 targeting of a non-coding variant in the ABCC8-KCNJ11 locus impairs ABCC8 expression and function in primary human islets.
A Schematic of the lenti-construct used for simultaneous expression of two sgRNAs, Cas9 and GFP (12,021 bp) in primary human islets. B Genome Browser tracks of the genomic context in the KCNJ11-ABCC8 locus, arcs representing high-confidence pcHi-C interactions in human islets, highlighting variant rs1002226 (chr11:17405617) associated with diabetes risk (black arrowhead): This variant maps to a CTCF site (blue) on a class I active enhancer (yellow line, and zoomed inset); sg_EK1 and sg_EK2 flanking rs1002226 (green arrows); Chromatin classes: active promoter (green); active enhancer (red); inactive enhancer (gray); inactive open chromatin (black); strong CTCF (blue). Accessible chromatin regions in human islets are shown by ATAC-seq, H3K27ac, and Mediator ChiP-seq. C ABCC8 mRNA is regulated by the rs1002226-containing enhancer in GFP+ pseudoislet cells, CRISPR-EK (green), CRISPR-Control (Black) (P = 0.0232; n = 4), while expression of KCNJ11, control genes (USH1C, NCR3LG1) in the same transcription activation domain, TAD (n = 3) and insulin (n = 4) were not modified. Data are presented as mean values +SD. D Measurement of KATP currents in GFP+ islet cells from CRISPR-EK (n = 26 cells, 3 replicates) and CRISPR-Control (n = 33, 3 replicates) (P < 0.0001). Data are presented as mean values ± SEM. Two-tailed t tests were used to generate P-values. *P < 0.05, **** P < 0.0001. Source data are provided as a Source Data file.
Fig. 5
Fig. 5. CRISPR/Cas9 targeting of a putative enhancer element in the SIX2-SIX3 locus in primary human islets.
A Genome Browser tracks of the genomic context in the SIX2-SIX3 locus, highlighting the putative SIX2-SIX3 enhancer element (SIXE) with variants previously linked to increased risk of fasting glucose hyperglycemia and T2D (T2D-SNPs, black arrowheads): These variants map to an active enhancer within an enhancer cluster (yellow line, and zoomed inset); sgRNAs used for CRISPR-Cas9 targeting of the region flanking FG-SNP: SIXE-3′ and SIXE-5′ (red arrows). The two sgRNAs were cloned in the same construct (scheme in Fig. 4A). Chromatin classes: active promoter (green); active enhancer (red); inactive enhancer (gray); inactive open chromatin (black); strong CTCF (blue). Accessible chromatin regions in human islets are shown by ATAC-seq, H3K27ac and mediator ChiP-seq. B Islet eQTLs showing association of reduced expression levels of SIX2 and SIX3 and variants within the SIXE region targeted in this study (cis-eQTL mapping across 292 human islet samples, q-val= 4.9e−12 for rs12712929-TT and reduced level of SIX3 and q-val= 0.008, for rs12712928 -CC and reduced expression of SIX2). Box plot shows the interquartile range (IQR) of 1st (Q25) and 3rd (Q75) quartiles, with the median as a black line in the center, and whiskers depict ± 1.5 times the IQR. For SIX3 and GT, GT, and TT genotypes, Q25 values are 2.09, 1.41 and −2.03, and Q75 values are 3.92, 3.04, and −1.10, respectively. For SIX2 and GG, GC and CC genotypes, Q25 values are 2.02, 1.89 and 1.27, and Q75 values are 3.42, 3.20, and 1.03, respectively. C Scheme of the ddPCR assay used to identify gene editing as consequence of targeting by SIXE-5′, SIXE-3′, or both (SIXE-5′−3′) in the pseudoislets targeted with SIXE-5′–3′. HEX probes are shown with an orange line, FAM reference probes, in blue DF Example of ddPCR 2D plots showing GFP+ cells modified by (D) SIXE-5′, (E) SIXE-3′, (F) SIXE-5′–3′ (KO cells: FAM+/HEX, blue droplets; wild-type droplets: FAM+/HEX+, orange, n = 2 independent donor samples). G Total percentage of gene-edited alleles in GFP+ cells, showing the contribution of (DF) in the DNA of GFP+ islet cells. HJ mRNA levels of (H) SIX3 (n = 6 independent donors; P = 0.0279), SIX3-AS1 (n = 5 independent donors; P = 0.0437) and SIX2 (n = 6 independent donors; P = 0.04), (I) control genes (n = 4 independent donor samples), (J) INS (n = 4 independent donor samples) in GFP+ cells targeted with CRISPR-SIXE-5′–3′. (K) Total insulin content of sorted GFP+ cells normalized to genomic DNA (gDNA) content (P = 0.0391; n = 4 independent donor samples). Data are presented as mean values ± SD. Two-tailed t tests were used to generate P-values. *P < 0.05. Source data are provided as a Source Data file.
Fig. 6
Fig. 6. CRISPR/dCas9 activation of a putative enhancer element in the SIX2-SIX3 locus in primary human islets.
A Genome browser tracks highlighting the putative SIX2-SIX3 enhancer element (SIXE) with variants previously linked to increased risk of fasting glucose hyperglycemia and T2D (T2D-SNPs, black arrowheads): These variants map to an active enhancer within an enhancer cluster (yellow line); sgRNAs used for CRISPRa: SIXE-A1, SIXE-A2. Chromatin classes: active enhancer (red); Accessible chromatin regions in human islets are shown by ATAC-seq, H3K27ac, and Mediator ChiP-seq. B Schematics of the lenti-construct used for simultaneous expression of two sgRNAs, VPR, dCas9 and GFP (13,728 bp) in primary human islets. CD mRNA levels of (C) SIX2 (P = 0.042; n = 6 independent donors), SIX3 (P = 0.0328; n = 6 independent donors), PRKCE (n = 3 independent donors) and (D) INS (n = 5 independent donors), in GFP+ cells after CRISPRa of SIXE (CRISPRa-SIXE). Data are presented as mean values ± SD. Two-tailed t tests were used to generate P-values. *P < 0.05. Source data are provided as a Source Data file.

Similar articles

Cited by

References

    1. Gloyn AL, et al. Activating mutations in the gene encoding the ATP-sensitive potassium-channel subunit Kir6.2 and permanent neonatal diabetes. N. Engl. J. Med. 2004;350:1838–1849. doi: 10.1056/NEJMoa032922. - DOI - PubMed
    1. Njølstad PR, et al. Neonatal diabetes mellitus due to complete glucokinase deficiency. N. Engl. J. Med. 2001;344:1588–1592. doi: 10.1056/NEJM200105243442104. - DOI - PubMed
    1. Stoffers DA, Zinkin NT, Stanojevic V, Clarke WL, Habener JF. Pancreatic agenesis attributable to a single nucleotide deletion in the human IPF1 gene coding sequence. Nat. Genet. 1997;15:106–110. doi: 10.1038/ng0197-106. - DOI - PubMed
    1. Ashcroft FM, Rorsman P. Diabetes mellitus and the β cell: the last ten years. Cell. 2012;148:1160–1171. doi: 10.1016/j.cell.2012.02.010. - DOI - PMC - PubMed
    1. Inshaw JRJ, Cutler AJ, Burren OS, Stefana MI, Todd JA. Approaches and advances in the genetic causes of autoimmune disease and their implications. Nat. Immunol. 2018;19:674–684. doi: 10.1038/s41590-018-0129-8. - DOI - PubMed

Publication types

MeSH terms

Substances