. 2021 Apr 23;12(1):2425.
doi: 10.1038/s41467-021-22407-6.

Co-delivery of IOX1 and doxorubicin for antibody-independent cancer chemo-immunotherapy

Affiliations

Co-delivery of IOX1 and doxorubicin for antibody-independent cancer chemo-immunotherapy

Jing Liu et al. Nat Commun. .

Abstract

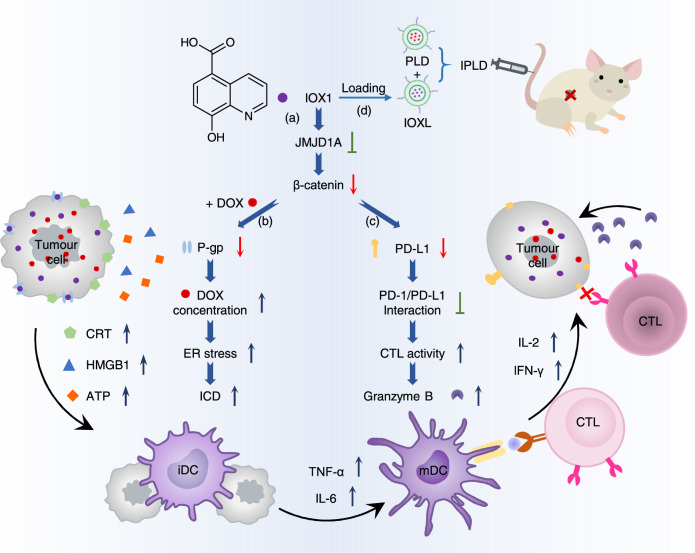
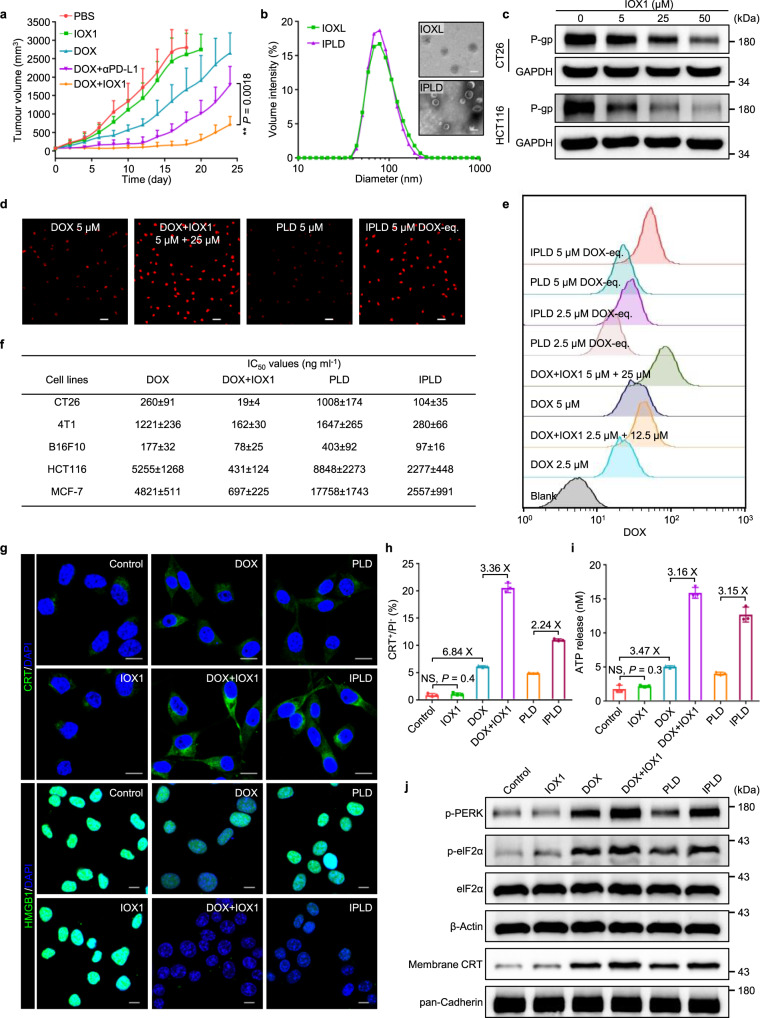
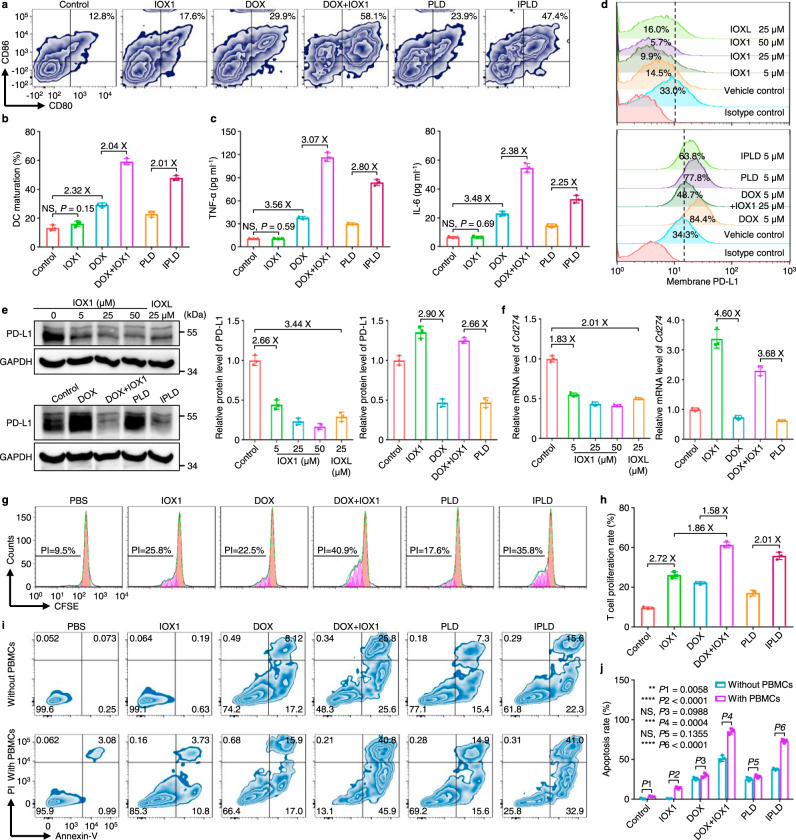
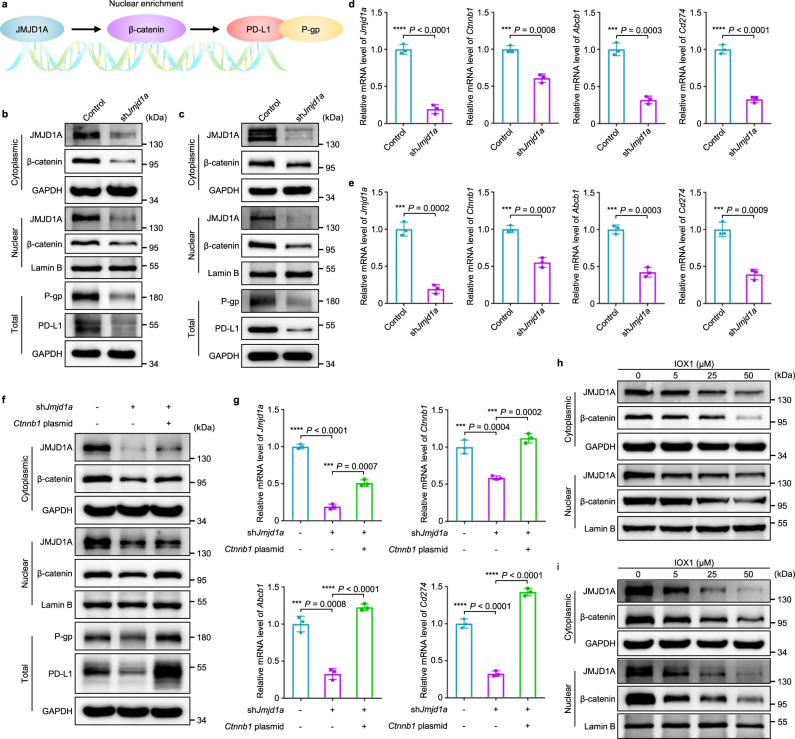
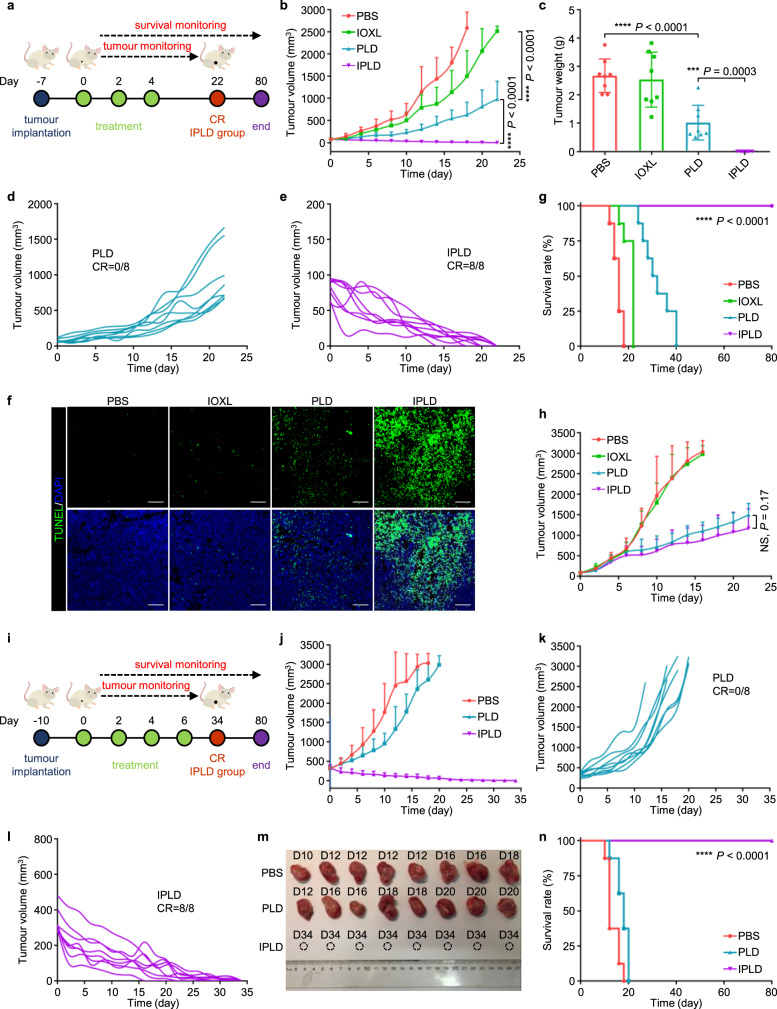
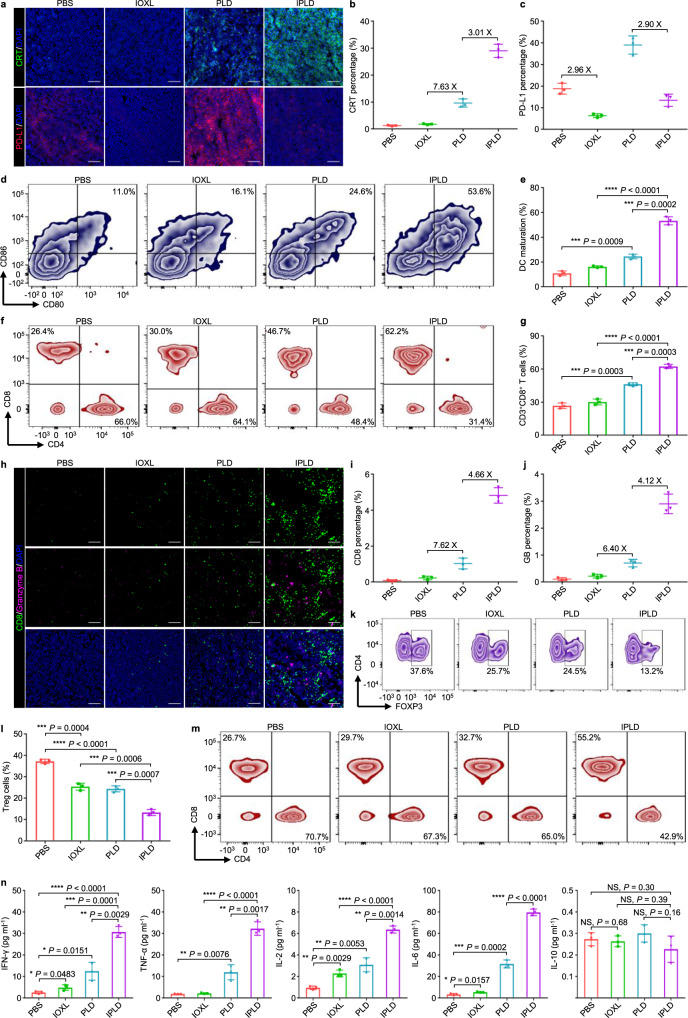
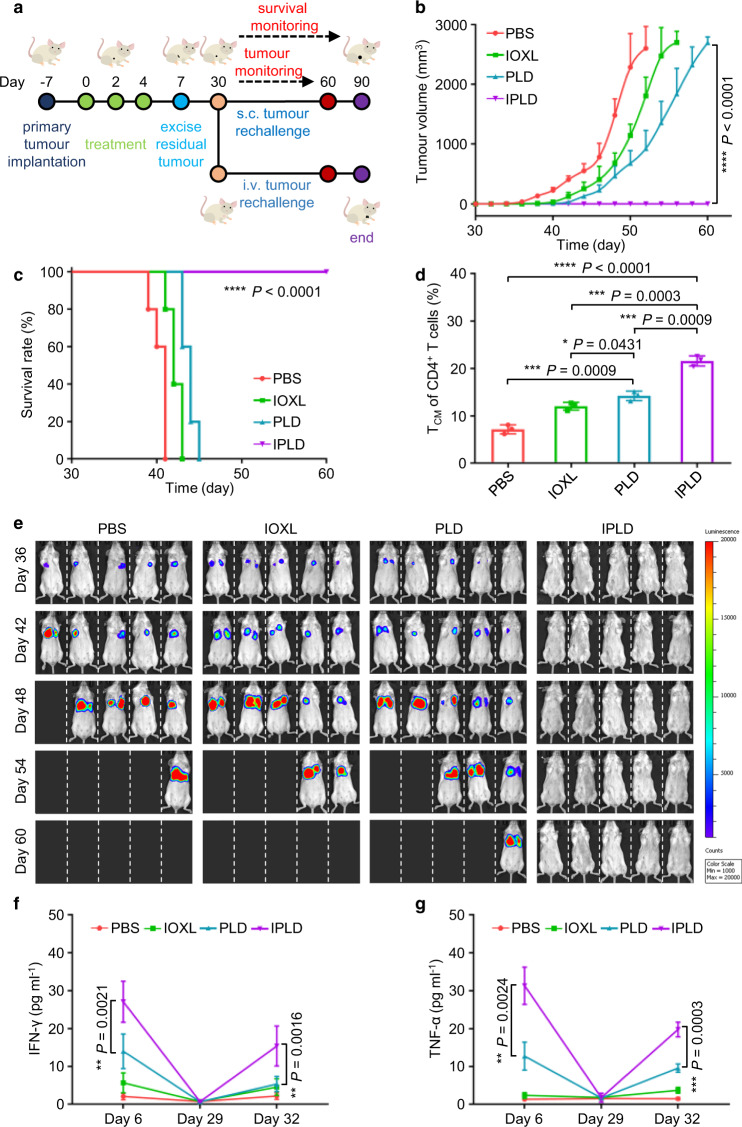
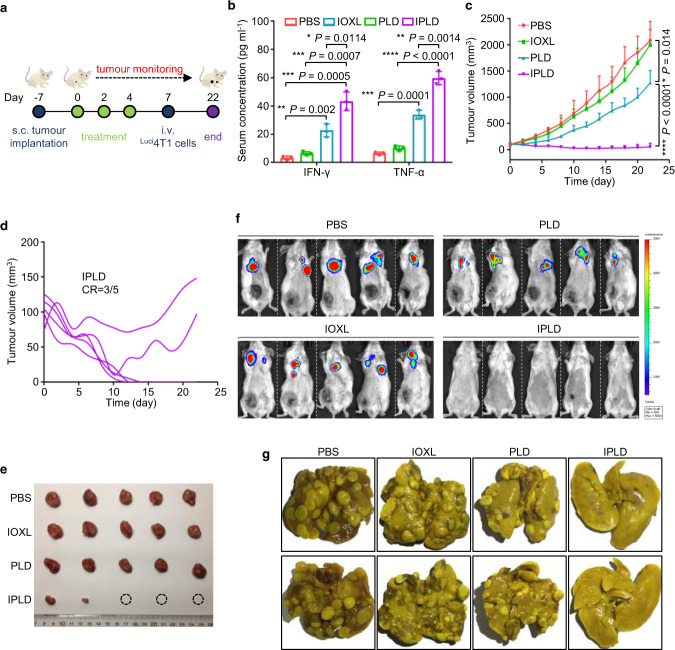
Anti-programmed cell death-1 (PD-1)/programmed cell death-ligand 1 (PD-L1) antibodies are currently used in the clinic to interupt the PD-1/PD-L1 immune checkpoint, which reverses T cell dysfunction/exhaustion and shows success in treating cancer. Here, we report a histone demethylase inhibitor, 5-carboxy-8-hydroxyquinoline (IOX1), which inhibits tumour histone demethylase Jumonji domain-containing 1A (JMJD1A) and thus downregulates its downstream β-catenin and subsequent PD-L1, providing an antibody-independent paradigm interrupting the PD-1/PD-L1 checkpoint. Synergistically, IOX1 inhibits cancer cells' P-glycoproteins (P-gp) through the JMJD1A/β-catenin/P-gp pathway and greatly enhances doxorubicin (DOX)-induced immune-stimulatory immunogenic cell death. As a result, the IOX1 and DOX combination greatly promotes T cell infiltration and activity and significantly reduces tumour immunosuppressive factors. Their liposomal combination reduces the growth of various murine tumours, including subcutaneous, orthotopic, and lung metastasis tumours, and offers a long-term immunological memory function against tumour rechallenging. This work provides a small molecule-based potent cancer chemo-immunotherapy.


Conflict of interest statement

The authors declare no competing interests.

Figures

Fig. 1
Fig. 1. 5-Carboxy-8-hydroxyquinoline (IOX1) potentiates chemo-immunotherapy.
a IOX1 inhibits the histone demethylase Jumonji domain-containing 1A (JMJD1A) and thus downregulates its downstream β-catenin expression; b it downregulates P-glycoproteins (P-gp) and increases doxorubicin (DOX) concentration of cancer cells, facilitating the immunogenic cell death (ICD); c it downregulates tumour cells’ PD-L1 expression and thus disrupts the PD-1/PD-L1 pathway with T cells. d The synergy of the two effects enables its liposome formula (IOXL) combined with pegylated liposomal DOX (PLD), i.e. IPLD, to inhibit tumour growth. ER: endoplasmic reticulum, CRT: calreticulin, HMGB1: high mobility group box 1, ATP: adenosine triphosphate, iDC: immature dendritic cell, mDC: mature dendritic cell, CTL: cytotoxic T lymphocyte.
Fig. 2
Fig. 2. IOX1 liposome formulation, inhibiting drug resistance, and potentiating cytotoxicity and ICD induction.
a Tumour growth curves of s.c. CT26 tumours in BALB/c mice treated via the tail vein injection of IOX1 (7.5 mg kg−1), DOX (5 mg kg−1), their combination (IOX1 + DOX) or DOX + αPD-L1 (DOX, 5 mg kg−1, i.v.; αPD-L1,7.5 mg kg−1, i.p.) on an every-two-day schedule for three times; initial tumour volume, 80 mm3; n = 6 mice. b Size distribution and morphology of liposomal IOX1 (IOXL) and IPLD (the mixed IOXL and PLD at an IOX1/DOX molar ratio of 5: 1) characterised by DLS and TEM; scale bars, 100 nm for the inset TEM images; n = 3 independent samples. c Western blotting images of P-gp in CT26 and HCT116 cells treated with IOX1 (5, 25, and 50 μM) for 24 h. d,e Intracellular DOX concentration analysis by (d) the fluorescence images and (e) flow cytometry analysis of CT26 cells treated with DOX or its combination with IOX1 or their liposomes for 4 h; red: DOX; scale bars, 50 μm. f The IC50 values of DOX, its combination with IOX1, or their liposomes against tumour cells; 48 h incubation; the IOX1/DOX molar ratio was kept at 5: 1; see Supplementary Fig. 16 for the dose-responsive curves. gj ICD induction in CT26 cells treated with IOX1 or its combinations: (g) CLSM images of the CRT exposure (green) and the nuclear HMGB1 (green); blue: DAPI; scale bars, 10 μm; (h) flow cytometric analysis of CRT-positive cells (gated on the propidium iodide negative cells (PI-)) and (i) ATP secreted into the medium; n = 3 independent experiments; (j) Western blotting images of p-PERK, p-eIF2α and membrane CRT; Cells were treated with IOX1 (25 μM), DOX (5 μM), their combination, or their liposomes for 4 h. In (ce,g,j), the experiments were repeated independently three times to confirm the results. Data represent mean ± SD. Two-tailed Student’s t test. NS no significance; ** P < 0.01. Source data are provided as a Source Data file.
Fig. 3
Fig. 3. IOX1 mediates dendritic cell (DC) maturation, downregulates cancer cell PD-L1 expression, and promotes T cell proliferation and activity.
ac DC maturation determined by (a) flow cytometry and (b) quantification of the mature DCs (CD11c+CD80+CD86+), and their secretion of (c) TNF-α and IL-6 in supernatants; CT26 cells were pre-treated with IOX1, DOX, their combination, PLD, or IPLD; DOX dose, 5 μM; IOX1 dose, 25 μM; 24 h; they were co-incubated with DCs for another 24 h; n = 3 independent experiments. df IOX1 downregulated the endogenous PD-L1 measured by (d) flow cytometry and (e) western blotting and quantification, and (f) the Cd274 mRNA levels analyzed by qPCR in the cells; CT26 cells were treated as indicated in (ac) for 24 h; n = 3 independent experiments. gj T cell (PBMC) proliferation and cytotoxic-activity after incubating with pre-treated CT26 cells: (g,h) flow cytometric profiles and their calculated proliferation indices (PIs) of T cells; i,j flow cytometric analysis and quantifications of the apoptotic CT26 cells with or without PBMCs co-culturing; CT26 cells were pre-treated as indicated in (ac) for 24 h; the isolated cells were co-cultured with PBMCs in fresh medium for 3 days; the treated cells in fresh medium without PBMCs were cultured for comparison. n = 3 independent experiments. Data represent mean ± SD. Two-tailed Student’s t test. NS no significance; ** P < 0.01, *** P < 0.001, **** P < 0.0001. Source data are provided as a Source Data file.
Fig. 4
Fig. 4. IOX1 downregulates P-gp and PD-L1 expression through JMJD1A/β-catenin signaling pathway.
a The pathway by which JMJD1A promotes P-gp and PD-L1 expression in tumour cells. The overexpressed JMJD1A increases the nuclear enrichment of β-catenin, which in turn accelerates the transcription and translation of downstream targets, including P-gp and PD-L1. be Effects of JMJD1A-knockdown on protein expressions measured by western blotting (b,c) or gene expressions measured by qPCR (d,e) in CT26 (b,d) or HCT116 (c,e) cells; 4 × 105 cells were transfected with shJmjd1a (2 μg/well) for 48 h; n = 3 independent experiments in (d,e). f,g Effects of β-catenin rescue in JMJD1A-knockdown CT26 cells on the P-gp and PD-L1 expressions: (f) the relative protein levels and (g) mRNA levels of JMJD1A (Jmjd1a), β-catenin (Ctnnb1), P-gp (Abcb1) and PD-L1 (Cd274) in CT26 cells; 4 × 105 cells were transfected with shJmjd1a (2 μg/well) for 48 h followed by transfection with Ctnnb1 plasmid (2 μg/well) for 24 h; n = 3 independent experiments in (g). h,i IOX1 dose-dependent reduction of JMJD1A and β-catenin protein levels in CT26 (h) and HCT116 (i) cells; 24 h treatment. In (b,c,f,h,i), the experiments were repeated independently three times to confirm the results. Data represent mean ± SD. Two-tailed Student’s t test. ***P < 0.001, ****P < 0.0001. Source data are provided as a Source Data file.
Fig. 5
Fig. 5. IPLD treatment of s.c. CT26 tumours.
ag Treatment of small tumours: (a) Experimental schedule; After 7 days of s.c. inoculation with 5 × 105 CT26 cells, the tumours reached about 80 mm3, and the treatment was initiated (noted as Day 0) with PBS, IOXL, PLD or IPLD at 7.5 mg kg−1 IOX1, 5 mg kg−1 DOX on every 2 days for 3 times. (b) The tumour growth curves, (c) the averaged tumour weight of each group on Day 22; n = 8 mice. (d,e) The individual tumour growth curves of the PLD group or the IPLD group in (b); CR: complete response. (f) TUNEL staining of the tumour sections dissected on day 11; green: TUNEL; blue: DAPI; scale bars: 100 μm; the experiment was repeated independently three times to confirm the results. (g) Kaplan–Meier analysis of the mice; n = 8 mice. h The tumour growth curves of s.c. CT26 tumours in nude mice treated as in (a); n = 6 mice. in Treatment of large s.c. 350 mm3 CT26 tumours in BALB/c mice: (i) Experimental schedule; treatments as in (a) every 2 days for 4 times. (j) The tumour growth curves; n = 8 mice. (k,l) The individual tumour growth curves of the PLD group or the IPLD group. (m) The images of the tumours dissected on the indicated days. (n) Kaplan–Meier analysis of the mice; n = 8 mice. Data represent mean ± SD. Statistical significance was analyzed by two-tailed Student’s t test (b,c,h) or by the log-rank (Mantel–Cox) test (g,n). NS no significance; *** P < 0.001, **** P < 0.0001. Source data are provided as a Source Data file.
Fig. 6
Fig. 6. IPLD-induced immune responses of the CT26 tumour-bearing BALB/c mice.
The mice were inoculated and treated as the schedule in Fig. 5a; on 7 days after the last treatment (Day 11), the serum, tumours, tumour-draining lymph nodes (TDLNs), and spleens were collected for analysis. ac CRT exposure and PD-L1 expression in the tumours by (a) immunostaining (green: CRT; red: PD-L1; blue: DAPI; scale bars, 100 μm) and the quantification of (b) CRT exposure and (c) PD-L1 expression by ImageJ; n = 3 mice. d,e Flow cytometry analysis of the mature DCs (CD11c+CD80+CD86+) in TDLNs: (d) the contour diagrams and (e) quantification; n = 3 mice. f,g Flow cytometry analysis of cytotoxic T lymphocytes (gated on CD3+CD8+, CTLs) in the tumours: (f) the contour diagrams and (g) quantification; n = 3 mice. hj CD8 and granzyme B in the tumours: (h) immunostaining images (green: CD8; pink: granzyme B; blue: DAPI; scale bars, 100 μm) and the quantification of (i) CD8 and (j) granzyme B expression by ImageJ; n = 3 mice. k,l Flow cytometry analysis of regulatory T cells (CD4+FOXP3+) in the tumours: (k) the contour diagrams and (l) quantification; n = 3 mice. m Flow cytometry analysis of the CTLs (CD3+CD8+) in the spleens; the experiment was repeated independently three times to confirm the results. n Quantification of systemic cytokines in the serum of the mice; n = 3 mice. Data represent mean ± SD. Two-tailed Student’s t test. NS no significance; *P < 0.05, **P < 0.01, ***P < 0.001, ****P < 0.0001. Source data are provided as a Source Data file.
Fig. 7
Fig. 7. IPLD treatment-induced long-term antitumour immunological memory tested by tumour rechallenging.
a Experimental schedule: BALB/c mice with primary s.c. CT26 tumours of about 80 mm3 were treated with the liposome formulas at 7.5 mg kg−1 IOX1, 5 mg kg−1 DOX every 2 days for three times; 3 days after the last treatment (Day 7), the tumours of the mice in the PBS, IOXL and PLD groups were surgically removed, and the wounds were sutured; the IPLD group needed no surgery as all the primary tumours disappeared after treatment. On Day 30, the mice in each treatment group were divided into two subgroups; one was s.c. inoculated with CT26 cells (5 × 105) and the other was i.v. injected with 5 × 105 LuciCT26 cells. b,c The tumour growth curves (b) and Kaplan–Meier analysis (c) of the mice bearing the rechallenged s.c. tumours; n = 5 mice. d Quantitative analysis of the central memory T cells (CD4+CD44+CD122+) in spleens of the mice on Day 11; n = 3 mice. e In vivo bioluminescence imaging the rechallenged lung tumours at different times; n = 5 mice. f,g The IFN-γ and TNF-α levels in the serum of mice in (e) on Day 6, 29, and 32; n = 3 mice. Data represent mean ± SD. Statistical significance was analyzed by two-tailed Student’s t test (b,d,f,g) or by the log-rank (Mantel–Cox) test (c). * P < 0.05, ** P < 0.01, *** P < 0.001, **** P < 0.0001. Source data are provided as a Source Data file.
Fig. 8
Fig. 8. IPLD treatment of orthotopic and lung metastatic dual tumours of 4T1 triple-negative breast cancer.
a Experimental schedule for the dual tumour model: BALB/c mice were s.c. inoculated with 1 × 106 4T1 cells at the left mammary gland; when the tumours reached about 100 mm3, the treatments were initiated (noted as Day 0) with the liposome formulas at 7.5 mg kg−1 IOX1, 5 mg kg−1 DOX or their combination every 2 days for three times; 3 days after the last treatment (Day 7), Luci 4T1 cells (5 × 105) were injected to the mice via the tail vein. b The serum IFN-γ and TNF-α levels in the mice determined on day 9; n = 3 mice. c The tumour growth curves of the orthotopic 4T1 tumours; n = 5 mice. d The individual tumour growth of each mouse in the IPLD-treated group; CR: complete response. e The images of the tumours dissected at the end of the experiment (Day 22). f In vivo live bioluminescence imaging the Luci4T1 tumours in lungs on day 22; n = 5 mice. g Representative photographs of the lungs dissected from the mice on day 22. Data represent mean ± SD. Two-tailed Student’s t test. * P < 0.05, ** P < 0.01, *** P < 0.001, **** P < 0.0001. Source data are provided as a Source Data file.

Similar articles

Cited by

References

    1. Pardoll DM. The blockade of immune checkpoints in cancer immunotherapy. Nat. Rev. Cancer. 2012;12:252–264. doi: 10.1038/nrc3239. - DOI - PMC - PubMed
    1. Sun C, Mezzadra R, Schumacher TN. Regulation and function of the PD-L1 checkpoint. Immunity. 2018;48:434–452. doi: 10.1016/j.immuni.2018.03.014. - DOI - PMC - PubMed
    1. Jiang X, et al. Role of the tumor microenvironment in PD-L1/PD-1-mediated tumor immune escape. Mol. Cancer. 2019;18:10. doi: 10.1186/s12943-018-0928-4. - DOI - PMC - PubMed
    1. Robert C, et al. Pembrolizumab versus ipilimumab in advanced melanoma. N. Engl. J. Med. 2015;372:2521–2532. doi: 10.1056/NEJMoa1503093. - DOI - PubMed
    1. Delivanis DA, et al. Pembrolizumab-induced thyroiditis: comprehensive clinical review and insights into underlying involved mechanisms. J. Clin. Endocr. Metab. 2017;102:2770–2780. doi: 10.1210/jc.2017-00448. - DOI - PMC - PubMed

Publication types

MeSH terms