. 2021 Apr 23;12(1):2429.
doi: 10.1038/s41467-021-22601-6.

Estimating the effect of social inequalities on the mitigation of COVID-19 across communities in Santiago de Chile

Affiliations

Estimating the effect of social inequalities on the mitigation of COVID-19 across communities in Santiago de Chile

Nicolò Gozzi et al. Nat Commun. .

Abstract

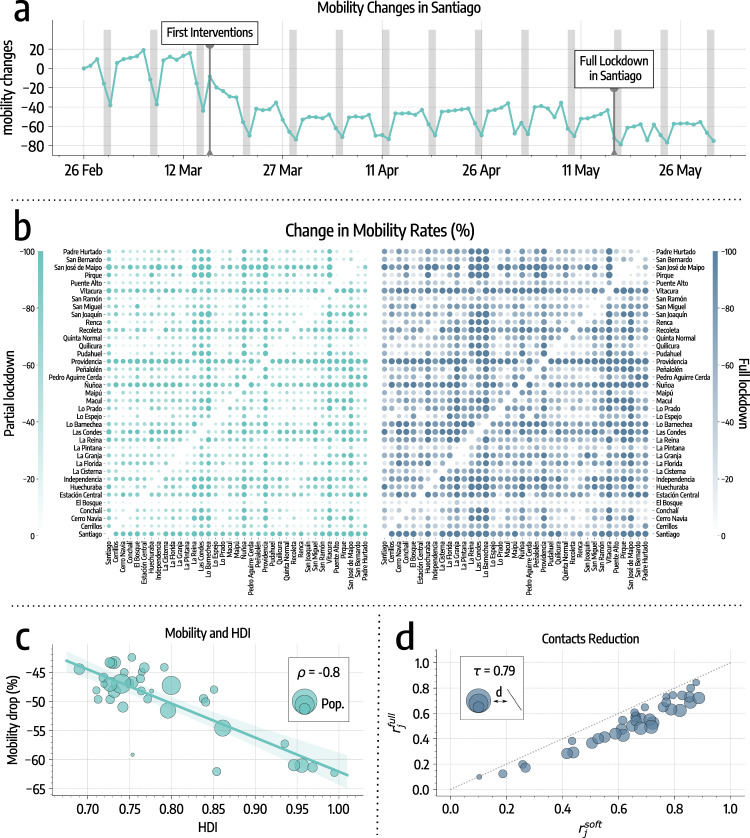
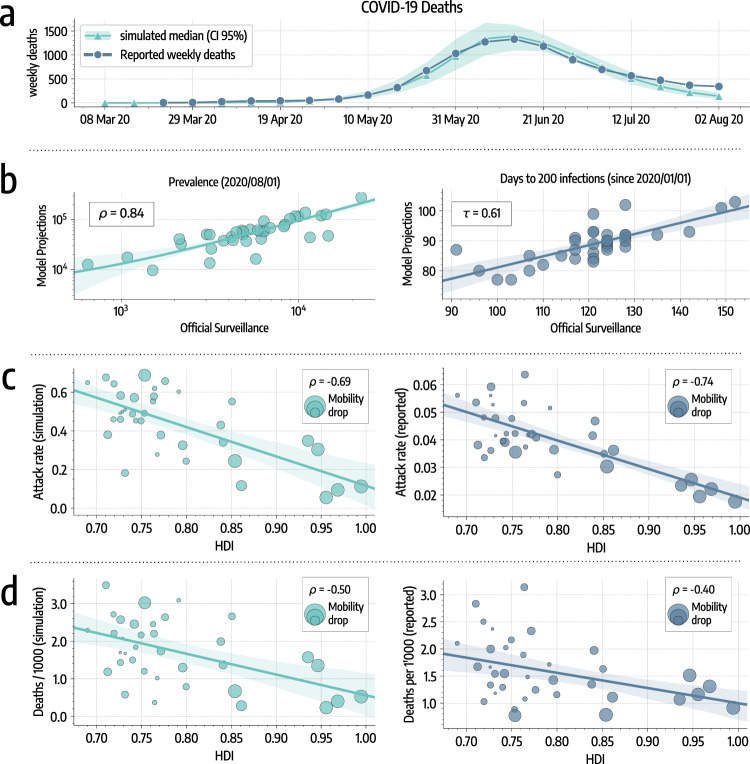
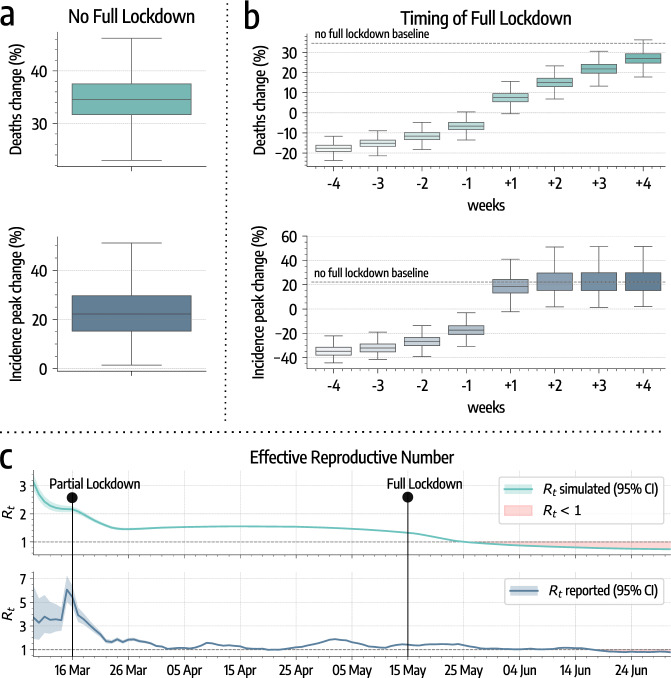
We study the spatio-temporal spread of SARS-CoV-2 in Santiago de Chile using anonymized mobile phone data from 1.4 million users, 22% of the whole population in the area, characterizing the effects of non-pharmaceutical interventions (NPIs) on the epidemic dynamics. We integrate these data into a mechanistic epidemic model calibrated on surveillance data. As of August 1, 2020, we estimate a detection rate of 102 cases per 1000 infections (90% CI: [95-112 per 1000]). We show that the introduction of a full lockdown on May 15, 2020, while causing a modest additional decrease in mobility and contacts with respect to previous NPIs, was decisive in bringing the epidemic under control, highlighting the importance of a timely governmental response to COVID-19 outbreaks. We find that the impact of NPIs on individuals' mobility correlates with the Human Development Index of comunas in the city. Indeed, more developed and wealthier areas became more isolated after government interventions and experienced a significantly lower burden of the pandemic. The heterogeneity of COVID-19 impact raises important issues in the implementation of NPIs and highlights the challenges that communities affected by systemic health and social inequalities face adapting their behaviors during an epidemic.


Conflict of interest statement

A.V. and M.C. report grants from Metabiota Inc., outside the submitted work; M.T. reports personal fees from GSK, outside the submitted work. All other authors declare no competing interests.

Figures

Fig. 1
Fig. 1. Mobility and contacts changes in Santiago.
a Overview of mobility changes, we consider the number of devices visiting a comuna different from their home one as a proxy for general mobility (gray areas represent weekends). Changes are expressed as percentages with respect to February 26. b Percentage changes in mobility rates (with respect to mobility before March 16). On the left drop-in mobility after the partial lockdown, on the right after the full lockdown. Color and dots size are scaled according to the magnitude of the change. c Average percentage mobility decreases after March 16 versus HDI of different comunas. We display the regression line, 95% CI, and the Pearson correlation coefficient ρ. Dots size is proportional to the population of the comuna. d Scatter plot of contacts reduction parameters during partial (rjpartial) and full (rjfull) lockdown. We display the Kendall rank correlation coefficient τ. Dots size is proportional to the distance from the diagonal (bigger dots indicate comunas where contacts decreased more after the full lockdown).
Fig. 2
Fig. 2. SARS-CoV-2 spreading in Santiago.
a We represent the simulated (median and 95% CI) and reported weekly deaths used for model calibration. b Left: scatter plot of reported versus simulated cases as of August 1, 2020. Right: scatter plot of days (since January 1, 2020) needed to reach 200 infections in each comuna as reported by official surveillance and as projected by our model. c Scatter plot of HDI versus attack rate as of August 1, 2020, in different comunas as projected by our model (left) and as reported by official surveillance (right). Size of dots is scaled according to the mobility drops after March 16 (bigger bullets indicate bigger decreases in mobility). d Scatter plot of HDI versus deaths per 1000 as of August 1, 2020, in different comunas as projected by our model (left) and as reported by official surveillance (right). Size of dots are scaled according to mobility drops after March 16. In panels b, c, and d we show regression lines, 95% CI, and Pearson correlation coefficient ρ or Kendall rank correlation coefficient τ.
Fig. 3
Fig. 3. Impact of nonpharmaceutical interventions on COVID-19 spreading.
a Model estimates of percentage increases in deaths and incidence peak intensity without the implementation of the full lockdown (based on n = 5000 stochastic realizations). b Model estimates of percentage changes in deaths and in incidence peak intensity moving the date of the full lockdown of −4/+4 weeks (based on n = 5000 stochastic realizations). In both panels, the center of the boxes indicates the median, the bounds indicate the interquartile range (IQR) (i.e., the range between first quartile, Q1, and third quartile, Q3), and the whiskers indicate the minimum and the maximum defined respectively as Q1 − 1.5IQR and Q3 + 1.5IQR. c Effective Reproductive Number Rt estimated on simulated and officially reported cases. The two time series show a high positive Pearson correlation coefficient (ρ = 0.78, p < 0.001). The shaded red area indicates Rt < 1.

References

    1. Covid-19 in Chile. https://www.gob.cl/coronavirus/cifrasoficiales/ (2020).
    1. Canals, M. et al. Epidemic trends, public health response and health system capacity: the Chilean experience in four months of the COVID-19 pandemic. Rev. Panam Salud Publica. 44, e99 (2020). - PMC - PubMed
    1. Chilean government interventions against COVID-19. https://www.gob.cl/coronavirus/plandeaccion/ (2020).
    1. Aleta A, et al. Modelling the impact of testing, contact tracing and household quarantine on second waves of COVID-19. Nat. Hum. Behav. 2020;4:964–971. doi: 10.1038/s41562-020-0931-9. - DOI - PMC - PubMed
    1. Shi, Q. et al. Effective control of SARS-CoV-2 transmission in Wanzhou, China. Nat. Med.27, 86–93 (2021). - PubMed

Publication types

MeSH terms