. 2021 Apr 23;12(1):2436.
doi: 10.1038/s41467-021-21952-4.

The impact of non-additive genetic associations on age-related complex diseases

Affiliations

The impact of non-additive genetic associations on age-related complex diseases

Marta Guindo-Martínez et al. Nat Commun. .

Abstract

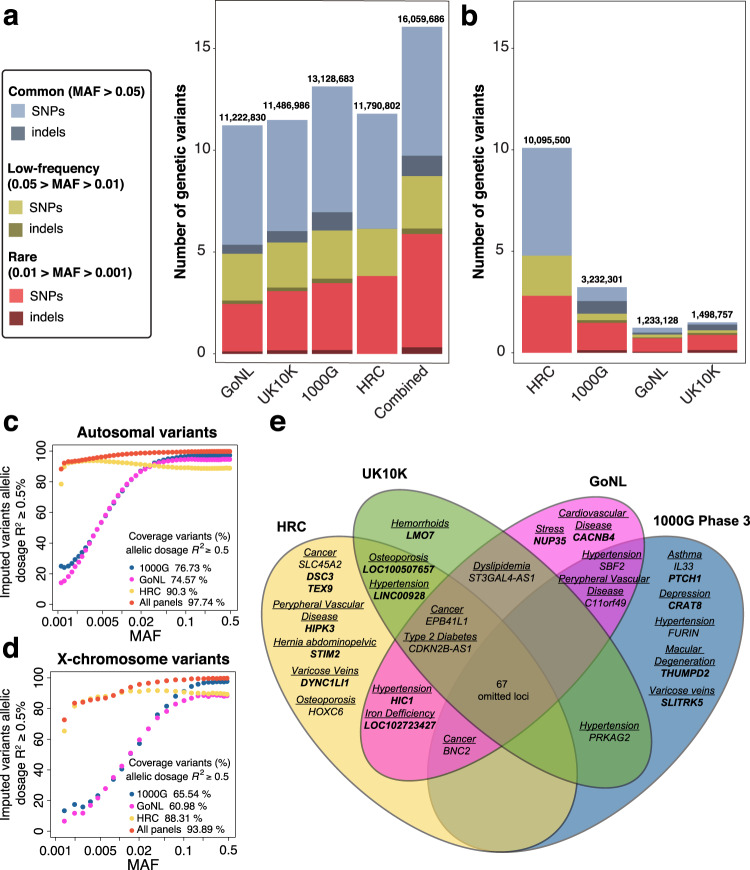
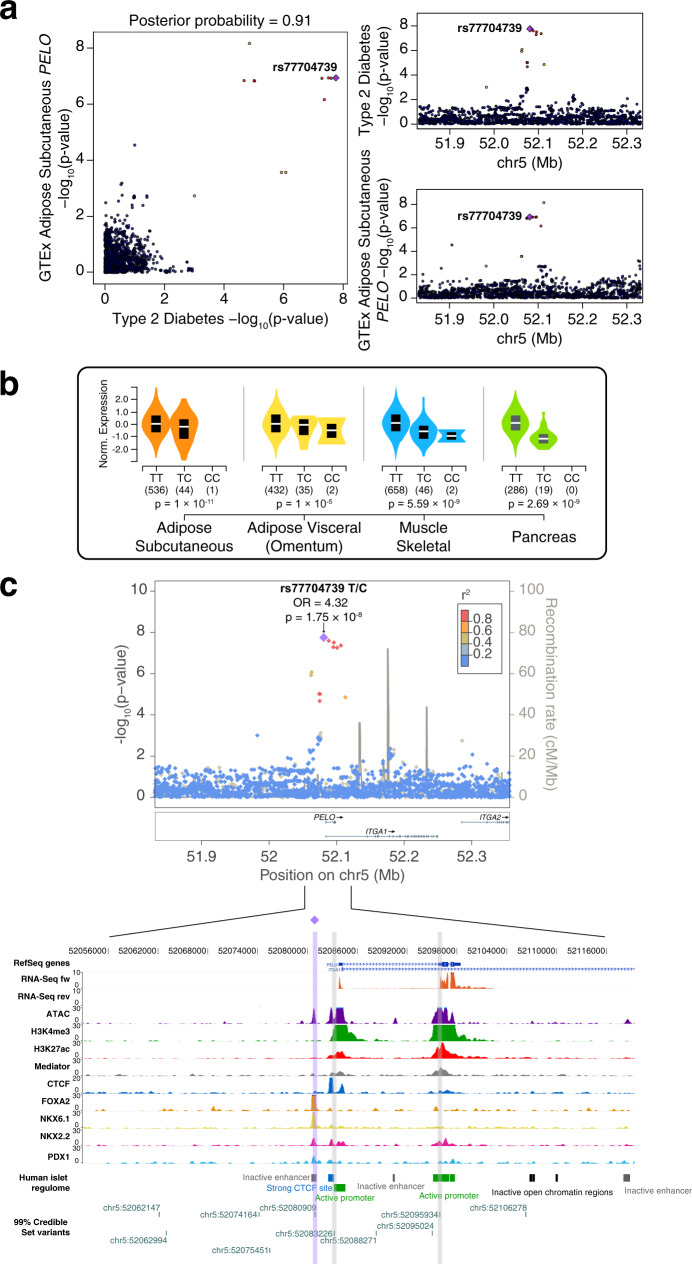
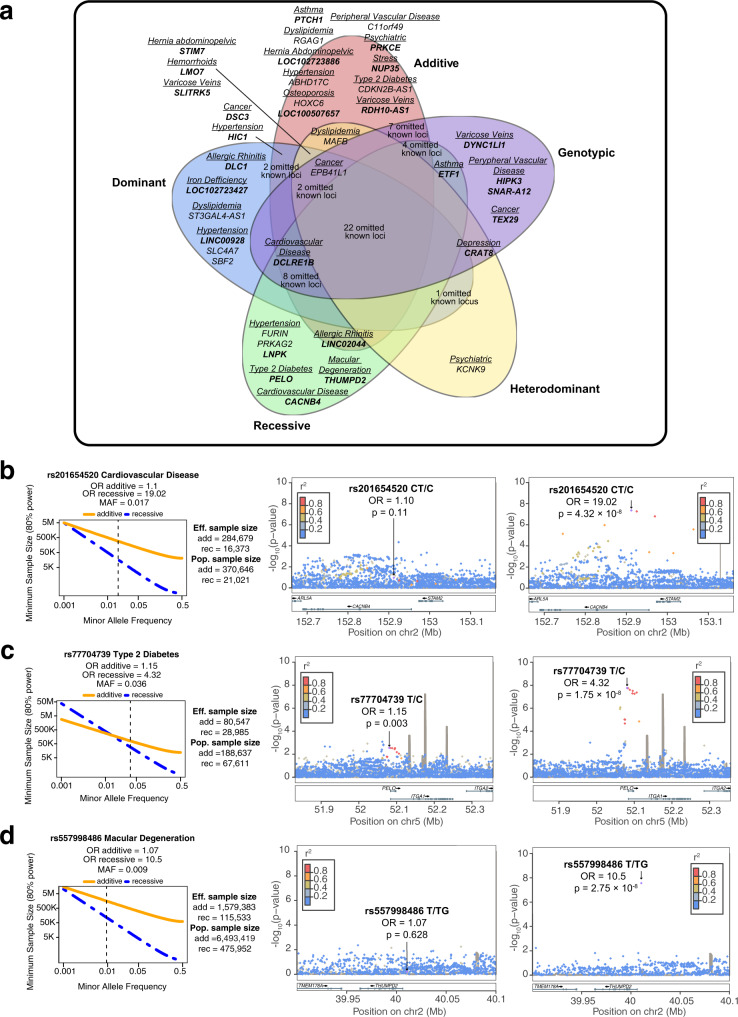
Genome-wide association studies (GWAS) are not fully comprehensive, as current strategies typically test only the additive model, exclude the X chromosome, and use only one reference panel for genotype imputation. We implement an extensive GWAS strategy, GUIDANCE, which improves genotype imputation by using multiple reference panels and includes the analysis of the X chromosome and non-additive models to test for association. We apply this methodology to 62,281 subjects across 22 age-related diseases and identify 94 genome-wide associated loci, including 26 previously unreported. Moreover, we observe that 27.7% of the 94 loci are missed if we use standard imputation strategies with a single reference panel, such as HRC, and only test the additive model. Among the new findings, we identify three novel low-frequency recessive variants with odds ratios larger than 4, which need at least a three-fold larger sample size to be detected under the additive model. This study highlights the benefits of applying innovative strategies to better uncover the genetic architecture of complex diseases.


Conflict of interest statement

The authors declare no competing interests.

Figures

Fig. 1
Fig. 1. Graphical representation illustrating the benefits of combining the results from different reference panels.
a Comparison of the number of variants after the imputation with four reference panels (info score ≥ 0.7), and combining them, colored according to MAF and variant type (SNP vs alternative forms of variation, such as indels). As shown in the bar plot, combining the results from the four reference panels increased the final set of variants for association testing when compared with the results for each of the panels alone (GoNL, UK10K, 1000G Phase 3, or HRC), especially in the low and rare frequency spectrum. For example, we covered up to 5.5 M rare variants (0.01> MAF > 0.001) by combining panels, while only 2.3 M, 2.9 M, 3.2 M, and 3.8 M of rare variants were imputed independently with GoNL, UK10K, 1000G phase 3, and HRC, respectively. b Comparison of the contribution of each reference panel in the combined results. Each bar represents the number of variants that had the best imputation accuracy for a given reference panel. As shown in the figure, although the HRC panel showed overall higher imputation scores, as it provided around 10 of the final 16 M variants, the contribution of the other reference panels, primarily with non-SNP variants, was substantial. Indels seen in the bar plot for HRC correspond to genotyped indels. All variants with info score <0.7, MAF < 0.001, and HWE for controls p < 1.0 × 10−6 were filtered. c Percentage of high-quality imputed variants (IMPUTE2-info score ≥ 0.7) with an allelic dosage R2 ≥ 0.5 between sequenced genotypes in UK10K samples vs variants imputed in the same UK10K samples using 1000G phase 3, GoNL, and HRC reference panels for the autosomes. The percentage of high-quality imputed variants with allelic dosage R2 values (y axis) are represented across several MAF ranges (x-axis) for each of the reference panels and the combined panels imputed results. The combination of the three reference panels outperforms the single reference panels with 97.74% of variants with R2 ≥ 0.5. d Percentage of variants in the X chromosome with an IMPUTE2-info score ≥ 0.7 and with an allelic dosage R2 ≥ 0.5 for UK10K imputed genotypes across MAF ranges for 1000G phase 3, GoNL, and HRC reference panels and the combined results. The combination of the results from the three panels outperforms single reference panels with 93.89% of variants with allelic dosage R2 ≥ 0.5. e Venn Diagram illustrating the loci identified by each reference panel. New loci are depicted in bold. As shown in this figure, only 67 of the 94 GWAS significant loci were identified by all four reference panels, while 27 of them (28.7%) were only identified by one, two, or three of the four panels.
Fig. 2
Fig. 2. Functional characterization of the rs77704739 recessive association near the PELO gene.
a Colocalization plots from LocusCompare for the rs77704739 variant in adipose subcutaneous tissue. As seen in the plots, the signals from both eQTL data and the recessive T2D association results colocalize. b Violin plot from GTEx showing that the recessive rs77704739 variant significantly modifies the expression of PELO gene in subcutaneous (n = 581 independent samples) and visceral adipose tissue (n = 469 independent samples), skeletal muscle (n = 706 independent samples) and pancreas (n = 305 independent samples). The box plots have lines extending from the boxes (whiskers) indicating variability outside the upper and lower quartiles. GTEx V7 was used for colocalization analyses, whereas GTEx V8 was used to generate the violin plots. c Signal plot for chromosome 5 region surrounding rs77704739. Each point represents a variant, with its p-value from the discovery stage on a −log10 scale in the y axis. The x-axis represents the genomic position (hg19). Three credible set variants are located in open chromatin sites in human pancreatic islets, one of them classified as an active promoter and one highly bounded by pancreatic islet-specific transcription factors, such as PDX1, NKX2.2, NKX6.1, and FOXA2.
Fig. 3
Fig. 3. Results from the analysis of additive and non-additive inheritance models.
a The Venn Diagram shows the number of loci that were identified when analyzing multiple inheritance models. As seen in the Venn Diagram, the strongest association for 37 of the 94 associated loci was non-additive. Moreover, the analysis of non-additive models was crucial for the identification of 13 novel (in bold) associated loci. b Power calculation of the rs201654520 indel in CACNB4 associated with cardiovascular disease. The results show that the additive-based test would require a population sample size of 370,646 individuals to find this recessive association, while the population sample size needed for the recessive model was 21,021. c Power calculation of the rs77704739 variant near the PELO gene associated with type 2 diabetes. The results show that the additive-based test would require a population sample size of 188,637 individuals to find this recessive association, while the population sample size needed for the recessive model is 67,611. d Power calculation of the rs557998486 indel near the THUMPD2 gene associated with age-related macular degeneration. The results show that the additive-based test would require a population sample size of 6,493,419 individuals to find this recessive association, while the population sample size for the recessive model is 475,952.

References

    1. Welter D, et al. The NHGRI GWAS Catalog, a curated resource of SNP-trait associations. Nucleic Acids Res. 2014;42:D1001–D1006. doi: 10.1093/nar/gkt1229. - DOI - PMC - PubMed
    1. Manolio TA, et al. Finding the missing heritability of complex diseases. Nature. 2009;461:747–753. doi: 10.1038/nature08494. - DOI - PMC - PubMed
    1. Bonas-Guarch S, et al. Re-analysis of public genetic data reveals a rare X-chromosomal variant associated with type 2 diabetes. Nat. Commun. 2018;9:321. doi: 10.1038/s41467-017-02380-9. - DOI - PMC - PubMed
    1. Taliun D, et al. Sequencing of 53,831 diverse genomes from the NHLBI TOPMed Program. Nature. 2021;590:290–299. doi: 10.1038/s41586-021-03205-y. - DOI - PMC - PubMed
    1. Bycroft C, et al. The UK Biobank resource with deep phenotyping and genomic data. Nature. 2018;562:203–209. - PMC - PubMed

Publication types