. 2021 Apr 23;12(1):2421.
doi: 10.1038/s41467-021-22624-z.

Generation of a humanized Aβ expressing mouse demonstrating aspects of Alzheimer's disease-like pathology

Affiliations

Generation of a humanized Aβ expressing mouse demonstrating aspects of Alzheimer's disease-like pathology

David Baglietto-Vargas et al. Nat Commun. .

Abstract

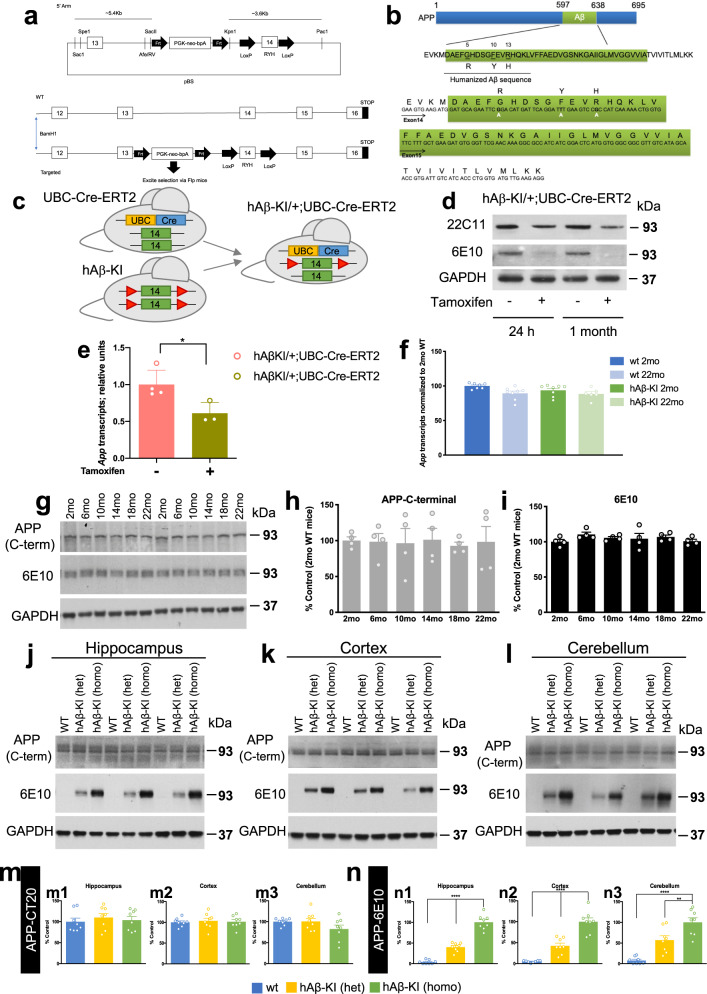
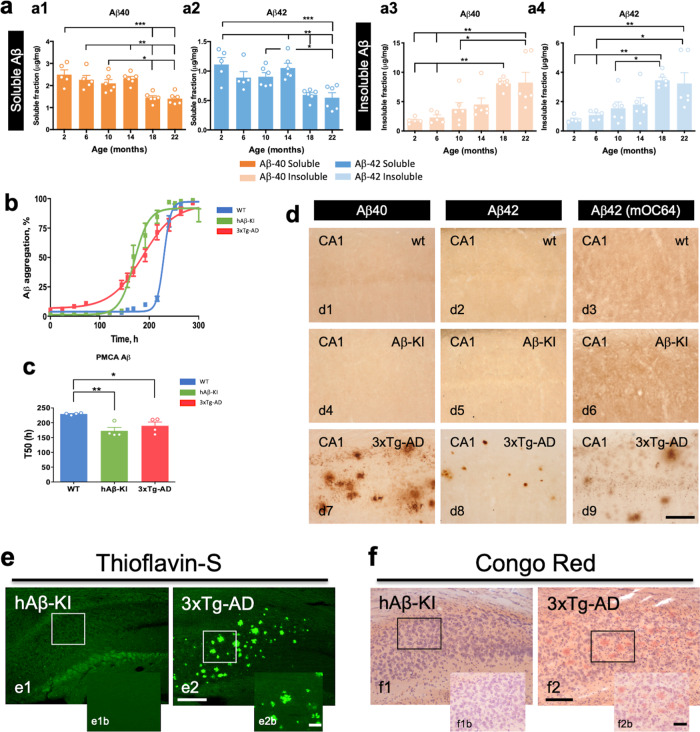
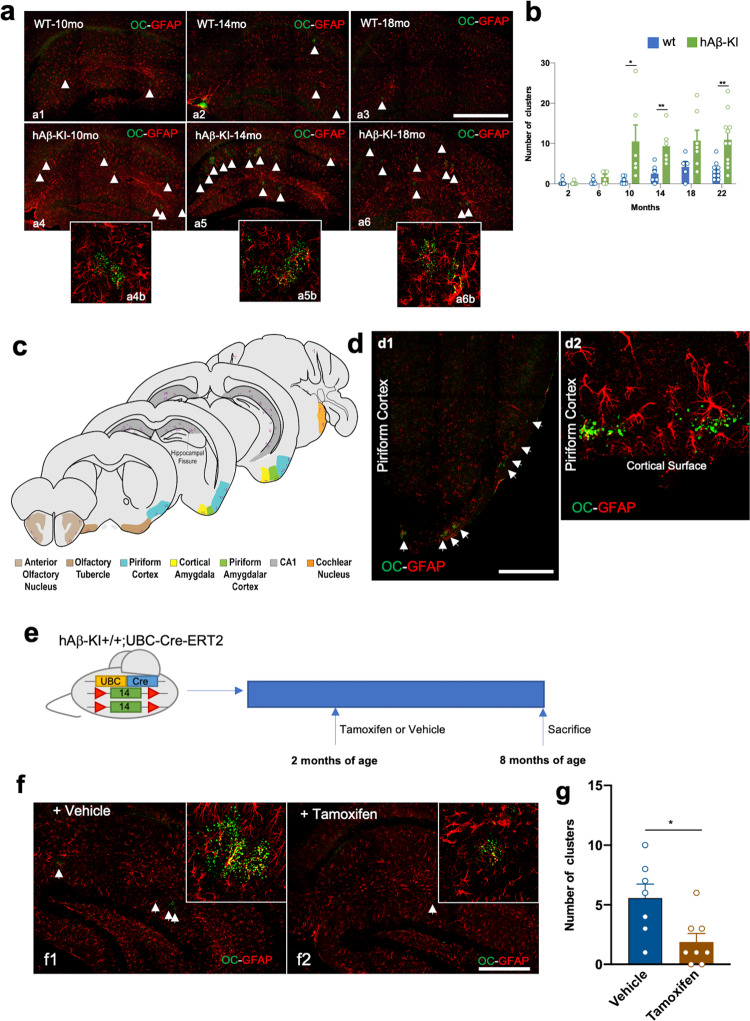
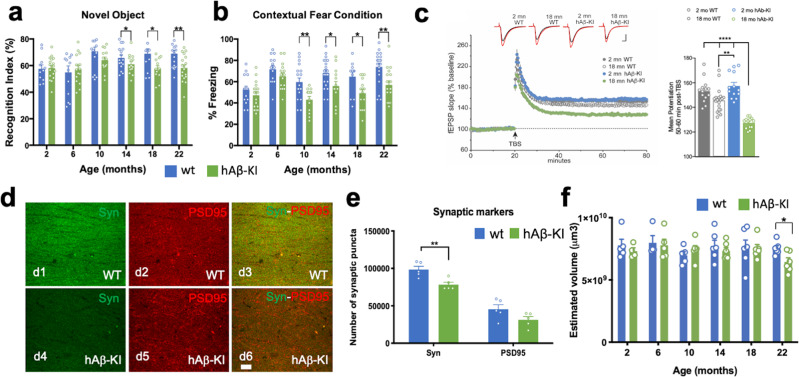
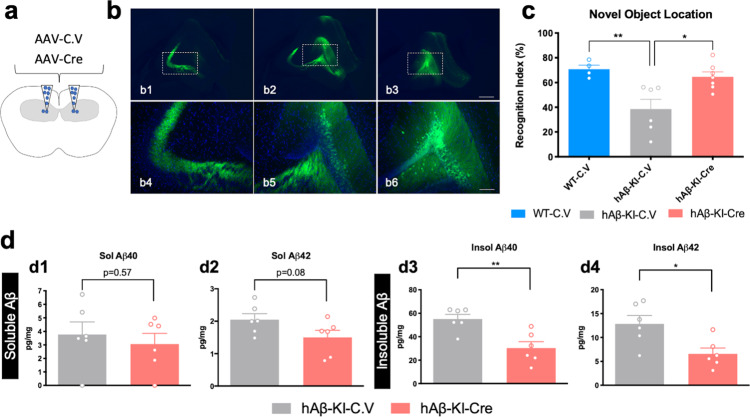
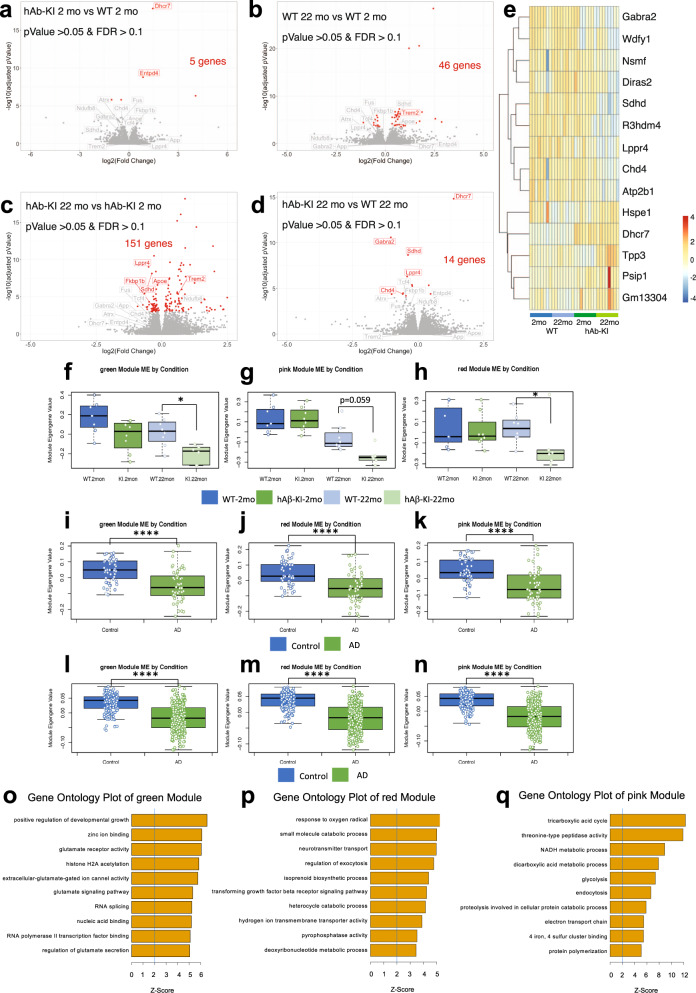
The majority of Alzheimer's disease (AD) cases are late-onset and occur sporadically, however most mouse models of the disease harbor pathogenic mutations, rendering them better representations of familial autosomal-dominant forms of the disease. Here, we generated knock-in mice that express wildtype human Aβ under control of the mouse App locus. Remarkably, changing 3 amino acids in the mouse Aβ sequence to its wild-type human counterpart leads to age-dependent impairments in cognition and synaptic plasticity, brain volumetric changes, inflammatory alterations, the appearance of Periodic Acid-Schiff (PAS) granules and changes in gene expression. In addition, when exon 14 encoding the Aβ sequence was flanked by loxP sites we show that Cre-mediated excision of exon 14 ablates hAβ expression, rescues cognition and reduces the formation of PAS granules.


Conflict of interest statement

The authors declare no competing interests.

Figures

Fig. 1
Fig. 1. Humanized Aβ sequence design and APP levels in the hAβ-KI mice.
a Strategy for production of hAβ-KI mice. b Schematic representation of humanized Aβ in hAβ-KI mice. c Breeding strategy to produce ApphAβ-KI/+; UBC-Cre-ERT2 hemizygous mice (green box = exon 14, red triangle = loxP sequence, yellow and blue box = UBC-Cre-ERT2). d Western-blot analysis showing that Tamoxifen treatment reduces APP expression (22C11 antibody) in brains of ApphAβ-KI/+; UBC-Cre-ERT2 hemizygous mice compared to PBS-treated animals. The hAβ specific product (6E10 antibody) expressed by the floxed hAβ-KI allele is depleted following Tamoxifen treatment. e qPCR analysis of App expression shows decrease in Tamoxifen-treated ApphAβ-KI/+; UBC-Cre-ERT2 hemizygous mice (green) versus PBS-treated mice (pink) (PBS n = 4 and tamoxifen n = 3; unpaired, two-tailed t-test, *p = 0.035). f No difference in App expression in CNS of WT and hAβ-KI homozygous mice at 2 and 22 month of age (transcript level normalized to 2 mo-WT animals; n = 6 in hAβ-KI 22 mo, n = 7 in WT 2 mo and n = 8 in WT 22 mo and hAβ-KI 2 mo) (blue = WT 2 mo, light-blue = WT 22 mo, green = hAβ-KI 2 mo and light-green = hAβ-KI 22 mo). gi Immunoblot analysis of APP recognized by C-terminal APP (CT-20 antibody) (dark-gray) and 6E10 (hAβ-specific) (black) antibody in hippocampal homogenates of hAβ-KI from 2 to 22 months of age (n = 4/genotype/age) shows no differences in APP expression. Representative immunoblot analysis of APP holoprotein using APP-CT20 (detect both mouse and human APP) and 6E10 (recognize only human Aβ) in hippocampal (j), cortical (k) and cerebellar (l) homogenates of WT (blue), hAβ-KI (het) (yellow) and hAβ-KI (homo) (green) (n = 8/genotype). m Quantification of j, k and l shows no difference in APP steady-state level between groups and brain areas. n Quantification of j, k and l by 6E10 antibody shows dose-dependent expression of APP in hAβ-KI homozygous mice in the hippocampus (One-way ANOVA, F2,21 = 124.0, Tukey’s post hoc test, ****p < 0.0001), cortex (One-way ANOVA, F2,21 = 53.43, Tukey’s post hoc test, ****p < 0.0001) and cerebellum (One-way ANOVA, F2,21 = 26.83, Tukey’s post hoc test, **p < 0.01 and ****p < 0.0001) compared to WT mice and hAβ-KI heterozygous mice. Data are presented as mean values ± SEM.
Fig. 2
Fig. 2. Changes in Aβ as a function of age in hAβ-KI mice.
a Aβ40 (orange) and Aβ42 (blue) quantity in hAβ-KI homozygous mice was determined using the MSD V-PLEX Plus Aβ Peptide Panel 1 (6E10) Kit (n = 5 in 2 mo and 6 mo and n = 6 in 10 mo, 14 mo, 18 mo and 22 mo). The ELISA analysis shows that hAβ-KI mice produce high soluble Aβ levels, including Aβ40 (One-way ANOVA, F5,28 = 10.01, Tukey’s post hoc test, *p < 0.05, **p < 0.01 and ***p < 0.001) and Aβ42 (One-way ANOVA, F5,28 = 8.057, Tukey’s post hoc test, *p < 0.05, **p < 0.01 and ***p < 0.001) compared to old hAβ-KI mice (a1 and a2). Opposite effect is observed in insoluble Aβ levels in older hAβ-KI mice compared to younger hAβ-KI mice, including in Aβ40 (One-way ANOVA, F5,28 = 7.21, Tukey’s post hoc test, *p < 0.05 and **p < 0.01) and Aβ42 (One-way ANOVA, F5,28 = 6.543, Tukey’s post hoc test, *p < 0.05 and **p < 0.01) (a3-a4). b Aβ-PMCA shows accelerated in vitro aggregation using hAβ-KI (green) and 3xTg-AD (red) brain homogenate to seed monomeric Aβ compared to WT (blue) controls (n = 4/genotype). c Shorter time to reach 50% of total aggregation, measured by thioflavin-T emission levels (n = 4/genotype) (One-way ANOVA, F2,11 = 9.083; Tukey’s post hoc test, *p < 0.05 and **p < 0.01). d Immunohistochemistry performed with Aβ40 and Aβ42 antibodies showed no sign of aggregates (plaques) for Aβ isoforms in hAβ-KI mice at 22-month of age (d4–d6). As a positive control, 3xTg-AD mice were used with significant Aβ40 and Aβ42 aggregates present at 22-month of age (d7–d9). WT mice showed no staining for both Aβ isoforms (d1–d3). 22-month-old hAβ-KI mice and 3xTg-AD mice were stained with thioflavin-S (Thio-S) (e) or Congo Red (f) stain. No fibrillar aggregated stained with Thio-S or Congo red is observed in hAβ-KI (e1 and f1). As a positive control, 3xTg-AD mice were used with fibrillary extracellular aggregates positive for Thio-S and Congo Red present in the hippocampus (e2 and f2). Data are presented as mean values ± SEM. Scale bar: 200 μm (e1, e2, f1 and f2), 100 μm (d1–d9) and 50 μm (e1b, e2b, f1b and f2b).
Fig. 3
Fig. 3. Human wild-type Aβ exacerbates the formation of OC+ clusters in the hippocampus of hAβ-KI mice.
a Representative images for astrocytes and OC+ cluster in WT (a1–a3) and homozygous hAβ-KI (a4–a6) mice across their lifespans (individual clusters highlighted by white arrowheads). Confocal images showed the association of the astrocytes with OC+ granules (a4b–a6b) in hAβ-KI mice. b Quantification of the number of OC+ clusters/hippocampal section at each age in homozygous hAβ-KI (green) and WT (blue) mice (WT 2 mo = 16, 6 mo = 6; 10 mo = 6; 15 mo = 6; 18 mo = 5; 22 mo = 10; hAβ-KI 2 mo = 9; 6 mo = 6; 10 mo = 6, unpaired, two-tailed t-test, *p = 0.0411; 14 mo = 6, unpaired, two-tailed t-test, **p = 0.0070; 18 mo = 7; 22 mo = 11, unpaired, two-tailed t-test, **p = 0.0022). c Schematic representation of OC+ clusters of granules distribution in the brain of hAβ-KI mice (light brown = Anterior Olfactory Nucleus, brown = Olfactory Tubercle, blue = Piriform Cortex, yellow = Cortical Amygdala, green = Piriform Amygdalar Cortex, gray = CA1 and orange = Cochlear nucleus). Graphic adapted from Image 26, 47, 73, 81 and 110 of the Allen Mouse Brain Atlas. Copyright 2004, Allen Institute for Brain Science. Available from https://mouse.brain-map.org/static/atlas. d Immunostaining for astrocytes (GFAP, red channel) and protofibrils (OC, green channel) shows their accumulation in the piriform cortex, lining the cortical edge in hAβ-KI (d1) and WT (d2) mice. e Experimental design in which hAβ-KI homozygous; UBC-CREERT2 hemizygous mice are treated with tamoxifen or vehicle for 6 months (green box = exon 14, red triangle = loxP sequence, yellow and blue box = UBC-Cre-ERT2). Mice were sacrificed at 8-month of age. f Immunostaining for astrocytes (GFAP, red) and protofibrils (OC, green) in the hippocampus of either vehicle or tamoxifen-treated hAβ-KI homozygous; UBC-CREERT2 hemizygous mice. g Quantification of OC+ granular clusters in vehicle (blue) and Tamoxifen (brown) treated hAβ-KI homozygous; UBC-CREERT2 hemizygous mice (Vehicle n = 7, Tamoxifen n = 8; unpaired, two-tailed t-test, *p = 0.0160). Data are presented as mean values ± SEM. Scale bar: 300 μm (a1–a6 and f1–f2) and 200 μm (d1–d2).
Fig. 4
Fig. 4. OC+ clusters formation are exacerbated by presenilin 1 mutation in hAβ-KI mice.
a hAβ-KI mice (gray) are bred to homozygosity with PS1M146V mice (green) and aged to 18 months. b Aβ40 and Aβ42 levels in hAβ-KI (dark-gray) and hAβ-KI/PS1M146VKI (green) homozygous mice were quantified using the MSD V-PLEX Plus Aβ Peptide Panel 1 (6E10) Kit (n = 6 in hAβ-KI/PS1M146VKI group and n = 8 in hAβ-KI group). Soluble Aβ40 (b1, unpaired, two-tailed t-test, **p = 0.0041) and Aβ42 (b2, unpaired, two-tailed t-test, ****p < 0.0001) and insoluble Aβ40 (b3, unpaired, two-tailed, t-test ***p = 0.0009) and Aβ42 (b4, unpaired, two-tailed t-test, **p = 0.0013) showed an increase in hAβ-KI/PS1M146VKI compared to hAβ-KI mice. c Immunostaining for astrocytes (GFAP, red) and protofibrils (OC, green) shows accumulation of OC+ clusters in the hippocampus (high magnification images; c1b–c3b). AmyloGlo stain (blue channel) in hAβ-KI/PS1M146VKI homozygous mice (c4) shows that this line did not generate fibrillar aggregates. dg Quantification of (c) showing the number of clusters per hippocampal slice (d) the average number of OC+ granules within an individual cluster (WT n = 6, hAβ-KI n = 18, hAβ-KI/PS1M146VKI n = 15; ANOVA, F2,45 = 13.11, Tukey’s post hoc test, **p < 0.01 and ***p < 0.001) (e) the average area of a single granule (WT n = 5, hAβ-KI n = 7, hAβ-KI/PS1M146VKI n = 10, One-way ANOVA, F2,19 = 0.1043, Tukey’s post hoc test, *p < 0.05), (f) and the average area taken up by a cluster (WT n = 5, hAβ-KI n = 7, hAβ-KI/PS1M146VKI n = 10, One-way ANOVA, F2,19 = 2.534, Tukey’s post hoc test, *p < 0.05), (g) in 18-month WT (blue), hAβ-KI (dark-gray) and hAβ-KI/PS1M146VKI (green) mice (WT n = 5, hAβ-KI n = 7, hAβ-KI/PS1M146VKI n = 10, One-way ANOVA, F2,19 = 0.1639, Tukey’s post hoc test, **p < 0.01). hk Densitometric analysis using Imaris software to quantify density (h) and cell area (WT n = 6, hAβ-KI n = 7, hAβ-KI/PS1M146VKI n = 9) (i) of GFAP+ astrocytes or the density (j) and cell area (k) of IBA1+ microglia cells in 18-month WT (blue), hAβ-KI (dark-gray) and hAβ-KI/PS1M146VKI (green) mice (WT n = 7, hAβ-KI n = 7, hAβ-KI/PS1M146VKI n = 9, One-way ANOVA, F2,20 = 1.716, Tukey’s post hoc test, **p < 0.01 and F2,20 = 4.435, Tukey’s post hoc test, **p < 0.01). Data are presented as mean values ± SEM. Scale bar: 300 μm (c1–c3) and 100 μm (c4–c4b).
Fig. 5
Fig. 5. Phenotypic alterations in CNS of hAβ-KI mice.
a hAβ-KI (green) mice showed cortical deficits at 14, 18 and 22 months compared to WT (blue mice) (unpaired, two-tailed t-test, 14 mo *p = 0.0381, 18 mo *p = 0.0131 and 22 mo **p = 0.0024) (WT 2 mo n = 11, 6 mo n = 13, 10 mo and 14 mo n = 16, 18 mo n = 12, and 22 mo n = 20; hAβ-KI 2 mo, 18 mo and 22 mo n = 18, 6 mo n = 16, 10 mo n = 13 and 14 mo n = 14). b Hippocampal deficits were also observed in hAβ-KI (green) mice at 10, 14, 18 and 22 months compared to WT (blue) mice (unpaired, two-tailed t-test, 10 mo **p = 0.0037, 14 mo *p = 0.0239, 18 mo *p = 0.0112 and 22 mo **p = 0.0020) (WT 2 mo n = 15, 6 mo n = 14, 10 mo n = 18, 14 mo n = 20, 18 mo n = 12, 22 mo n = 19; hAβ-KI 2 mo and 22 mo n = 18, 6 mo and 18 mo n = 15, 10 mo n = 13 and 14 mo n = 14). c Acute hippocampal slices were examined for changes in synaptic plasticity in 2 and 18-month-old WT (gray = 2 mo and white = 18 mo) and hAβ-KI (blue = 2 mo and green = 18 mo) mice. Theta burst induced LTP was impaired in slices from hAβ-KI mice (2 mo and 18 mo n = 13 slices) relative to aged-matched WT controls (2 mo n = 14 slices, 18 mo n = 20 slices). Synaptic responses in control pathway remained stable (no theta stimulation) throughout the recording session. Insets show field synaptic responses collected during baseline (black line) and 1 h after theta burst stimulation (red line). Scale: 1 mV/5 ms. Mean (±SEM) percent potentiation 50–60 min post-TBS was markedly depressed in slices from hAβ-KI mice relative to WT controls (two-way ANOVA, major effect in interaction F1,56 = 22.46 and age factor F1,56 = 64.52, Tukey’s post hoc test, **p < 0.01 and ****p < 0.0001). d, e Confocal images of synaptic puncta stained with synaptophysin (green) and PSD-95 (red) antibodies, shows a significant decrease at presynaptic level in hAβ-KI (d4–d6; green) versus WT (d1–d3; blue) mice at 18 months (unpaired, two-tailed t-test, **p = 0.0062) (n = 5/genotype). f Cavalieri method shows significant differences in hippocampal volume between WT (blue) and hAβ-KI (green) mice at 22 months of age (unpaired, two-tailed t-test, *p = 0.0199; n = 4 in 6 mo-WT and 2 mo-hAβ-KI, n = 5 in 2 mo-WT, 10 mo-WT and 6 mo-hAβ-KI, n = 6 in 14 mo, 18 mo, 22 mo-WT and 10 mo, 14 mo, 18 mo and 22 mo-hAβ-KI). Data are presented as mean values ± SEM. Scale bar: 10 μm (d1–d6).
Fig. 6
Fig. 6. Cre-mediated deletion of Aβ encoding exon ameliorates the hippocampal memory deficits in hAβ-KI mice.
a Schematic diagram of AAV delivery in the hippocampus (coronal section). b Representative images of AAV-CAMKII-GFP construct expression in the hippocampus. c Cognitive performance (OLM) of 25-mo WT and hAβ-KI homozygous mice treated with control AAV-CAMKII and experimental AAV-CAMKII-Cre vectors (One-way ANOVA, F2,14 = 5.971; Tukey’s post hoc test, *p < 0.05 and **p < 0.01)) (blue = WT-C.V, gray = hAβ-KI-C.V and red = hAβ-KI-Cre). (n = 4 in WT-C.V, n = 6 in hAβ-KI-C.V and n = 7 in hAβ-KI-Cre). d Hippocampal Aβ40 and Aβ42 was quantified by MSD V-PLEX Plus Aβ Peptide Panel 1 (6E10) Kit (n = 6/genotype/treatment) (gray = hAβ-KI-C.V and red = hAβ-KI-Cre), showing a significant decrease in soluble Aβ40 (unpaired, two-tailed t-test, p = 0.057) and Aβ42 (unpaired, two-tailed t-test, p = 0.08) and insoluble Aβ40 (unpaired, two-tailed, t-test **p = 0.0042) and Aβ42 (unpaired, two-tailed t-test, *p = 0.0149) in hAβ-KI-Cre compared to hAβ-KI-C.V mice. Data are presented as mean values ± SEM. Scale bar: 400 μm (b1–b3), 100 μm (b4–b6). AAV-CAMKII-GFP construct were defined in the figures as control vector (C.V) and AAV-CAMKII-Cre as Cre.
Fig. 7
Fig. 7. Transcriptomic analysis in hAβ-KI mice.
Differential gene expression analysis was performed comparing 2 months WT and hAβ-KI mice (a), 2 and 22 months WT mice (b), 2 and 22 months hAβ-KI mice (c) and 22 months WT and hAβ-KI mice (d), differentially expressed gene were selected following p < 0.05 and FDR < 0.1 values (n = 6 in hAβ-KI 22 mo, n = 7 in WT 2 mo and n = 8 in WT 22 mo and hAβ-KI 2 mo). e Heatmap of group d of genes with p < 0.05 and FDR < 0.1 were represented with expression data from the 2 months WT and hAβ-KI mice added. Module eigengene trajectory of green (f), pink (g) and red (h) modules in WT and hAβ-KI mice at 2 and 22 months (n = 6 in hAβ-KI 22 mo, n = 7 in WT 2 mo and n = 8 in WT 22 mo and hAβ-KI 2 mo) (blue = WT 2 mo, light-blue = WT 22 mo, green = hAβ-KI 2 mo and light-green = hAβ-KI 22 mo). Module eigengene trajectory of green (i), red (j) and pink (k) modules in human temporal cortex AD data (, n = 160 samples) (blue = control and green = AD). Module eigengene trajectory of green (l), red (m) and pink (n) modules in human AD frontal cortex data (, n = 680 samples) (blue = control and green = AD). In all the boxplots, the upper and lower lines represent the 75th and 25th percentiles, respectively, while the center line represents the median (unpaired, two-tailed, t-test *p < 0.05 and ****p < 0.0001 were used). Gene ontology term enrichment for green (o), red (p) and pink (q) modules.

References

    1. Dawson TM, Golde TE, Lagier-Tourenne C. Animal models of neurodegenerative diseases. Nat. Neurosci. 2018;21:1370–1379. doi: 10.1038/s41593-018-0236-8. - DOI - PMC - PubMed
    1. Gotz J, Bodea LG, Goedert M. Rodent models for Alzheimer disease. Nat. Rev. Neurosci. 2018;19:583–598. doi: 10.1038/s41583-018-0054-8. - DOI - PubMed
    1. Jankowsky JL, Zheng H. Practical considerations for choosing a mouse model of Alzheimer’s disease. Mol. Neurodegener. 2017;12:89. doi: 10.1186/s13024-017-0231-7. - DOI - PMC - PubMed
    1. Martini AC, Forner S, Trujillo-Estrada L, Baglietto-Vargas D, LaFerla FM. Past to future: what animal models have taught us about Alzheimer’s disease. J. Alzheimers Dis. 2018;64:S365–S378. doi: 10.3233/JAD-179917. - DOI - PubMed
    1. Cummings J, Lee G, Ritter A, Zhong K. Alzheimer’s disease drug development pipeline: 2018. Alzheimers Dement. 2018;4:195–214. doi: 10.1016/j.trci.2018.03.009. - DOI - PMC - PubMed

Publication types

MeSH terms

Substances